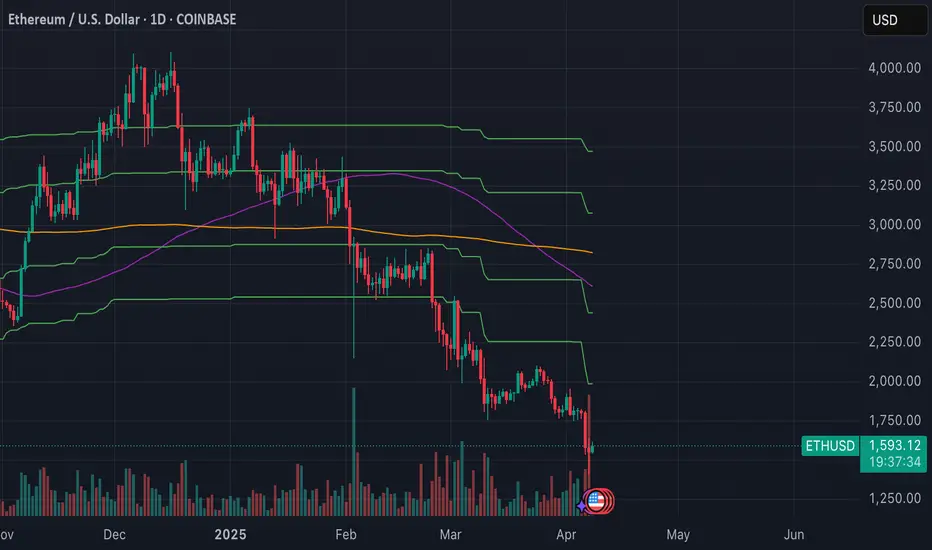
Fibonacci Levels with SMA SignalsThis strategy leverages Fibonacci retracement levels along with the 100-period and 200-period Simple Moving Averages (SMAs) to generate robust entry and exit signals for long-term swing trades, particularly on the daily timeframe. The combination of Fibonacci levels and SMAs provides a powerful way to capitalize on major trend reversals and market retracements, especially in stocks and major crypto assets.
The core of this strategy involves calculating key Fibonacci retracement levels (23.6%, 38.2%, 61.8%, and 78.6%) based on the highest high and lowest low over a 365-day lookback period. These Fibonacci levels act as potential support and resistance zones, indicating areas where price may retrace before continuing its trend. The 100-period SMA and 200-period SMA are used to define the broader market trend, with the strategy favoring uptrend conditions for buying and downtrend conditions for selling.
This indicator highlights high-probability zones for long or short swing setups based on Fibonacci retracements and the broader trend, using the 100 and 200 SMAs.
In addition, this strategy integrates alert conditions to notify the trader when these key conditions are met, providing real-time notifications for optimal entry and exit points. These alerts ensure that the trader does not miss significant trade opportunities.
Key Features:
Fibonacci Retracement Levels: The Fibonacci levels provide natural price zones that traders often watch for potential reversals, making them highly relevant in the context of swing trading.
100 and 200 SMAs: These moving averages help define the overall market trend, ensuring that the strategy operates in line with broader price action.
Buy and Sell Signals: The strategy generates buy signals when the price is above the 200 SMA and retraces to the 61.8% Fibonacci level. Sell signals are triggered when the price is below the 200 SMA and retraces to the 38.2% Fibonacci level.
Alert Conditions: The alert conditions notify traders when the price is at the key Fibonacci levels in the context of an uptrend or downtrend, allowing for efficient monitoring of trade opportunities.
Application:
This strategy is ideal for long-term swing trades in both stocks and major cryptocurrencies (such as BTC and ETH), particularly on the daily timeframe. The daily timeframe allows for capturing broader, more sustained trends, making it suitable for identifying high-quality entries and exits. By using the 100 and 200 SMAs, the strategy filters out noise and focuses on larger, more meaningful trends, which is especially useful for longer-term positions.
This script is optimized for swing traders looking to capitalize on retracements and trends in markets like stocks and crypto. By combining Fibonacci levels with SMAs, the strategy ensures that traders are not only entering at optimal levels but also trading in the direction of the prevailing trend.
Индикаторы и стратегии
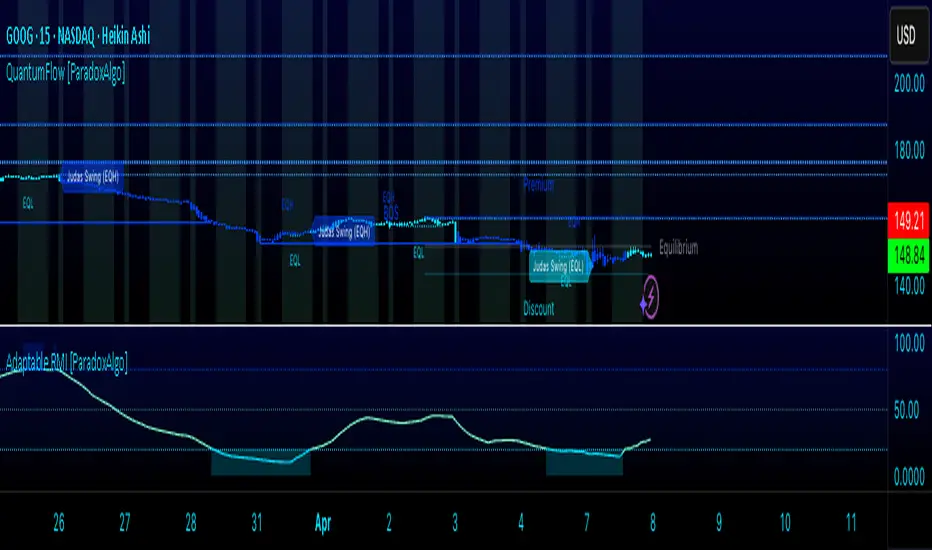
Adaptable Relative Momentum Index [ParadoxAlgo]The Adaptable Relative Momentum Index (RMI) by ParadoxAlgo is an advanced momentum-based indicator that builds upon the well-known RSI (Relative Strength Index) concept by introducing a customizable momentum length. This indicator measures price momentum over a specified number of periods and applies a Rolling Moving Average (RMA) to both the positive and negative price changes. The result is a versatile tool that can help traders gauge the strength of a trend, pinpoint overbought/oversold levels, and potentially identify breakout opportunities.
⸻
Smart Configuration Feature
What sets this version of the RMI apart is ParadoxAlgo’s exclusive “Smart Configuration” functionality. Instead of manually adjusting parameters, traders can simply select their Asset Class (e.g., Stocks, Forex, Futures/Indices, Crypto, Commodities) and Trading Style (e.g., Scalping, Day Trading, Swing Trading, Short-Term Investing, Long-Term Investing). Based on these selections, the indicator automatically optimizes its core parameters:
• Length – The period over which the price changes are smoothed.
• Momentum Length – The number of bars used to calculate the price change.
By automating this process, users save time on tedious trial-and-error adjustments, ensuring that the RMI’s settings are tailored to the characteristics of specific markets and personal trading horizons.
⸻
Key Features & Benefits
1. Momentum-Based Insights
• Uses RMA to smooth price movements, helping identify shifts in market momentum more clearly than a basic RSI.
• Enhanced adaptability for a wide range of asset classes and time horizons.
2. Simple Yet Powerful Configuration
• Smart Configuration automatically sets optimal parameter values for each combination of asset class and trading style.
• Eliminates guesswork and manual recalibration when switching between markets or timeframes.
3. Overbought & Oversold Visualization
• Integrated highlight zones mark potential overbought and oversold extremes (default at 80 and 20).
• Optional breakout highlighting draws attention to times when the indicator crosses these key thresholds, helping spot possible entry or exit signals.
4. Intuitive Design & Ease of Use
• Clean plotting and color-coded signal lines make it easy to interpret bullish or bearish shifts in momentum.
• Straightforward dropdown menus keep the interface user-friendly, even for novice traders.
⸻
Practical Applications
• Early Trend Detection: Spot emerging trends when the RMI transitions from oversold to higher levels or vice versa.
• Breakout Confirmation: Confirm potential breakout trades by tracking overbought/oversold breakouts alongside other technical signals.
• Support/Resistance Confluence: Combine RMI signals with horizontal support/resistance levels to reinforce trade decisions.
• Trade Timing: Quickly gauge when momentum could be shifting, helping you time entries and exits more effectively.
⸻
Disclaimer
As with any technical indicator, the Adaptable Relative Momentum Index should be used as part of a broader trading strategy that includes risk management, fundamental analysis, and other forms of technical confirmation. Past performance does not guarantee future results.
⸻
Enjoy using the Adaptable RMI and experience a more streamlined, flexible approach to momentum analysis. Feel free to explore different asset classes and trading styles to discover which configurations resonate best with your unique trading preferences.
RSI Support & Resistance Breakouts with OrderblocksThis tool is an overly simplified method of finding market squeeze and breakout completely based on a dynamic RSI calculation. It is designed to draw out areas of price levels where the market is pushing back against price action leaving behind instances of short term support and resistance levels you otherwise wouldn't see with the common RSI.
It uses the changes in market momentum to determine support and resistance levels in real time while offering price zone where order blocks exist in the short term.
In ranging markets we need to know a couple things.
1. External Zone - It's important to know where the highs and lows were left behind as they hold liquidity. Here you will have later price swings and more false breakouts.
2. Internal Zone - It's important to know where the highest and lowest closing values were so we can see the limitations of that squeeze. Here you will find the stronger cluster of orders often seen as orderblocks.
In this tool I've added a 200 period Smoothed Moving Average as a trend filter which causes the RSI calculation to change dynamically.
Regular Zones - without extending
The Zones draw out automatically but are often too small to work with.
To solve this problem, you can extend the zones into the future up to 40 bars.
This allows for more visibility against future price action.
--------------------------------------------
Two Types of Zones
External Zones - These zones give you positioning of the highest and lowest price traded within the ranging market. This is where liquidity will be swept and often is an ultimate breaking point for new price swings.
How to use them :
External Zones - External zones form at the top of a pullback. After this price should move back into its impulsive wave.
During the next corrective way, if price breaches the top of the previous External Zone, this is a sign of trend weakness. Expect a divergence and trend reversal.
Internal Zones - (OrderBlocks) Current price will move in relation to previous internal zones. The internal zone is where a majority of price action and trading took place. It's a stronger SQUEEZE area. Current price action will often have a hard time closing beyond the previous Internal Zones high or low. You can expect these zones to show you where the market will flip over. In these same internal zones you'll find large rejection candles.
**Important Note** Size Doesn't Matter
The size of the internal zone does not matter. It can be very small and still very powerful.
Once an internal zone has been hit a few times, its often not relevant any longer.
Order Block Zone Examples
In this image you can see the Internal Zone that was untouched had a STRONG price reaction later on.
Internal Zones that were touched multiple times had weak reactions later as price respected them less over time.
Zone Overlay Breakdown
The Zones form and update in real time until momentum has picked up and price begins to trend. However it leaves behind the elements of the inducement area and all the key levels you need to know about for future price action.
Resistance Fakeout : Later on after the zone has formed, price will return to this upper zone of price levels and cause fakeouts. A close above this zone implies the market moves long again.
Midline Equilibrium : This is simply the center of the strongest traded area. We can call this the Point of Control within the orderblock. If price expands through both extremes of this zone multiple times in the future, it eliminates the orderblock.
Support Fakeout : Just like its opposing brother, price will wick through this zone and rip back causing inducement to trap traders. You would need a clear close below this zone to be in a bearish trend.
BARCOLOR or Candle Color: (Optional)
Bars are colored under three conditions
Bullish Color = A confirmed bullish breakout of the range.
Bearish Color = A confirmed bearish breakout of the range.
Squeeze Color = Even if no box is formed a candle or candles can have a squeeze color. This means the ranging market happened within the high and low of that singular candle.

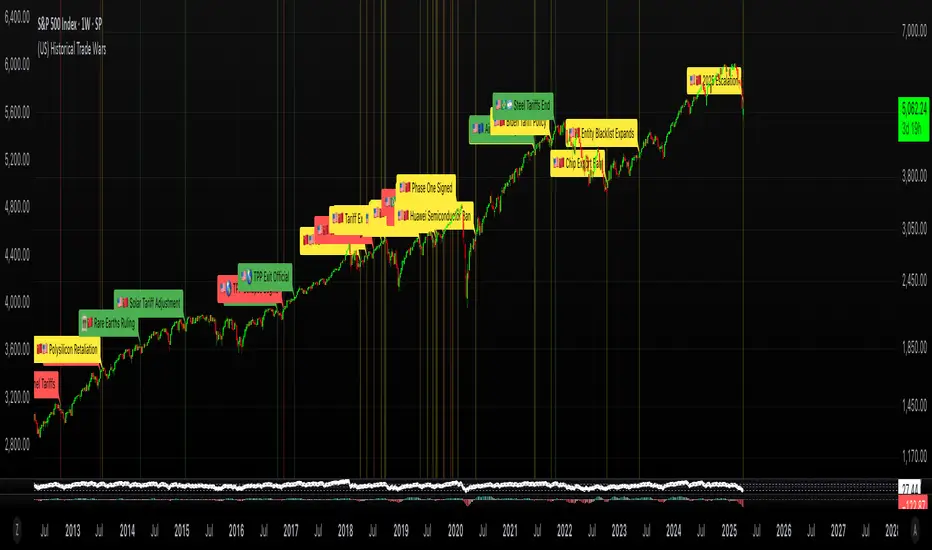
(US) Historical Trade WarsHistorical U.S. Trade Wars Indicator
Overview
This indicator visualizes major U.S. trade wars and disputes throughout modern economic history, from the McKinley Tariff of 1890 to recent U.S.-China tensions. This U.S.-focused timeline is perfect for macro traders, economic historians, and anyone looking to understand how America's trade conflicts correlate with market movements.
Features
Comprehensive U.S. Timeline: Covers 130+ years of U.S.-centered trade disputes with historically accurate dates.
Color-Coded Events:
🔴 Red: Marks the beginning of a U.S. trade war or major dispute.
🟡 Yellow: Highlights significant events within a trade conflict.
🟢 Green: Shows resolutions or ends of trade disputes.
Global Partners/Rivals: Tracks U.S. trade relations with China, Japan, EU, Canada, Mexico, Brazil, Argentina, and others.
Country Flags: Uses emoji flags for easy visual identification of nations in trade relations with the U.S.
Major Trade Wars Covered:
McKinley Tariff (1890-1894)
Smoot-Hawley Tariff Act (1930-1934)
U.S.-Europe Chicken War (1962-1974)
Multifiber Arrangement Quotas (1974-2005)
Japan-U.S. Trade Disputes (1981-1989)
NAFTA and Softwood Lumber Disputes
Clinton and Bush-Era Steel Tariffs
Obama-Era China Tire Tariffs
Rare Earth Minerals Dispute (2012-2014)
Solar Panel Dispute (2012-2015)
TPP and TTIP Negotiations
U.S.-China Trade War (2018-present)
Airbus-Boeing Dispute
Usage
Analyze how markets historically responded to trade war initiations and resolutions.
Identify patterns in market behavior during periods of trade tensions.
Use as an overlay with price action to examine correlations.
Perfect companion for macro analysis on daily, weekly, or monthly charts.
About
This indicator is designed as a historical reference tool for traders and economic analysts focusing on U.S. trade policy and its global impact. The dates and events have been thoroughly researched for accuracy. Each label includes emojis to indicate the U.S. and its trade partners/rivals, making it easy to track America's evolving trade relationships across time.
Note: This indicator works best on larger timeframes (daily, weekly, monthly) due to the historical span covered.
EMA Distance OscillatorI was inspired to make this because I rely on ema trading in my SPY day trading strategy.
## 📈 **EMA Distance Oscillator**
**Author:** *Your Name or Alias*
**Category:** Trend Strength / Momentum
**Timeframes:** Optimized for 1–5min, works on all
---
### 🔍 **What It Does**
The **EMA Distance Oscillator** is a dual-purpose tool that helps visualize **momentum shifts**, **trend strength**, and **EMA divergence/convergence** in real time.
It plots two separate signals:
#### 1. 🟩 Histogram Bars
A zero-centered histogram that shows the **difference between two EMAs** (default: EMA 48 and EMA 200).
- Color-coded based on:
- Whether the EMA spread is **above or below zero**
- Whether the spread is **increasing or decreasing**
- Helps visualize **trend acceleration** or **loss of momentum**
#### 2. 📉 Delta Line
A smooth line showing the **difference between a second EMA pair** (default: EMA 13 and EMA 48).
- Color-coded:
- **White** when rising (spread widening)
- **Gray** when falling (spread tightening)
---
### ⚙️ **Customizable Inputs**
You have full control over:
- EMA lengths for **both histogram and line**
- Smoothing for each plot
- Colors for each bar state and line condition
- Momentum thresholds (±1 by default, adjustable)
---
### 🧠 **How to Use It**
- Use the **bar histogram** to quickly spot moments when short-term and long-term EMAs are diverging or converging
- Use the **delta line** to track smoother shifts in short-term momentum
- Look for:
- Expanding green bars = uptrend gaining strength
- Shrinking bars = potential reversals or cooldowns
- Line crossing zero = EMA crossover (fast vs slow)
- **Threshold lines** at +1 / -1 help mark **high-momentum zones** (fully customizable)
---
### 🧭 **Pro Tips**
- Try with EMA 13/48 for the line and EMA 48/200 for the histogram on 1–5min charts
- Add alerts (optional) for when:
- Histogram changes color (momentum flip)
- Line crosses zero
- Threshold levels are breached
---
Let me know if you want me to help prep alert conditions or auto-generate different versions (e.g., strategy version, simplified mode, mobile-friendly layout, etc).

Multi-Timeframe ATR MonitorThis indicator displays a table of ATR values across multiple user-defined timeframes (1m, 3m, 5m, 15m, 60m, daily by default) and tracks the session range since 18:00. Customize the timeframes and ATR length via inputs.

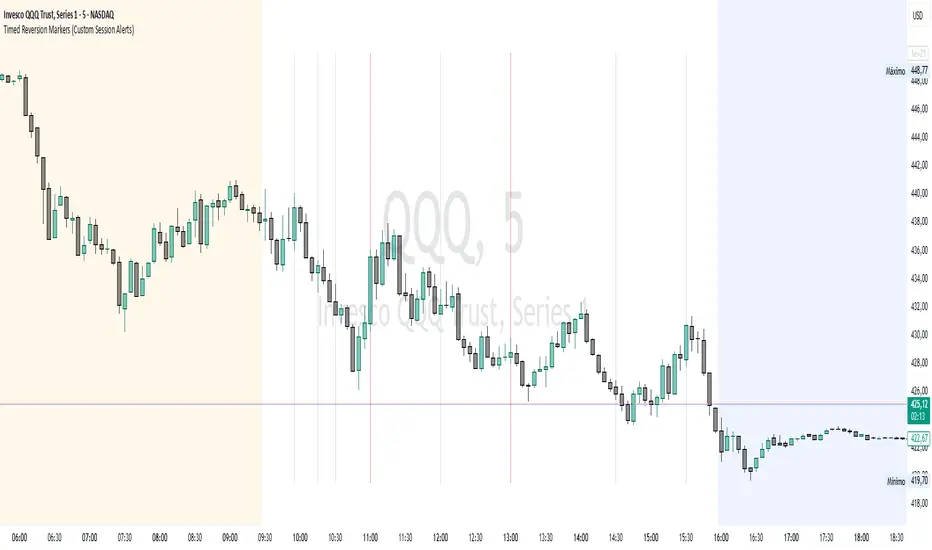
Timed Reversion Markers (Custom Session Alerts)This script plots vertical histogram markers at specific intraday time points defined by the user. It is designed for traders who follow time-based reversion or breakout setups tied to predictable market behavior at key clock times, such as institutional opening moves, midday reversals, or end-of-day volatility.
Unlike traditional price-action indicators, this tool focuses purely on time-based triggers, a technique often used in time cycle analysis, market internals, and volume-timing strategies.
The indicator includes eight fully customizable time inputs, allowing users to mark any intraday minute with precision using a decimal hour format (for example, 9.55 for 9:55 AM). Each input is automatically converted into hour and minute format, and a visual histogram marker is plotted once per day at that exact time.
Example use cases:
Mark institutional session opens (e.g., 9:30, 10:00, 15:30)
Time-based mean reversion or volatility windows
Backtest recurring time-based reactions
Highlight algorithmic spike zones
The vertical plots serve as non-intrusive, high-contrast visual markers for scalping setups, session analysis, and decision-making checkpoints. All markers are displayed at the top of the chart without interfering with price candles.
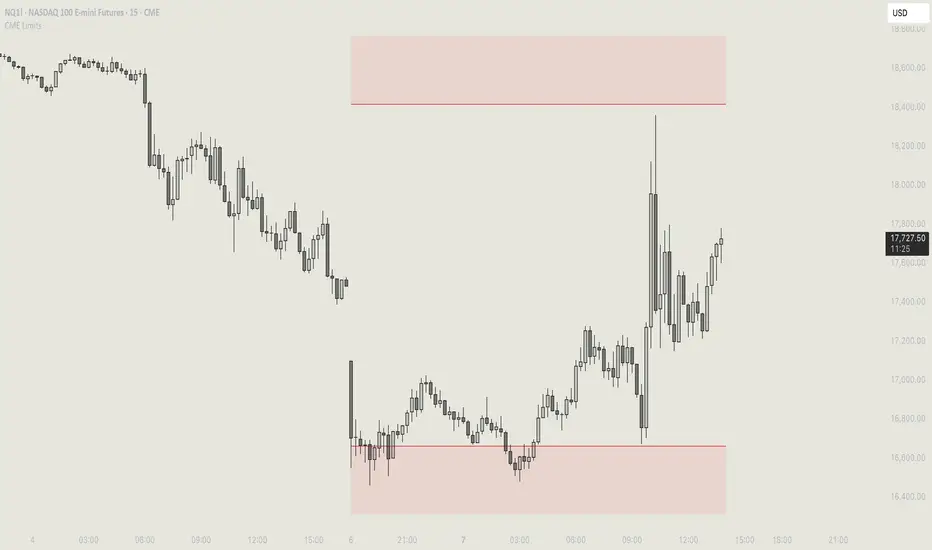
CME Price Limits (Futures Prop Firm Rule)This indicator shows the CME Price Limit, combined with a safety distance that is used by several futures prop firms. Trading in the highlighted area means a rule violation for many Futures prop firm accounts.
The levels are calculated from the "Settlement as close" closing price of the previous daily candle.
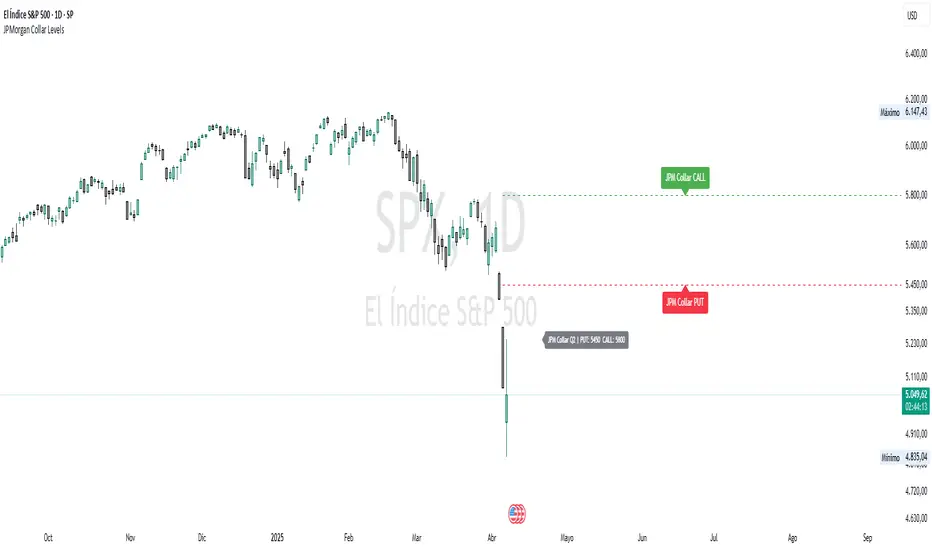
JPMorgan Collar LevelsThis indicator visualizes the current JPMorgan Hedging Collar strategy commonly used by institutional funds like JHEQX. It plots three key levels:
– Short Call strike (upper bound)
– Long Put strike (protection level)
– Short Put strike (cost reduction)
The area between the long put and short call is shaded to represent the active hedging zone. This setup is updated quarterly and can influence SPX market behavior near expiration dates.
Inputs are customizable to reflect the latest collar configuration. Useful for traders tracking institutional hedging flows or analyzing market structure near key option expirations.
[SM-042] EMA 5-8-13 with ADX FilterWhat is the strategy?
The strategy combines three exponential moving averages (EMAs) — 5, 8, and 13 periods — with an optional ADX (Average Directional Index) filter. It is designed to enter long or short positions based on EMA crossovers and to exit positions when the price crosses a specific EMA. The ADX filter, if enabled, adds a condition that only allows trades when the ADX value is above a certain threshold, indicating trend strength.
Who is it for?
This strategy is for traders leveraging EMAs and trend strength indicators to make trade decisions. It can be used by anyone looking for a simple trend-following strategy, with the flexibility to adjust for trend strength using the ADX filter.
When is it used?
- **Long trades**: When the 5-period EMA crosses above the 8-period EMA, with an optional ADX condition (if enabled) that requires the ADX value to be above a specified threshold.
- **Short trades**: When the 5-period EMA crosses below the 8-period EMA, with the ADX filter again optional.
- **Exits**: The strategy exits a long position when the price falls below the 13-period EMA and exits a short position when the price rises above the 13-period EMA.
Where is it applied?
This strategy is applied on a chart with any asset on TradingView, with the EMAs and ADX plotted for visual reference. The strategy uses `strategy.entry` to open positions and `strategy.close` to close them based on the set conditions.
Why is it useful?
This strategy helps traders identify trending conditions and filter out potential false signals by using both EMAs (to capture short-term price movements) and the ADX (to confirm the strength of the trend). The ADX filter can be turned off if not desired, making the strategy flexible for both trending and range-bound markets.
How does it work?
- **EMA Crossover**: The strategy enters a long position when the 5-period EMA crosses above the 8-period EMA, and enters a short position when the 5-period EMA crosses below the 8-period EMA.
- **ADX Filter**: If enabled, the strategy checks whether the ADX value is above a set threshold (default is 20) before allowing a trade.
- **Exit Conditions**: Long positions are closed when the price falls below the 13-period EMA, and short positions are closed when the price rises above the 13-period EMA.
- **Plotting**: The strategy plots the three EMAs and the ADX value on the chart for visualization. It also displays a horizontal line at the ADX threshold.
This setup allows for clear decision-making based on the interaction between different time-frame EMAs and trend strength as indicated by ADX.

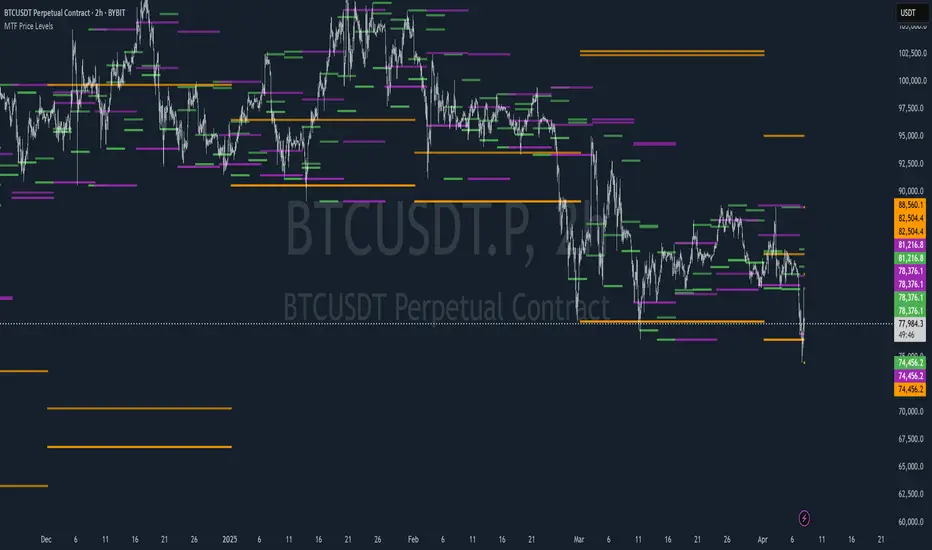
Multi-Timeframe Price LevelsThis indicator displays key price levels from multiple timeframes on your chart, helping you identify important support and resistance zones.
## Features
- **Multiple Timeframes**: View price levels from 4H, Daily, 3-Day, Weekly, and Monthly charts simultaneously
- **Customizable Price Types**: Choose to display Open, Close, High, and Low prices
- **Color-Coded**: Each timeframe has its own color for easy identification
- **Fully Customizable**: Enable/disable specific timeframes and price types as needed
## How to Use
1. Add the indicator to your chart
2. Use the input options to select which timeframes and price types you want to display
3. Look for areas where multiple price levels converge - these often act as strong support/resistance zones
## Color Guide
- **Red**: 4-Hour timeframe
- **Blue**: Daily timeframe
- **Green**: 3-Day timeframe
- **Purple**: Weekly timeframe
- **Orange**: Monthly timeframe
For each timeframe, the transparency varies by price type:
- Open: 70% transparency
- Close: 50% transparency
- High: 30% transparency
- Low: 10% transparency (most visible)
## Trading Applications
- Identify key support and resistance levels
- Spot multi-timeframe confluences for stronger trade setups
- Plan entries and exits based on historical price reactions
- Set stop losses and take profit targets at significant levels
This indicator works best when combined with your existing trading strategy to confirm important price zones.
Previous Candle Range Split into ThirdsThis script plots two horizontal lines over the previous candle to divide its total range (high to low) into three equal parts. The first line marks 33% of the range from the low, and the second marks 66%. This helps users visually identify whether the previous candle closed in the lower, middle, or upper third of its range, providing context on potential buyer or seller dominance during that session.
Users can customize the color, width, and style (solid, dotted, dashed) of each line, as well as toggle their visibility from the script's input settings.
This indicator is designed as a discretionary analysis tool and does not generate buy or sell signals.

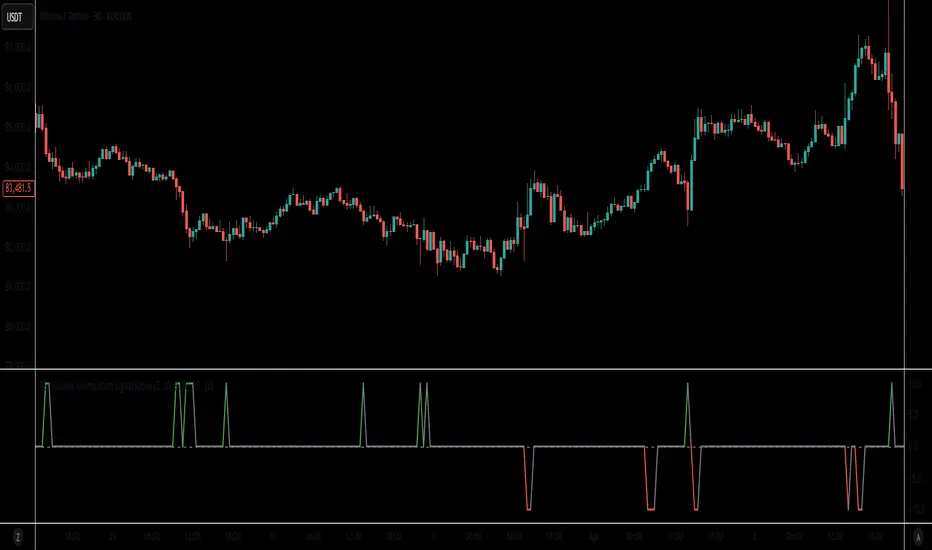
RSI-Volume Momentum Signal ScoreRSI-Volume Momentum Signal Score
Description
The RSI-Volume Momentum Signal Score is a predictive technical indicator designed to identify bullish and bearish momentum shifts by combining volume-based momentum with the Relative Strength Index (RSI). It generates a Signal Score derived from:
• The divergence between short-term and long-term volume (Volume Oscillator), and
• RSI positioning relative to a user-defined threshold.
This hybrid approach helps traders detect early signs of price movement based on volume surges and overbought/oversold conditions.
The Signal Score is computed as follows:
Signal Score = Volume Momentum x RSI Divergence Factor
Volume Momentum = tanh ((Volume Oscillator value (vo) – Volume Threshold)/Scaling Factor)
RSI Divergence Factor = ((RSI Threshold – RSI Period)/Scaling Factor)
Or,
Signal Score = tanh((vo - voThreshold) / scalingFactor) * ((rsiThreshold - rsi) / scalingFactor)
The logic of this formula are as follows:
• If Volume Oscillator >= Volume Threshold and RSI <= RSI Threshold: Bullish Signal (+1 x Scaling Factor)
• If Volume Oscillator >= Volume Threshold and RSI >= (100 – RSI Threshold): Bearish Signal (-1 x Scaling Factor)
• Otherwise: Neutral (0)
The tanh function provides the normalization process. It ensures that the final signal score is bounded between -1 and 1, increases sensitivity to early changes in volume patterns based on RSI conditions, and prevent sudden jumps in signals ensuring smooth and continuous signal line.
Input Fields
The input fields allow users to customize the behavior of the indicator based on their trading strategy:
Short-Term Volume MA
- Default: `2`
- Description: The period for the short-term moving average of volume.
- Purpose: Captures short-term volume trends.
Long-Term Volume MA)
- Default: `10`
- Description: The period for the long-term moving average of volume.
- Purpose: Captures long-term volume trends for comparison with the short-term trend.
RSI Period)
- Default: `3`
- Description: The period for calculating the RSI.
- Purpose: Measures the relative strength of price movements over the specified period.
Volume Oscillator Threshold
- Default: `70`
- Description: The threshold for the Volume Oscillator to determine significant volume momentum.
- Purpose: Filters out weak volume signals.
RSI Threshold
- Default: `25`
- Description: The RSI level used to identify overbought or oversold conditions.
- Purpose: Helps detect potential reversals in price momentum.
Signal Scaling Factor
- Default: `10`
- Description: A multiplier for the signal score.
- Purpose: Adjusts the magnitude of the signal score for better visualization.
How To Use It for Trading:
Upcoming Bullish Signal: Signal line turns from Gray to Green or from Green to Gray
Upcoming Bearish Signal: Signal line turns from Gray to Red or from Red to Gray
Note: The price that corresponds to the transition of Signal line from Gray to Green or Red and vise versa is the signal price for upcoming bullish or bearish signal.
The signal score dynamically adjusts based on volume and RSI thresholds, making it adaptable to various market conditions, and this is what makes the indicator unique from other traditional indicators.
Unique Features
Unlike traditional indicators, this indicator combines two different dimensions—volume trends and RSI divergence—for more comprehensive signal generation. The use of tanh() to scale and smooth the signal is a mathematically elegant way to manage signal noise and highlight genuine trends. Traders can tune the scaling factor and thresholds to adapt the indicator for scalping, swing trading, or longer-term investing.
Custom Daily % Levels Table📘 Indicator Description
"Custom Daily % Levels – table" is a dynamic and customizable tool designed to help traders visualize daily percentage-based price ranges and key metrics in a compact, table-style format.
🧩 Key Features:
📐 Custom Percent Levels: Automatically calculates upper and lower price levels based on a user-defined base percentage and number of levels, relative to the previous daily close.
🟢🔴 Color Gradient Highlighting: Positive levels are shown with a green gradient, negative levels with red, and the level labels with a neutral tone for easy reference.
📊 Live Asset Info: Displays the current symbol, percentage change from the previous daily close, and 14-period RSI, all color-coded for quick interpretation.
⚙️ Header Control: Toggle the visibility of the main info headers and level headers independently.
📌 Position Customization: Choose where the table appears on your chart (top/bottom, left/right, center).
📈 Clean Layout: Makes it easy to visually track price movement relative to daily expected ranges.
This indicator is especially useful for intraday traders, scalpers, or anyone needing a clear visual of short-term price expansion and contraction based on predefined volatility zones.

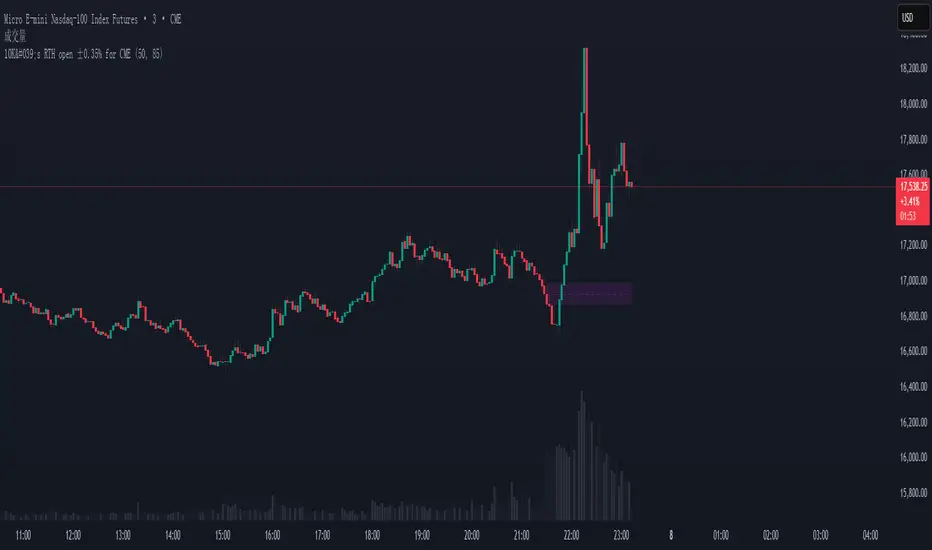
10K's RTH open ±0.35% for CMEInstant Visualization of ±0.35% from RTH Open — Spot Intraday Reversals at a Glance!
This is a visual tool designed for the U.S. regular trading hours (RTH), which instantly highlights the ±0.35% range from the RTH opening price of futures at the start of the session.
The range is displayed as a light purple box, accompanied by a dashed line marking the exact opening price, helping traders quickly assess how price reacts around this key level.
With adjustable transparency settings, this tool is ideal for intraday analysis of price positioning and directional strength — a valuable aid for short-term trading strategies.
Transient Impact Model [ScorsoneEnterprises]This indicator is an implementation of the Transient Impact Model. This tool is designed to show the strength the current trades have on where price goes before they decay.
Here are links to more sophisticated research articles about Transient Impact Models than this post arxiv.org and arxiv.org
The way this tool is supposed to work in a simple way, is when impact is high price is sensitive to past volume, past trades being placed. When impact is low, it moves in a way that is more independent from past volume. In a more sophisticated system, perhaps transient impact should be calculated for each trade that is placed, not just the total volume of a past bar. I didn't do it to ensure parameters exist and aren’t na, as well as to have more iterations for optimization. Note that the value will change as volume does, as soon as a new candle occurs with no volume, the values could be dramatically different.
How it works
There are a few components to this script, so we’ll go into the equation and then the other functions used in this script.
// Transient Impact Model
transient_impact(params, price_change, lkb) =>
alpha = array.get(params, 0)
beta = array.get(params, 1)
lambda_ = array.get(params, 2)
instantaneous = alpha * volume
transient = 0.0
for t = 1 to lkb - 1
if na(volume )
break
transient := transient + beta * volume * math.exp(-lambda_ * t)
predicted_change = instantaneous + transient
math.pow(price_change - predicted_change, 2)
The parameters alpha, beta, and lambda all represent a different real thing.
Alpha (α):
Represents the instantaneous impact coefficient. It quantifies the immediate effect of the current volume on the price change. In the equation, instantaneous = alpha * volume , alpha scales the current bar's volume (volume ) to determine how much of the price change is due to immediate market impact. A larger alpha suggests that current volume has a stronger instantaneous influence on price.
Beta (β):
Represents the transient impact coefficient.It measures the lingering effect of past volumes on the current price change. In the loop calculating transient, beta * volume * math.exp(-lambda_ * t) shows that beta scales the volume from previous bars (volume ), contributing to a decaying effect over time. A higher beta indicates a stronger influence from past volumes, though this effect diminishes with time due to the exponential decay factor.
Lambda (λ):
Represents the decay rate of the transient impact.It controls how quickly the influence of past volumes fades over time in the transient component. In the term math.exp(-lambda_ * t), lambda determines the rate of exponential decay, where t is the time lag (in bars). A larger lambda means the impact of past volumes decays faster, while a smaller lambda implies a longer-lasting effect.
So in full.
The instantaneous term, alpha * volume , captures the immediate price impact from the current volume.
The transient term, sum of beta * volume * math.exp(-lambda_ * t) over the lookback period, models the cumulative, decaying effect of past volumes.
The total predicted_change combines these two components and is compared to the actual price change to compute an error term, math.pow(price_change - predicted_change, 2), which the script minimizes to optimize alpha, beta, and lambda.
Other parts of the script.
Objective function:
This is a wrapper function with a function to minimize so we get the best alpha, beta, and lambda values. In this case it is the Transient Impact Function, not something like a log-likelihood function, helps with efficiency for a high iteration count.
Finite Difference Gradient:
This function calculates the gradient of the objective function we spoke about. The gradient is like a directional derivative. Which is like the direction of the rate of change. Which is like the direction of the slope of a hill, we can go up or down a hill. It nudges around the parameter, and calculates the derivative of the parameter. The array of these nudged around parameters is what is returned after they are optimized.
Minimize:
This is the function that actually has the loop and calls the Finite Difference Gradient each time. Here is where the minimizing happens, how we go down the hill. If we are below a tolerance, we are at the bottom of the hill.
Applied
After an initial guess, we optimize the parameters and get the transient impact value. This number is huge, so we apply a log to it to make it more readable. From here we need some way to tell if the value is low or high. We shouldn’t use standard deviation because returns are not normally distributed, an IQR is similar and better for non normal data. We store past transient impact values in an array, so that way we can see the 25th and 90th percentiles of the data as a rolling value. If the current transient impact is above the 90th percentile, it is notably high. If below the 25th percentile, notably low. All of these values are plotted so we can use it as a tool.
Tool examples:
The idea around it is that when impact is low, there is room for big money to get size quickly and move prices around.
Here we see the price reacting in the IQR Bands. We see multiple examples where the value above the 90th percentile, the red line, corresponds to continuations in the trend, and below the 25th percentile, the purple line, corresponds to reversals. There is no guarantee these tools will be perfect, that is outlined in these situations, however there is clearly a correlation in this tool and trend.
This tool works on any timeframe, daily as we saw before, or lower like a two minute. The bands don’t represent a direction, like bullish or bearish, we need to determine that by interpreting price action. We see at open and at close there are the highest values for the transient impact. This is to be expected as these are the times with the highest volume of the trading day.
This works on futures as well as equities with the same context. Volume can be attributed to volatility as well. In volatile situations, more volatility comes in, and we can perceive it through the transient impact value.
Inputs
Users can enter the lookback value.
No tool is perfect, the transient impact value is also not perfect and should not be followed blindly. It is good to use any tool along with discretion and price action.

Daily OHLC from 8:00 UTCDisplays Daily Open, High, and Low price levels, resetting at 8:00 AM UTC each day. Ideal for intraday trading reference points.
Deadzone Pro @DaviddTechDeadzone Pro by @DaviddTech – Adaptive Multi-Strategy NNFX Trading System
Deadzone Pro by @DaviddTech is a meticulously engineered trading indicator that strictly adheres to the No-Nonsense Forex (NNFX) methodology. It integrates adaptive trend detection, dual confirmation indicators, advanced volatility filtering, and dynamic risk management into one powerful, visually intuitive system. Ideal for traders seeking precision and clarity, this indicator consistently delivers high-probability trade setups across all market conditions.
🔥 Key Features:
The Setup:
Adaptive Hull Moving Average Baseline: Clearly identifies trend direction using an advanced, gradient-colored Hull MA that intensifies based on trend strength, providing immediate visual clarity.
Dual Confirmation Indicators: Combines Waddah Attar Explosion (momentum detector) and Bull/Bear Power (strength gauge) for robust validation, significantly reducing false entries.
Volatility Filter (ADX): Ensures entries are only made during strong trending markets, filtering out weak, range-bound scenarios for enhanced trade accuracy.
Dynamic Trailing Stop Loss: Implements a SuperTrend-based trailing stop using adaptive ATR calculations, managing risk effectively while optimizing exits.
Dashboard:
💎 Gradient Visualization & User Interface:
Dynamic gradient colors enhance readability, clearly indicating bullish/bearish strength.
Comprehensive dashboard summarizes component statuses, real-time market sentiment, and entry conditions at a glance.
Distinct and clear buy/sell entry and exit signals, with adaptive stop-loss levels visually plotted.
Candlestick coloring based on momentum signals (Waddah Attar) for intuitive market reading.
📈 How to Interpret Signals:
Bullish Signal: Enter when Hull MA baseline trends upward, both confirmation indicators align bullish, ADX indicates strong trend (>25), and price breaks above the previous trailing stop.
Bearish Signal: Enter short or exit long when Hull MA baseline trends downward, confirmations indicate bearish momentum, ADX confirms trend strength, and price breaks below previous trailing stop.
📊 Recommended Usage:
Timeframes: Ideal on 1H, 4H, and Daily charts for swing trading; effective on shorter (5M, 15M) charts for day trading.
Markets: Compatible with Forex, Crypto, Indices, Stocks, and Commodities.
The Entry & Exit:
🎯 Trading Styles:
Choose from three distinct trading modes:
Conservative: Requires full alignment of all indicators for maximum accuracy.
Balanced (Default): Optimized balance between signal frequency and reliability.
Aggressive: Fewer confirmations needed for more frequent trading signals.
📝 Credits & Originality:
Deadzone Pro incorporates advanced concepts inspired by:
Hull Moving Average by @Julien_Eche
Waddah Attar Explosion by @LazyBear
Bull Bear Power by @Pinecoders
ADX methodology by @BeikabuOyaji
This system has been significantly refactored and enhanced by @DaviddTech to maximize synergy, clarity, and usability, standing apart distinctly from its original components.
Deadzone Pro exemplifies precision and discipline, aligning fully with NNFX principles to provide traders with a comprehensive yet intuitive trading advantage.

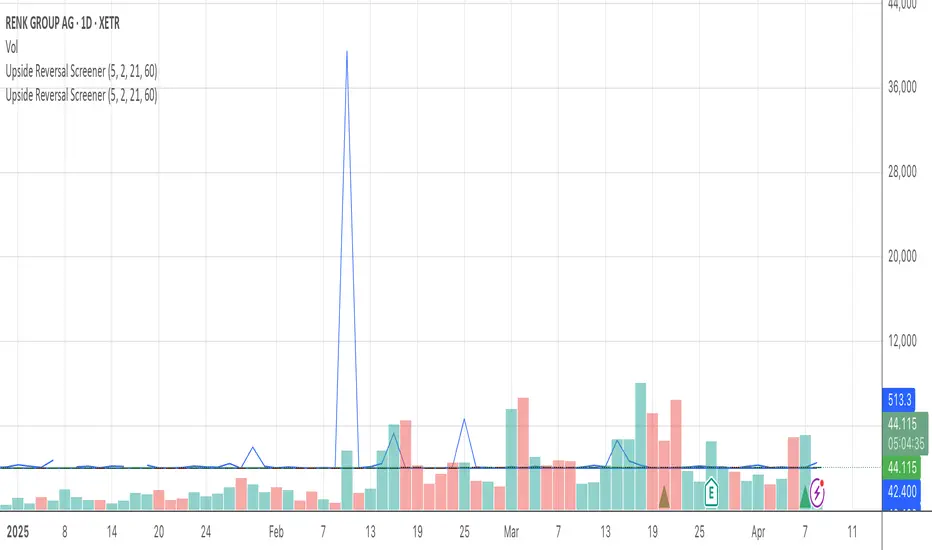
Upside Reversal ScreenerIndicator mainly intended to be used in Pinescript screener to find Upside Reversals - where an instruments drops in price then reverses.
The minimum drop (as % or % of instrument ATR) and minimum recovery (as fraction of drop) can be specified.
When used as an indicator (Set the "Running in Screener" input to False in the settings) an up arrow will show under the days where an upside reversal occurred.
To use in a screener, set it as a favourite indicator, so it will be showin in the PineScript screener.
The indicator publishes the Open, High, Low, Close (or last) prices, % price change, % of drop (from high), the recovery (as % of drop), and if the stock matched the reverse settings.
Market Phases (ZigZag + MA + RSI)This script is a TradingView Pine Script that visualizes market phases using the ZigZag pattern, Moving Averages (MA), and the Relative Strength Index (RSI). It allows traders to identify key market conditions, such as accumulating, distributing, bullish, and bearish phases based on price movements and momentum indicators.
#### Components
1. ZigZag Settings:
- Depth: Controls the sensitivity of the ZigZag indicator. A higher value results in fewer price points being considered as reversals.
- Deviation: Defines the minimum percentage change needed to identify a ZigZag point, preventing small fluctuations from being registered.
- Backstep: Specifies the number of bars to look back for identifying highs and lows.
2. Moving Average Settings:
- MA Length: The number of periods used to calculate the moving average.
- MA Type: The type of moving average to use, either Simple Moving Average (SMA) or Exponential Moving Average (EMA).
3. RSI Settings:
- RSI Length: The period for calculating the RSI.
- Overbought Level: The threshold above which the asset is considered overbought.
- Oversold Level: The threshold below which the asset is considered oversold.
4. Calculations:
- Moving Average and RSI Calculation: The script calculates either an SMA or EMA and the RSI based on user-defined settings.
5. ZigZag Enhanced Calculation:
- It identifies swing highs and lows to determine the ZigZag points for improved trend analysis.
6. Trend Direction:
- The script checks the direction of the trend based on the latest ZigZag points.
7. Market Phase Determination:
- The script defines the market phase (Accumulation, Distribution, Bullish, Bearish) based on the trend direction and levels from the RSI and relationship with the moving average.
8. Background Colors:
- The background is tinted according to the identified market phase for visual clarity.
9. Labels and Plotting:
- Labels are generated at the last bar with the current phase and RSI value.
- The moving average and last ZigZag points are plotted on the chart for further reference.
### Conclusion
This script provides a comprehensive view of market conditions by integrating multiple indicators, helping traders make informed trading decisions based on market dynamics. The ability to visualize phases and key indicators aids in recognizing potential entry and exit points in trading strategies.
If you have any questions or need further modifications, feel free to ask!

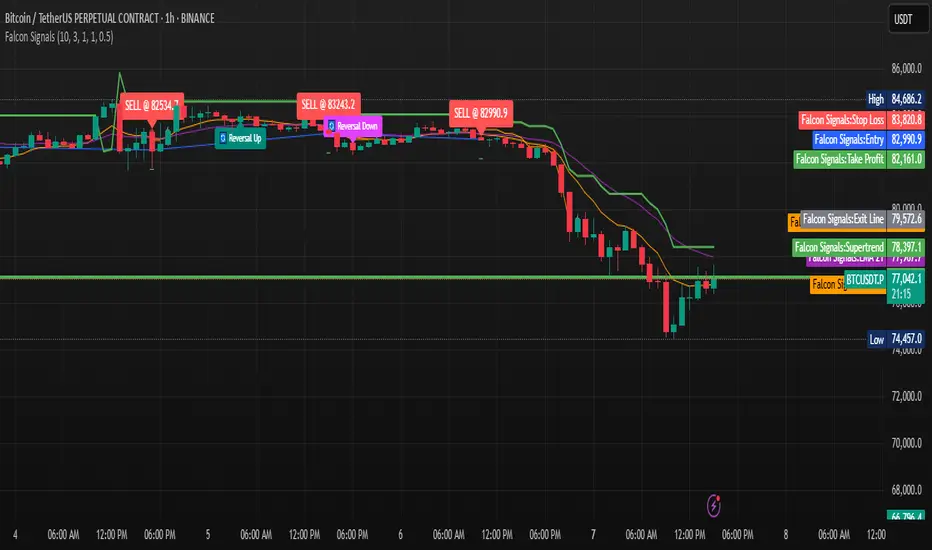
Falcon SignalsThis script is a TradingView Pine Script for a trading strategy called "Falcon Signals." It combines multiple technical indicators and strategies to generate buy and sell signals. Here’s a breakdown of what the script does:
1. Supertrend Indicator:
The script calculates the Supertrend indicator using the Average True Range (ATR) and a specified multiplier (factor). The Supertrend is used to define the trend direction, with a green line for an uptrend and a red line for a downtrend.
2. EMA (Exponential Moving Average):
Two EMAs are used: a fast EMA (9-period) and a slow EMA (21-period). The script checks for crossovers of the fast EMA above or below the slow EMA as a basis for buying and selling signals.
3. RSI (Relative Strength Index):
The RSI (14-period) is used to measure the momentum of the price. A buy signal is generated when the RSI is less than 70, while a sell signal is generated when it’s greater than 30.
4. Take Profit (TP) and Stop Loss (SL):
The script allows users to set custom percentages for take profit and stop loss. The take profit is set at a certain percentage above the entry price for buy signals, and the stop loss is set at a percentage below the entry price, and vice versa for sell signals.
5. Trailing Stop:
A trailing stop can be enabled, which dynamically adjusts the stop loss level as the price moves in the favorable direction. If the price moves against the position by a certain trailing percentage, the position will be closed.
6. Engulfing Patterns:
The script checks for bullish and bearish engulfing candlestick patterns, indicating potential reversals. A bullish engulfing pattern is marked with a teal label ("🔄 Reversal Up"), and a bearish engulfing pattern is marked with a fuchsia label ("🔄 Reversal Down").
7. Plotting:
The script plots various indicators and signals:
Entry line: Shows where the buy or sell signal is triggered.
Take profit and stop loss levels are plotted as lines.
EMA and Supertrend lines are plotted on the chart.
Trailing stop line, if enabled, is also plotted.
8. Buy and Sell Labels:
The script places labels on the chart when buy or sell signals are triggered, indicating the price at which the order should be placed.
9. Exit Line:
The script plots an exit line when the trailing stop is hit, signaling when a position should be closed.
10. Alerts:
Alerts are set for both buy and sell signals, notifying the trader when to act based on the strategy's conditions.
This strategy combines trend-following (Supertrend), momentum (RSI), and price action patterns (EMA crossovers and engulfing candlestick patterns) to generate trade signals. It also offers the flexibility of take profit, stop loss, and trailing stop features.
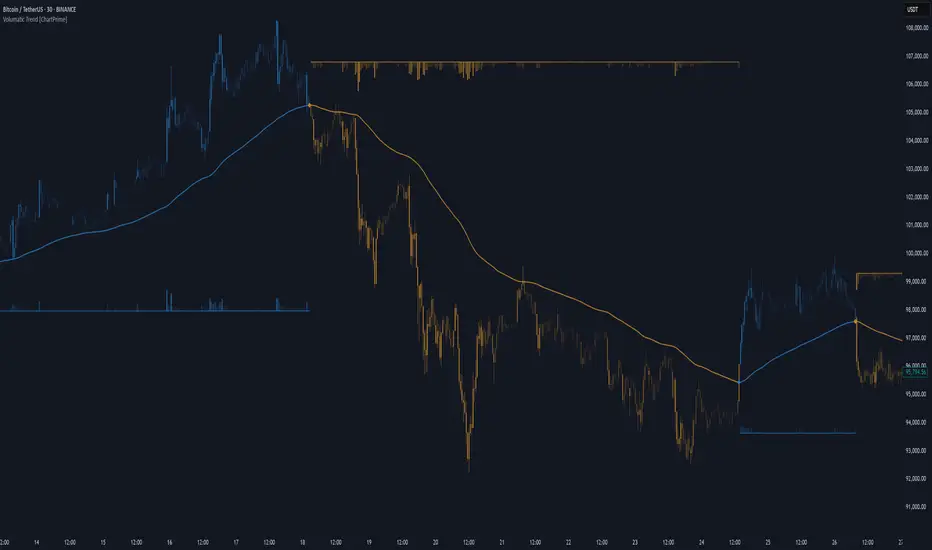
Volumatic Trend [ChartPrime]
A unique trend-following indicator that blends trend logic with volume visualization, offering a dynamic view of market momentum and activity. It automatically detects trend shifts and paints volume histograms at key levels, allowing traders to easily spot strength or weakness within trends.
⯁ KEY FEATURES
Trend Detection System:
Uses a custom combination of weighted EMA (swma) and regular EMA to detect trend direction.
A diamond appears on trend shift, indicating the starting point of a new bullish or bearish phase.
Volume Histogram Zones:
At each new trend, the indicator draws two horizontal zones (top and bottom) and visualizes volume activity within that trend using dynamic histogram candles.
Gradient-Based Candle Coloring:
Candle color is blended with a gradient based on volume intensity. This helps highlight where volume spikes occurred, making it easy to identify pressure points.
Volume Summary Labels:
A label at the end of each trend zone displays two critical values:
- Delta: net volume difference between bullish and bearish bars.
- Total: overall volume accumulated during the trend.
⯁ HOW TO USE
Monitor diamond markers to identify when a new trend begins.
Use volume histogram spikes to assess if the trend is supported by strong volume or lacking participation.
A high delta with strong total volume in a trend indicates institutional support.
Compare gradient strength of candles—brighter areas represent higher-volume trading activity.
Can be used alone or combined with other confirmation tools like structure breaks, liquidity sweeps, or order blocks.
⯁ CONCLUSION
Volumatic Trend gives you more than just trend direction—it provides insight into the force behind it. With volume-graded candles and real-time histogram overlays, traders can instantly assess whether a trend is backed by conviction or fading strength. A perfect tool for swing traders and intraday strategists looking to add volume context to their directional setups.
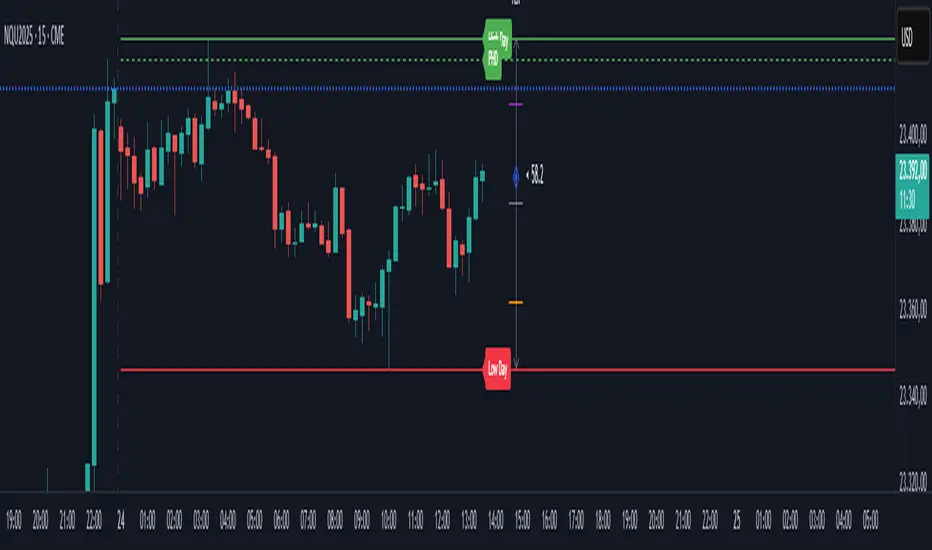
High and Low DayHigh and Low Day
This indicator automatically tracks and displays the daily high and low of the current trading session directly on your chart.
Each new day, it resets the levels and plots horizontal lines:
Green Line for the daily high
Red Line for the daily low
It also adds labels (“High Day” and “Low Day”) for easy visual reference.
The levels update in real time as new highs or lows are formed throughout the day.
You can toggle the visibility of these lines and labels using the "Mostrar Linhas do Dia Atual" (Show Current Day Lines) setting.
Perfect for intraday traders looking to keep track of key support and resistance levels during the trading day.