datastructuresLibrary "datastructures"
Collection of complex data structures not generally present as part of pinescript and can be used for collection and transformation of the data
method init(this)
initialise StringSet
Namespace types: StringSet
Parameters:
this (StringSet) : StringSet to be initialised
Returns: current object of StringSet
method add(this, value)
add value to StringSet
Namespace types: StringSet
Parameters:
this (StringSet) : StringSet object
@value the key of stringset to be set
value (string)
Returns: current object of StringSet
method clear(this)
clear StringSet contents
Namespace types: StringSet
Parameters:
this (StringSet) : StringSet object
Returns: current object of StringSet
method remove(this, value)
remove value from StringSet
Namespace types: StringSet
Parameters:
this (StringSet) : StringSet object
@value the key of stringset to be removed
value (string)
Returns: current object of StringSet
method size(this)
get size of the StringSet
Namespace types: StringSet
Parameters:
this (StringSet) : StringSet object
Returns: size of StringSet map
method isEmpty(this)
check if stringset is empty
Namespace types: StringSet
Parameters:
this (StringSet) : StringSet object
Returns: true if empty else returns false
method iterator(this)
get values of the StringSet
Namespace types: StringSet
Parameters:
this (StringSet) : StringSet object
Returns: values of StringSet
method contains(this, value)
check if value is present in StringSet
Namespace types: StringSet
Parameters:
this (StringSet) : StringSet object
value (string)
Returns: true if Value is present. False otherwise
method initialiseCountMap(types, numberOfStates)
Initialise a new map of string to Count
Namespace types: array
Parameters:
types (array) : array of string containing map keys
numberOfStates (int) : number of items to be tracked for each type
Returns: new map() with empty initialisation
method initialiseCountMap(types, numberOfStates)
Initialise a new map of string to Count
Namespace types: map
Parameters:
types (map) : map containing types and configurable boolean flag
numberOfStates (int) : number of items to be tracked for each type
Returns: new map() with empty initialisation
method get(this, key, n)
get count based on primary string key and secondary int key
Namespace types: map
Parameters:
this (map) : map of string to to Count
key (string) : primary key
n (int) : secondary key
Returns: derived count from map of map
method get(this, key, n)
get array of int associated with key and n
Namespace types: map
Parameters:
this (map) : map of string to to MapToInts
key (string) : primary string key
n (int) : secondary int key
Returns: derived array of int for the given key combination
method get(this, key, n)
get array of float associated with key and n
Namespace types: map
Parameters:
this (map) : map of string to to MapToFloats
key (string) : primary string key
n (int) : secondary int key
Returns: derived array of float
method get(this, key)
get values of Ints based on key
Namespace types: map
Parameters:
this (map) : map of string to Ints
key (string) : string key
Returns: values inside Ints object associated in the map
method set(this, key, n, value)
set count for specific primary and secondary key
Namespace types: map
Parameters:
this (map) : map of string to to Count
key (string) : primary string key
n (int) : secondary int key
value (int) : the new count value to be set
Returns: updated value for key and n
method increment(this, key, n)
increment count for specific primary and secondary key
Namespace types: map
Parameters:
this (map) : map of string to to Count
key (string) : primary string key
n (int) : secondary int key
Returns: incremented value
method increment(this, key, n)
intcrement the value of Ints based on key and n (secondary key)
Namespace types: map
Parameters:
this (map) : map of string to Ints
key (string) : string key
n (int) : secondary int key
Returns: incremented nth object of Ints associated with key
method initialiseIntsMap(types, numberOfStates)
Initialise a new map of string to Map to Ints
Namespace types: array
Parameters:
types (array) : array of string containing map keys
numberOfStates (int) : number of items to be tracked for each type
Returns: new map() with empty initialisation
method initialiseIntsMap(types, numberOfStates)
Initialise a new map of string to Map to Ints
Namespace types: map
Parameters:
types (map) : map with boolean flag
numberOfStates (int) : number of items to be tracked for each type
Returns: new map() with empty initialisation
method initialiseFloatsMap(types, numberOfStates)
Initialise a new map of string to Map to Floats
Namespace types: array
Parameters:
types (array) : array of string containing map keys
numberOfStates (int) : number of items to be tracked for each type
Returns: new map() with empty initialisation
method initialiseFloatsMap(types, numberOfStates)
Initialise a new map of string to Map to Floats
Namespace types: map
Parameters:
types (map) : map with boolean flag
numberOfStates (int) : number of items to be tracked for each type
Returns: new map() with empty initialisation
method initialiseMapOfInts(types, numberOfStates)
Initialise map of two dimentional Ints based on types and number of states
Namespace types: array
Parameters:
types (array) : types array for which a new Map to Ints to be created
numberOfStates (int) : number of states for which the Ints needs to be initialised
Returns: new map of string to two dimension array of int (Ints)
method initialiseMapOfInts(types, numberOfStates)
Initialise map of two dimentional Ints based on types and number of states
Namespace types: map
Parameters:
types (map) : types map for which a new Map to Ints to be created along with bool flag
numberOfStates (int) : number of states for which the Ints needs to be initialised
Returns: new map of string to two dimension array of int (Ints)
StringSet
Set implementation using map
Fields:
strSet (map) : map of string to bool
Count
type containing map of int to int
Fields:
count (map) : map of int to int used for counting
Ints
custom type to enable array of array of int
Fields:
values (array) : int array
Floats
custom type to enable array of array of float
Fields:
values (array) : float array
MapToInts
type containing map of int to int array
Fields:
vmap (map) : map of int to Ints used as counting collection
MapToFloats
type containing map of int to float array
Fields:
vmap (map) : map of int to Floats used as floating stat collection
Индикаторы и стратегии
MACD Crossover + AlertMACD Proximity & Crossover Alert Script
This script is designed to help traders stay ahead of MACD crossovers by providing:
Early alerts when the MACD and Signal lines are getting close (within a customizable threshold)
Instant alerts when a bullish or bearish crossover occurs
Whether you're swing trading or scalping, this tool gives you advanced notice to prepare — and a confirmation signal to act on. It works on any timeframe and helps avoid late entries by alerting you when momentum is shifting.
Features:
Customizable MACD settings (fast, slow, signal length)
Adjustable "proximity" threshold
Visual background highlight when lines are close
Built-in alert conditions for:
MACD crossing above Signal (bullish)
MACD crossing below Signal (bearish)
MACD and Signal getting close (early warning)
Perfect for traders who want a heads-up before momentum shifts — not just a reaction afterward.

EMA Crossover Signal (15min)📈 EMA Crossover Signal (15min)
This indicator generates Buy and Sell signals based on a simple yet effective Exponential Moving Average (EMA) crossover strategy, strictly evaluated on the 15-minute timeframe.
✅ Strategy:
Buy Signal: Triggered when the 5 EMA crosses above the 10 EMA.
Sell Signal: Triggered when the 5 EMA crosses below the 10 EMA.
📌 Features:
Signals are evaluated using 15-minute data, regardless of your current chart timeframe.
Clear Buy/Sell labels are displayed directly on the chart.
Optional plotting of the 5 EMA and 10 EMA from the 15-minute chart for visual confirmation.
This tool is ideal for traders who want to follow short-term momentum shifts with high clarity and precision.

Buy/Sell Volume ComparisonKey improvements:
Direct volume comparison: Now shows the current day's volume and previous day's volume side by side
Percentage change display: Clear percentage change with up/down arrows
Table position customization: Added a dropdown menu to select where you want the table to appear
To adjust the table position:
Click on the settings (gear icon) for the indicator after adding it to your chart
You'll see a dropdown menu labeled "Table Position"
Select from options like "Top Right", "Bottom Left", etc.
Click "OK" to apply your changes
This version also handles the case where there's no previous volume data (first bar of the chart) by checking for NA values.
Let me know if this meets your requirements, or if you'd like any other adjustments!RetryClaude does not have the ability to run the code it generates yet.Claude can make mistakes. Please double-check responses.Tip: Long chats cause you to reach your usage limits faster.

drawingutilsLibrary "drawingutils"
methods used in my scripts for some basic and customized drawings and arrays.
method line(this, p1, p2, lineColor, style, width, xloc, extend)
Draws line and adds to the array
Namespace types: array
Parameters:
this (array) : array to which the created line needs to be added
p1 (chart.point) : point1 of the line
p2 (chart.point) : point2 of the line
lineColor (color) : line color
style (string) : line style
width (int) : line width
xloc (string) : xloc.bar_index or xloc.bar_time
extend (string) : default is extend.none
Returns: line created
method label(this, p, txt, tooltip, xloc, yloc, color, style, textcolor, size, textalign)
Draws label and adds to the array
Namespace types: array
Parameters:
this (array) : array to which the created label needs to be added
p (chart.point) : point at which the label needs to be drawn
txt (string) : label text
tooltip (string) : tooltip text
xloc (string) : xloc value - xloc.bar_index or xloc.bar_time
yloc (string) : y location of the label
color (color) : label color
style (string) : label style
textcolor (color) : label text color
size (string) : Size of the label
textalign (string) : text alignment
Returns: label created
method linefill(this, ln1, ln2, fillColor, transparency)
Draws linefill and adds to array
Namespace types: array
Parameters:
this (array) : array to which the created linefill needs to be added
ln1 (line) : line1 of the fill
ln2 (line) : line2 of the fill
fillColor (color) : fill Color
transparency (int) : fill transparency
Returns: linefill created
draw_labelled_line(target, lblText, linecolor, labelcolor, index, highlight, linesArray, labelsArray, highlightSize, tinySize, yloc, textalign)
Draws labelled line
Parameters:
target (float) : target price
lblText (string) : label text
linecolor (color) : line color
labelcolor (color) : label color
index (int) : index to calculate the distance offset
highlight (bool) : highlight true/false
linesArray (array) : array of lines where the created line is added
labelsArray (array) : array of labels where the created label is added
highlightSize (string) : Size of highlighted text
tinySize (string) : size of non highlighted text
yloc (string) : y location
textalign (string) : text alignment
Returns: void
draw_labelled_box(y1, y2, labelColor, labelText, index, boxArray, labelArray, borderColor, borderStyle, borderWidth, textAlign, highlight, highLightLabel)
Draws custom labelled box
Parameters:
y1 (float) : price 1 of the box
y2 (float) : price 2 of the box
labelColor (color) : label color
labelText (string) : label text
index (int) : index to calculate the offset distance
boxArray (array) : box array to which the box needs to be added
labelArray (array) : label array to which the label needs to be added
borderColor (color) : border color
borderStyle (string) : border style
borderWidth (int) : border width
textAlign (string) : text align of the label
highlight (bool) : highlight label text
highLightLabel (bool) : highlight label size
Returns: void
Futures Position Size CalculatorFutures Position Size Calculator by vmkhats
Streamline your futures trading risk management with this intuitive Pine Script utility designed for TradingView. Created by vmkhats, this tool automates position sizing calculations for popular futures contracts, ensuring precise risk control while eliminating manual errors.
Key Features:
Supports 15+ Instruments: Trade confidently with preconfigured settings for indices (ES, NQ, RTY), commodities (CL, GC), currencies (6E), and micro contracts (MES, MNQ, MCL).
Customizable Inputs: Set your risk amount (e.g., $1,000) and stop-loss size in points, tailored to your strategy.
Automatic Calculations: The script computes stop-loss size in ticks, risk per contract, and optimal position size using floor rounding to prevent over-leveraging.
Clear Visual Output: A table displays results (instrument, risk, stop size, contracts) with color-coded alerts for invalid configurations (e.g., zero position size).
Ideal for both novice and seasoned traders, this utility enforces disciplined risk management while saving time. Enhance your TradingView workspace with this essential tool and trade futures with confidence.
Created by vmkhats — ensuring traders stay precise, proactive, and risk-aware.

SMT Divergence ICT 02 [TradingFinder] Smart Money Technique SMC🔵 Introduction
SMT Divergence (Smart Money Technique Divergence) is a price action-based trading concept that detects discrepancies in market behavior between two assets that are generally expected to move in the same direction. Rooted in ICT (Inner Circle Trader) methodology, this approach helps traders recognize subtle signs of market manipulation or imbalance, often ahead of traditional indicators.
The core idea behind SMT divergence is simple: when two correlated instruments—such as currency pairs, indices, or assets from the same sector—start forming different swing points (highs or lows), this can reveal a lack of confirmation in the trend. Such divergence is often a precursor to a price reversal or pause in momentum.
This technique works effectively across various markets including Forex, stocks, and cryptocurrencies. It’s particularly valuable when used alongside concepts like liquidity sweeps, market structure breaks (MSBs), or order block identification.
In advanced use cases, Sequential SMT helps uncover patterns of alternating divergences across sessions, often signaling engineered liquidity traps before price reacts.
When combined with the Quarterly Theory—which segments market behavior into Accumulation, Manipulation, Distribution, and Continuation/Reversal phases—traders gain insight not only into where divergence happens, but when it's most likely to be significant within the market cycle.
Bullish SMT :
Bullish SMT Divergence occurs when one asset prints a higher low while the correlated asset forms a lower low. This asymmetry often suggests that the downside move is losing strength, hinting at a potential bullish shift.
Bearish SMT :
Bearish SMT Divergence is formed when one asset creates a higher high, while the second asset fails to confirm by printing a lower high. This typically signals weakening bullish pressure and the possibility of a reversal to the downside.
🔵 How to Use
The SMT Divergence indicator is designed to detect imbalances between two positively correlated assets—such as major currency pairs, indices, or commodities. These divergences often indicate early signs of market inefficiency or smart money manipulation and can help traders anticipate trend shifts with higher precision.
Unlike traditional divergence indicators or earlier versions of this script, this upgraded version does not rely solely on consecutive pivot comparisons. Instead, it dynamically scans all available pivots within the chart to identify divergences at any structural level—major or minor—across the price action. This broader detection method increases the reliability and frequency of meaningful SMT signals.
Moreover, when integrated with Sequential SMT logic, the indicator is capable of identifying multiple divergence sequences across sessions. These sequences often signal engineered liquidity traps and can be mapped within the Quarterly Theory framework, allowing traders to pinpoint not just the presence of divergence but also the phase of the market cycle it appears in (Accumulation, Manipulation, Distribution, or Continuation).
🟣 Bullish SMT Divergence
This signal occurs when the primary asset forms a higher low, while the correlated asset forms a lower low. This pattern implies weakening bearish momentum and a potential shift to the upside.
If the correlated asset breaks its previous low but the primary asset does not, this divergence suggests absorption of selling pressure and possible accumulation by smart money—making it a strong bullish signal, especially when aligned with a favorable market phase (e.g., the end of a manipulation phase in Q2).
🟣 Bearish SMT Divergence
This signal occurs when the primary asset creates a higher high, while the correlated asset forms a lower high. This mismatch indicates fading bullish momentum and a potential reversal to the downside.
If the correlated asset fails to confirm a breakout made by the main asset, the divergence may point to distribution or exhaustion. When seen within Q3 or Q4 phases of the Quarterly Theory, this pattern often precedes sharp declines or fake-outs engineered by smart money
🔵 Settings
⚙️ Logical Settings
Symbol : Choose the secondary asset to compare with the main chart asset (e.g., XAUUSD, US100, GBPUSD).
Pivot Period : Sets the sensitivity of the pivot detection algorithm. A smaller value increases responsiveness to price swings.
Activate Max Pivot Back : When enabled, limits the maximum number of past pivots to be considered for divergence detection.
Max Pivot Back Length : Defines how many past pivots can be used (if the above toggle is active).
Pivot Sync Threshold : The maximum allowed difference (in bars) between pivots of the two assets for them to be compared.
Validity Pivot Length : Defines the time window (in bars) during which a divergence remains valid before it's considered outdated.
🎨 Display Settings
Show Bullish SMT Line : Draws a line connecting the bullish divergence points.
Show Bullish SMT Label : Displays a label on the chart when a bullish divergence is detected.
Bullish Color : Sets the color for bullish SMT markers (label, shape, and line).
Show Bearish SMT Line : Draws a line for bearish divergence.
Show Bearish SMT Label : Displays a label when a bearish SMT divergence is found.
Bearish Color : Sets the color for bearish SMT visual elements.
🔔 Alert Settings
Alert Name : Custom name for the alert messages (used in TradingView’s alert system).
Message Frequency :
All : Every signal triggers an alert.
Once Per Bar : Alerts once per bar regardless of how many signals occur.
Per Bar Close : Only triggers when the bar closes and the signal still exists.
Time Zone Display : Choose the time zone in which alert timestamps are displayed (e.g., UTC).
Bullish SMT Divergence Alert : Enable/disable alerts specifically for bullish signals.
Bearish SMT Divergence Alert : Enable/disable alerts specifically for bearish signals
🔵Conclusion
The SMT Plus indicator offers a refined and powerful approach to detecting smart money behavior through divergence analysis between correlated assets. By removing the limitations of consecutive pivot comparisons and allowing for broader structural detection, it captures more accurate and timely signals that often precede major market moves.
When paired with frameworks like Sequential SMT and the Quarterly Theory, the indicator not only highlights where divergence occurs, but also when in the market cycle it's most likely to matter. Its flexible settings, customizable visuals, and integrated alert system make it suitable for intraday scalpers, swing traders, and even long-term macro analysts.
Whether you're using it as a standalone decision-making tool or combining it with other ICT concepts, SMT Plus gives you an edge in recognizing manipulation, timing reversals, and staying in sync with the real market narrative—not just the chart.

Dynamic Volume Profile PoC SwiftedgeOverview
The Dynamic Volume Profile PoC is a powerful and visually intuitive indicator designed to help traders identify key support and resistance levels using a unique combination of pivot points, volume analysis, and dynamic Point of Control (PoC) levels. This script overlays directly on your chart, providing clear visual cues for potential breakout and rejection zones, making it easier to spot high-probability trading opportunities.
What It Does
This indicator combines three core components to deliver actionable insights:
Pivot Points: Identifies significant swing highs and lows to establish potential support and resistance levels.
Volume Oscillator: Measures volume momentum to confirm the strength of price movements, ensuring that breakouts or rejections are backed by significant volume.
Dynamic Point of Control (PoC): Calculates the midpoint between consecutive pivot points to create dynamic PoC levels, which act as key areas where price is likely to either break through (breakout) or reverse (rejection).
These components work together to highlight critical price levels where the market is likely to react, giving traders a clear framework for decision-making.
How It Works
Pivot Detection: The script uses pivot highs and lows (based on user-defined Left Bars and Right Bars) to identify significant price levels. These pivots form the foundation for calculating PoC levels.
PoC Calculation: Each time a new pivot is detected, the script calculates the midpoint between the current pivot and the previous pivot, creating a dynamic PoC level. These levels are plotted as horizontal lines on the chart, with a maximum of Max PoC Lines to Show (default: 2) visible at any time.
Volume Confirmation: A volume oscillator (short EMA of volume minus long EMA of volume) is used to filter breakouts and rejections. Breakouts or rejections are only signaled if the volume oscillator exceeds the Volume Threshold (default: 20), ensuring that price movements are supported by strong volume.
Visual Cues:
PoC levels are drawn as cyan lines with optional semi-transparent zones (controlled by Show PoC Zones). These zones are colored green for potential breakouts (price above PoC) and red for potential rejections (price below PoC).
Labels above and below each PoC level indicate trading opportunities: "Long if breakout"/"Long if rejected" (green) and "Short if breakout"/"Short if rejected" (red), depending on the price's direction relative to the PoC.
Break signals ("B") are plotted above or below bars when price crosses a pivot level with sufficient volume, colored red for downward breaks and green for upward breaks.
How to Use
Add the Indicator: Add the "Dynamic Volume Profile PoC " to your chart in TradingView.
Adjust Settings:
Left Bars and Right Bars (default: 15): Control the sensitivity of pivot detection. Lower values make the script more sensitive to smaller price swings.
Volume Threshold (default: 20): Set the minimum volume oscillator value required to confirm breakouts or rejections. Increase this for stricter confirmation.
Max PoC Lines to Show (default: 2): Define how many PoC levels are displayed at once.
Show PoC Zones (default: true): Toggle semi-transparent zones around PoC levels for better visualization.
Label Spacing Factor (default: 0.5): Adjust the vertical spacing between labels and the PoC box. Increase this value (e.g., to 1.0 or 2.0) for more spacing, or decrease it (e.g., to 0.3) for less.
Interpret the Signals:
Look for PoC levels (cyan lines) as key areas of interest.
Use the labels to identify potential trades: "Long if breakout" indicates a buy opportunity if price breaks above the PoC, while "Short if rejected" suggests a sell if price fails to break through.
Watch for "B" signals to confirm breakouts or rejections with volume support.
Combine with Your Strategy: Use the PoC levels and break signals as part of your broader trading strategy, such as trend-following or mean-reversion setups.
Why This Script is Unique
The Dynamic Volume Profile PoC stands out by combining pivot points, volume analysis, and dynamic PoC levels into a single, cohesive tool. Unlike traditional volume profile indicators that require a fixed range, this script dynamically updates PoC levels based on recent price action, making it more responsive to current market conditions. The addition of volume confirmation ensures that signals are backed by market participation, reducing false breakouts. The visually appealing design, with customizable spacing and semi-transparent zones, makes it easy to interpret key levels at a glance, even for traders unfamiliar with Pine Script.
Notes
This script works best on timeframes where pivot points are meaningful (e.g., 1H, 4H, or daily charts).
Adjust the Label Spacing Factor to ensure labels are well-spaced for your chart's zoom level and instrument.
For instruments with high volatility, you may need to increase the Volume Threshold to filter out noise.

H4 3-Candle Pattern (Persistent Signals)Below is an example in Pine Script v5 that detects a pattern using the last three completed 4H candles and then plots a permanent arrow on the fourth candle (i.e. on the current bar) when the conditions are met. The arrow stays on that bar even after new bars form.
In this version, the pattern is evaluated as follows on each bar (when there are enough candles):
Bullish Pattern:
The candle three bars ago (oldest of the three) is bullish (its close is greater than its open).
The candle two bars ago closes above the high of that older candle.
The last completed candle (one bar ago) closes at or above the low of the candle two bars ago.
Bearish Pattern:
The candle three bars ago is bearish (its close is less than its open).
The candle two bars ago closes below the low of that older candle.
The last completed candle closes at or below the high of the candle two bars ago.
When the conditions are met the script draws a green up arrow below the current (fourth) candle for a bullish pattern and a red down arrow above the current candle for a bearish pattern. These arrows are drawn as regular plot symbols and remain on the chart permanently.
Copy and paste the code into TradingView’s Pine Script Editor:

Sessions with Mausa session high/low tracker that draws flat, horizontal lines for Asia, London, and New York trading sessions. It updates those levels in real time during each session, locks them in once the session ends, and keeps them on the chart for context.
At a glance, you always know:
Where each session’s highs and lows were set
Which session produced them (ASIA, LDN, NY labels float cleanly above the highs)
When price is approaching or reacting to prior session levels
🔹 Use Cases:
• Key Levels – See where Asia, London, or NY set boundaries, and watch how price respects or rejects them
• Breakout Zones – Monitor when price breaks above/below session highs/lows
• Session Structure – Know instantly if a move happened during London or NY without squinting at the clock
• Backtesting – Keep historic session levels on the chart for reference — nothing gets deleted
• Confluence – Align these levels with support/resistance, fibs, or liquidity zones
Simple, visual, no distractions — just session structure at a glance.

Wick Sweep EntriesWick Sweep Entry designed by Finweal Finance (Indicator Originator : Prajyot Mahajan) :
This Indicator is specially designed for Nifty, Sensex and Banknifty Options Buying. This works well on Expiry Days.
Setup Timeframe : 5m and 1m.
Entry Criteria :
For Long/CE :
Wait for Sweep of 5m Candle Low with next 5m Candle but you do not wait for the next 5 minute candle to close, you enter directly whenever any 1 minute candle of next 5minute candle to close above the low of previous 5m Candle.
For Short/PE :
Wait for Sweep of 5m Candle High with next 5m Candle but you do not wait for the next 5 minute candle to close, you enter directly whenever any 1 minute candle of next 5minute candle to close below the High of previous 5m Candle.
Key notes :
1. As this is the Scalping High Frequency Strategy, it is to be used for scalping purpose only. You might have losses too so to avoid the noise in the market, i suggest you to use this strategy in the first 45 minutes to 1 hour of Indian Markets as this is a volatility Strategy.
2. Although Nifty and Banknifty are independent indices, they still show some reactions with each other, so if you spot a long entry on BNF and Short Entry on nifty then you will avoid taking the trade, you will take the trade only if there is a tandem activity or At least the other index is not showing opposite signal.
3. If target is not hit and you spot another entry, you will avoid taking the new entry.
The Indicator will automatically spot/plot the entry signal, all you need to do is enter as soon as 1minute candle closes either below prior 5 minute candle High for Short/PE or closes above 5minute low for Long/CE.
For Targets :
You Can Target recent minor pull back, FVG, or Order blocks.
Remember : This is a scalping strategy so don't hold trade for more than 4/5 1minute Candles

Simple Fundamental Analysis Fundamental Analysis
This indicator provides comprehensive fundamental analysis directly on your chart, displaying key financial metrics in a color-coded table format. It goes beyond basic metrics by calculating fair value estimates and generating buy/sell signals based on overall fundamental health.
Key features:
14 essential fundamental metrics including EPS, P/E Ratio, PEG Ratio, and valuation ratios
Fair value calculation (PE × EPS) showing potential under/overvaluation
Value gap percentage to quickly identify investment opportunities
Color-coded values (green for healthy, red for concerning)
Automatic buy/sell/neutral signals based on overall fundamental analysis
Percentage rating showing the strength of buy/sell signals
This tool helps traders and investors make informed decisions based on fundamental data rather than just technical indicators. Perfect for value investors looking to identify fundamentally sound companies trading at attractive prices.
Disclaimer
This indicator is provided for informational and educational purposes only. The buy/sell signals and fundamental analysis presented are not investment advice or recommendations to buy, sell, or hold any security.
The financial data used is sourced from TradingView's database and may not always be current or accurate. Some metrics may be unavailable for certain stocks, which could affect the overall rating. Different industries have different norms for "good" metrics - what's healthy for one sector may not be for another.
The fair value calculation uses a standard PE ratio of 15, which may not be appropriate for all companies or industries. High-growth companies typically command higher multiples, while mature companies may trade at lower multiples.
Past performance is not indicative of future results. Always conduct your own research and consider consulting a financial advisor before making investment decisions.

Next Candle PredictorNext Candle Predictor for TradingView
This Pine Script indicator helps predict potential price movements for the next candle based on historical price action patterns. It analyzes recent candles' characteristics including body size, wick length, and volume to calculate a directional bias.
Key Features
Analyzes recent price action to predict next candle direction (Bullish, Bearish, or Neutral)
Visual indicators include small directional arrows and a prediction line
Customizable sensitivity and lookback period
Works best on lower timeframes for short-term price action trading
Displays clear prediction labels that extend into future bars
How It Works
The script analyzes recent candles by examining:
Candle body size (weighted by your preference)
Wick length (weighted by your preference)
Volume activity (weighted by your preference)
These factors combine to create a directional strength indicator that determines if the next candle is likely to be bullish, bearish, or neutral.
Visual Feedback
Green up arrows indicate bullish predictions
Red down arrows indicate bearish predictions
A directional line extends from the last candle showing predicted price movement
A label displays the prediction text at the end of the line
Information table in the top right displays the current prediction
Settings
Lookback Candle Count: Number of historical candles to analyze (2-20)
Wick/Body/Volume Weight Factors: Adjust importance of each component
Prediction Sensitivity: Threshold for triggering directional bias
Prediction Line Length: How far the prediction line extends
Perfect for day traders and scalpers looking for an edge in short-term directional bias.

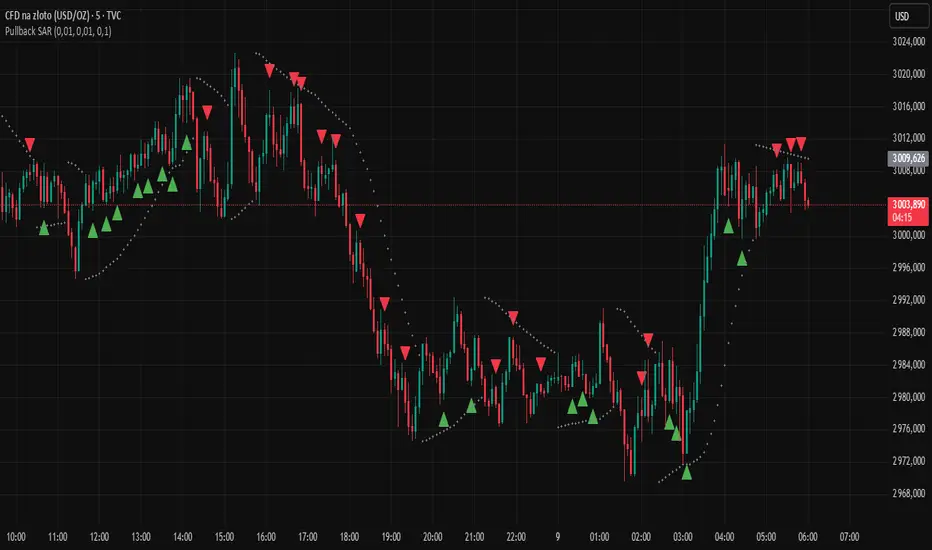
Pullback SARPullback SAR - Parabolic SAR with Pullback Detection
Description: The "Pullback SAR" is an advanced indicator built on the classic Parabolic SAR but with additional functionality for detecting pullbacks. It helps identify moments when the price pulls back from the main trend, offering potential entry signals. Perfect for traders looking to enter the market after a correction.
Key Features:
SAR (Parabolic SAR): The Parabolic SAR indicator is used to determine potential trend reversal points. It marks levels where the price could reverse its direction.
Pullback Detection: The indicator catches periods when the price moves away from the main trend and then returns, which may suggest a re-entry opportunity.
Long and Short Signals: Once a pullback in the direction of the main trend is identified, the indicator generates signals that could be used to open positions.
Simple and Clear Construction: The indicator is based on the classic SAR, with added pullback detection logic to enhance the accuracy of the signals.
Parameters:
Start (SAR Step): Determines the initial step for the SAR calculation, which controls the rate of change in the indicator at the beginning.
Increment (SAR Increment): Defines the maximum step size for SAR, allowing traders to adjust the indicator’s sensitivity to market volatility.
Max Value (SAR Max): Sets the upper limit for the SAR value, controlling its volatility.
Usage:
Swing Trading: Ideal for swing strategies, aiming to capture larger price moves while maintaining a safe margin.
Scalping: Due to its precise pullback detection, it can also be used in scalping, especially when the price quickly returns to the main trend.
Risk Management: The combination of SAR and pullback detection allows traders to adjust their positions according to changing market conditions.
Special Notes:
Adjusting Parameters: Depending on the market and trading style, users can adjust the SAR parameters (Start, Increment, Max Value) to fit their needs.
Combination with Other Indicators: It's recommended to use the indicator alongside other technical analysis tools (e.g., EMA, RSI) to enhance the accuracy of the signals.
Link to the script: This open-source version of the indicator is available on TradingView, enabling full customization and adjustments to meet your personal trading strategy. Share your experiences and suggestions!
Ross Cameron-Inspired Day Trading StrategyExplanation for Community Members:
Title: Ross Cameron-Inspired Day Trading Strategy
Description:
This script is designed to help you identify potential buy and sell opportunities during the trading day. It combines several popular trading strategies to provide clear signals.
Key Features:
Gap and Go: Identifies stocks that have gapped up or down at the open.
Momentum Trading: Uses RSI and EMA to identify momentum-based entry points.
Mean Reversion: Uses RSI and SMA to identify potential reversals.
How to Use:
Apply to Chart: Add this script to your TradingView chart.
Set Timeframe: Works best on 5-minute and 10-minute timeframes.
Watch for Signals: Look for green "BUY" labels for entry points and red "SELL" labels for exit points.
Parameters:
Gap Percentage: Adjust to identify larger or smaller gaps.
RSI Settings: Customize the RSI length and overbought/oversold levels.
EMA and SMA Lengths: Adjust the lengths of the moving averages.
Confirmation Period: Set how many bars to wait for confirmation.
Visual Elements:
BUY Signals: Green labels below the price bars.
SELL Signals: Red labels above the price bars.
Indicators: Displays EMA (blue) and SMA (orange) for additional context.
This script is a powerful tool for day trading on NSE and BSE indices, combining multiple strategies to provide robust trading signals. Adjust the parameters to suit your trading style and always combine with your own analysis for best results.

Bottom and Top finder [theUltimator5]🧭 Bottom and Top Finder — Multi-Symbol Momentum Divergence Detector
The Bottom and Top Finder by theUltimator5 is a highly configurable, momentum-based indicator designed to identify potential market reversal points using a multi-symbol relative strength comparison framework. It evaluates Directional Movement Index (DMI) values from up to three correlated or macro-influential assets to determine when the current instrument may be approaching a bottom (oversold exhaustion) or a top (overbought exhaustion).
🧠 How It Works
This script computes both the +DI (positive directional index) and -DI (negative directional index) for:
The currently selected chart symbol
Up to three user-defined reference symbols (e.g., sector leaders, macro ETFs, currencies, volatility proxies)
It uses a logarithmic percent-change approach to normalize all movement metrics, ensuring results are scale-invariant and price-neutral — meaning it works consistently whether a stock trades at $1 or $100,000. This makes the comparison between different assets meaningful, even if they trade on different scales or volatility levels.
The indicator then:
Compares the +DI values of the reference symbols to the current symbol’s +DI → seeking bottoming signals (suggesting the current symbol is unusually weak).
Compares the -DI values of the reference symbols to the current symbol’s -DI → seeking topping signals (suggesting the current symbol is unusually strong on the downside).
These comparisons are aggregated using a weighted average, where you control the influence (multiplier) of each reference symbol.
🔁 Trigger Logic
The indicator generates two dynamic lines:
Bot Line (Bottom Line): Based on reference +DI vs. current +DI
Top Line: Based on reference -DI vs. current -DI
If the Bot Line rises above the user-defined threshold, it may signal that capitulation or oversold conditions are developing. Similarly, if the Top Line rises above its threshold, it may indicate a blow-off top or overbought selling pressure.
To avoid false positives, a second smoothing-based condition must also be met:
The line must significantly exceed its moving average, confirming momentum divergence.
When both conditions are true, the indicator highlights the background in light red (bottom alert) or green (top alert) for easy visual scanning.
🔧 Key Inputs & Customization
You can fine-tune this tool using the following parameters:
Smoothing Length: Controls how smooth or sensitive the DI values are.
Reference Symbols: Up to 3 assets (default: RSP, HYG, DXY) — customizable for sector, macro, or inverse relationships.
Influence Multipliers: Adjust the weight each symbol has on the overall signal.
Display Options:
Toggle to highlight the chart background during trigger conditions.
Toggle to display a real-time table of reference symbols and their influence levels.
📈 Visual Output
Two plotted lines: One for bottoms and one for tops
Dynamically colored based on how far they exceed thresholds
Background highlights to mark trigger zones
Optional table displaying the current reference symbol setup and weights
🛠 Best Use Cases
This tool is ideal for:
Identifying short-term tops or bottoms using momentum exhaustion
Spotting divergences between an asset and broader market or sector health
Macro analysis with assets like SPY, QQQ, GME, MSFT, BTC, etc...
Pair trading signals or market breadth confirmation/disagreement
It complements other technical indicators like RSI, MACD, Bollinger Bands, or price structure patterns (double bottoms/tops, etc.)

EMA and VWAP by Phil VoEMA and VWAP by Phil Vo
Description
This indicator combines two powerful technical analysis tools: Exponential Moving Averages (EMAs) and Volume Weighted Average Price (VWAP). Designed to assist traders in identifying trends and key price levels, this script overlays two customizable EMAs and a daily VWAP on your chart.
* EMA 1 (Blue): A fast-moving EMA with a default period of 9, ideal for short-term trend analysis.
* EMA 2 (Red): A slower EMA with a default period of 21, useful for confirming longer-term trends.
* VWAP (Yellow): The Volume Weighted Average Price, calculated using the typical price (HLC3) and volume, resetting daily. It serves as a dynamic support/resistance level and reflects the average price weighted by volume.
Features
* Customizable EMAs: Adjust the periods of both EMAs via the settings (minimum period: 1).
* Visual Clarity: Each line is plotted in a distinct color (Blue for EMA 1, Red for EMA 2, Yellow for VWAP) with a linewidth of 2 for easy identification.
* Daily VWAP: The VWAP resets at the start of each trading day, providing a reliable intraday reference point.
* Tooltips: Hover over the input settings to see descriptions of each EMA period.
How to Use
1. Add the indicator to your chart.
2. Customize the EMA periods in the settings if desired (defaults are 9 and 21).
3. Use the EMAs to spot trends:
* When EMA 1 crosses above EMA 2, it may signal a bullish trend.
* When EMA 1 crosses below EMA 2, it may indicate a bearish trend.
4. Use the VWAP as a dynamic support/resistance level:
* Prices above VWAP might suggest bullish momentum.
* Prices below VWAP might indicate bearish pressure.
Settings
* EMA 1 Length: Set the period for the fast EMA (default: 9).
* EMA 2 Length: Set the period for the slow EMA (default: 21).
Notes
* The VWAP resets daily by default, making it most suitable for intraday trading.
* This script is open-source under the Mozilla Public License 2.0, so feel free to study or modify it!
Author
Created by Phil Vo. Happy trading!
How to Add This to TradingView
When you publish the script:
1. Paste the description above into the "Description" field in the "Publish Script" dialog.
2. Set the title as "EMA and VWAP by Phil Vo".
3. Choose "Public" visibility and "Open" access to share it with the community.
4. Add tags like "EMA", "VWAP", "Moving Average", "Trend", and "Volume" to help users find it.
This description provides a clear explanation of the indicator’s purpose, usage instructions, and customization options, making it accessible and helpful for TradingView users. Let me know if you’d like to adjust anything!

Daily Bollinger Band StrategyOverview of the Daily Bollinger Band Strategy
1. Strategy Overview and Features
This strategy is a tool for backtesting a trading method that uses Bollinger Bands. It is *not* a tool for automated trading.
1-1. Main Display Items
The main chart displays the Bollinger Bands and the 200-day moving average.
It also shows the entry and exit points along with the position size (in units of 100 shares).
1-2. Summary of Trading Rules
For long (buy) strategies, the trade enters when the price crosses above the +1σ line of the Bollinger Bands, aiming to ride an upward trend. The position is exited when the price crosses below the middle band.
For short (sell) strategies, the trade enters when the price crosses below the -1σ line of the Bollinger Bands, aiming to ride a downward trend. The position is exited when the price crosses above the middle band.
1-3. Strategic Enhancements
The strategy uses the slope of the 200-day moving average to determine the trend direction and enter trades accordingly. This improves the win rate and payoff ratio.
Additionally, to reduce the probability of ruin, the risk per trade is limited to 1.0% of capital, and position sizing is adjusted using ATR (a volatility indicator).
2. Trading Rules
2-1. Chart Type
Only daily charts are used.
2-2. Indicators Used
(1) Bollinger Bands** (used for entry and exit signals)
- Period: Fixed at 80 days
- Upper and lower bands: Fixed at ±1σ
(2) Moving Average** (used to determine trend direction)
- Period: Fixed at 200 days
- Trend direction is judged based on whether the difference from the previous day is positive (upward) or negative (downward)
2-3. Buy Rules
Setup:
- Price crosses above the +1σ line from below
- Both the middle band and 200-day moving average are upward sloping
Entry:
- Buy at the next day’s market open using a market order
Exit:
- If the price crosses below the middle band, sell at the next day’s open using a market order
2-4. Sell Rules
Setup:
- Price crosses below the -1σ line from above
- Both the middle band and 200-day moving average are downward sloping
Entry:
- Sell at the next day’s market open using a market order
Exit:
- If the price crosses above the middle band, buy back at the next day’s open using a market order
2-5. Risk Management Rules
- Risk per trade: 1.0% of total capital (acceptable loss = capital × 1.0%)
- Position size: Acceptable loss ÷ 2ATR (rounded down to the nearest unit of 100 shares)
2-6. Other Notes
- No brokerage fees
- No pyramiding
- No partial exits
- No reverse positions (no “stop-and-reverse” trades)
3. Strategy Parameters
The following settings can be specified:
3-1. Period Settings
- Start date: Set the start date for the backtest period
- Stop date: Set the end date for the backtest period
3-2. Display of Trend and Signals
- Show trend: When checked, the background color of the bars is light red for an uptrend and light blue for a downtrend
- Show signal: When checked, entry and exit signals are displayed (note: signals are executed at the next day’s open, so there is a one-day lag in the display)
3-3. Capital Management Settings
- Funds: Capital available for trading (in JPY)
- Risk rate: Specify what percentage of the capital to risk per trade
Settings in the “Properties” tab are not used in this strategy.
4. Backtest Results (Example)
Here are the backtest results conducted by the author:
- Target Stocks: All components of the Nikkei 225
- Test Period: January 4, 2000 – December 30, 2024
- Data Points: 12,886
- Win Rate: 33.45%
- Net Profit: ¥82,132,380
- Payoff Ratio: 2.450
- Expected Value: ¥6,373.8
- Risk Rate: 1.0%
- Probability of Ruin: 0.00%
---
デイリー・ボリンジャーバンド・ストラテジーの概要
1. ストラテジーの概要と特徴
このストラテジーは、ボリンジャーバンドを使ったトレード手法のバックテストを行うツールです。自動売買を行うツールではありません。
1-1. 主な表示項目
メインチャートにボリンジャーバンドと 200日移動平均線を表示します。
また、エントリーと手仕舞いのタイミングと数量(100株単位)も表示されます。
1-2. トレードルールの概要
買い戦略の場合、ボリンジャーバンドの +1σ 超えでエントリーして上昇トレンドに乗り、ミドルバンドを割ったら決済します。
売り戦略の場合、ボリンジャーバンドの -1σ 割りでエントリーして下降トレンドに乗り、ミドルバンドを上抜けたら決済します。
1-3. ストラテジーの工夫点
200日移動平均線の傾きを見てトレンド方向にエントリーをしています。こうして勝率とペイオフレシオの成績を向上しています。
また、破産確率を抑えるために、リスク資金比率を 1.0% にして、ATR(ボラティリティ指標) を使って注文数を調整しています。
2. 売買ルール
2-1. 使用するチャート
日足チャートに限定します
2-2. 使用する指標
(1) ボリンジャーバンド(仕掛けと手仕舞いのシグナルに使用)
期間は80日に固定
上下バンドは ±1σ に固定
(2) 移動平均線(トレンドの方向を見るために使用)
期間は200日に固定
移動平均の値の前日との差がプラスのとき上向き、マイナスのとき下向きと判断
2-3. 買いのルール
セットアップ:ボリンジャーバンドの +1σ を価格が下から上に交差 かつ ミドルバンドと 200日移動平均線が上向き
仕掛け:翌日の寄り付きに成行で買う
手仕舞い:ボリンジャーバンドのミドルバンドを価格が上から下に交差したら、翌日の寄り付きに成行で売る
2-4. 売りのルール
セットアップ:ボリンジャーバンドの -1σ を価格が上から下に交差 かつ ミドルバンドと 200日移動平均線が下向き
仕掛け:翌日の寄り付きに成行で売る
手仕舞い:ボリンジャーバンドのミドルバンドを価格が下から上に交差したら、翌日の寄り付きに成行で買い戻す
2-5. 資金管理のルール
リスク資金比率:資産の 1.0%(許容損失 = 資産 × 1.0%)
注文数:許容損失 ÷ 2ATR(単元株数未満は切り捨て)
2-6. その他
仲介手数料:なし
ピラミッディング:なし
分割決済:なし
ドテン:しない
3. ストラテジーのパラメーター
次の項目が指定できます。
3-1. 期間の設定
Staer date : バックテストの検証期間の開始日を指定します
Stop date : バックテストの検証期間の終了日を指定します
3-2. トレンドとシグナルの表示
Show trend : チェックを入れると、バーの背景色が、トレンドが上昇のときは薄い赤で、下落のときは薄い青で表示されます
Show signal : チェックを入れると、エントリーと手仕舞いのシグナルを表示します(シグナルの出た翌日の寄り付きに売買をするので表示に1日のずれがあります)
3-3. 資金管理用の設定
Funds : トレード用の資金(円)
Risk rate : 許容損失を資金の何%にするかで指定します
「プロパティタブ」で設定する値は、このストラテジーでは有効ではありません。
4. バックテストの結果(例)
作者がバックテストを実施した結果をお知らせします。
対象銘柄:日経225構成銘柄すべて
対象期間:2000年1月4日~2024年12月30日
データ件数:12,886
勝率:33.45%
純利益:82,132,380
ペイオフレシオ:2.450
期待値:6,373.8
リスク資金比率:1.0%
破産確率:0.00%

NY First Candle Break and RetestStrategy Overview
Session and Time Parameters:
The strategy focuses on the New York trading session, starting at 9:30 AM and lasting for a predefined session length, typically 3 to 4 hours. This timing captures the most active market hours, providing ample trading opportunities.
Strategy Parameters:
Utilizes the Average True Range (ATR) to set dynamic stop-loss levels, ensuring risk is managed according to market volatility.
Employs a reward-to-risk ratio to determine take profit levels, aiming for a balanced approach between potential gains and losses.
Strategy Settings:
Incorporates simple moving averages (EMA) and the Volume Weighted Average Price (VWAP) to identify trend direction and price levels.
Volume confirmation is used to validate breakouts, ensuring trades are based on significant market activity.
Trade Management:
Features a trailing stop mechanism to lock in profits as the trade moves in favor, with multiple take profit levels to secure gains incrementally.
The strategy is designed to handle both long and short positions, adapting to market conditions.
Alert Settings:
Provides alerts for key events such as session start, breakout, retest, and entry signals, helping traders stay informed and act promptly.
Visual cues on the chart highlight entry and exit points, making it easier for beginners to follow the strategy.
This strategy is particularly suited for the current volatile market environment, where simplicity and clear guidelines can help beginner traders navigate the complexities of trading. It emphasizes risk management and uses straightforward indicators to make informed trading decisions.
I put together this Trading View scalping strategy for futures markets with some help from Claude AI. Shoutout to everyone who gave me advice along the way—I really appreciate it! I’m sure there’s room for improvement, so feel free to share your thoughts… just go easy on me. :)
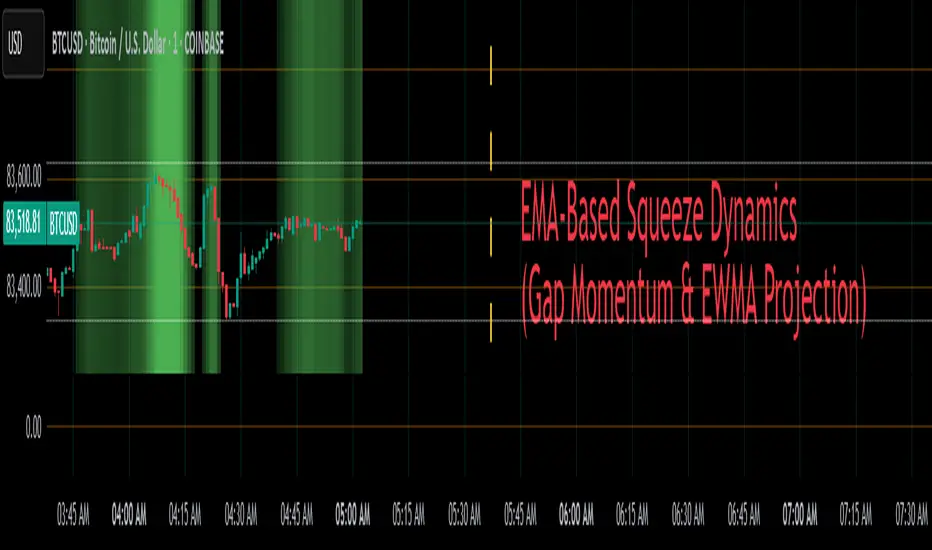
EMA-Based Squeeze Dynamics (Gap Momentum & EWMA Projection)EMA-Based Squeeze Dynamics (Gap Momentum & EWMA Projection)
🚨 Main Utility: Early Squeeze Warning
The primary function of this indicator is to warn traders early when the market is approaching a "squeeze"—a tightening condition that often precedes significant moves or regime shifts. By visually highlighting areas of increasing tension, it helps traders anticipate potential volatility and prepare accordingly. This is intended to be a statistically and psychologically grounded replacement of so-called "fib-time-zones," which are overly-deterministic and subjective.
📌 Overview
The EMA-Based Squeeze Dynamics indicator projects future regime shifts (such as golden and death crosses) using exponential moving averages (EMAs). It employs historical interval data and current market conditions to dynamically forecast when the critical EMAs (50-period and 200-period) will reconverge, marking likely trend-change points.
This indicator leverages two core ideas:
Behavioral finance theory: Traders often collectively anticipate popular EMA crossovers, creating a self-fulfilling prophecy (normative social influence), similar to findings from Solomon Asch’s conformity experiments.
Bayesian-like updates: It utilizes historical crossover intervals as a prior, dynamically updating expectations based on evolving market data, ensuring its signals remain objectively grounded in actual market behavior.
⚙️ Technical & Mathematical Explanation
1. EMA Calculations and Regime Definitions
The indicator uses three EMAs:
Fast (9-period): Represents short-term price movement.
Medial (50-period): Indicates medium-term trend direction.
Slow (200-period): Defines long-term market sentiment.
Regime States:
Bullish: 50 EMA is above the 200 EMA.
Bearish: 50 EMA is below the 200 EMA.
A shift between these states triggers visual markers (arrows and labels) directly on the chart.
2. Gap Dynamics and Historical Intervals
At each crossover:
The indicator records the gap (distance) between the 50 and 200 EMAs.
It tracks the historical intervals between past crossovers.
An Exponentially Weighted Moving Average (EWMA) of these intervals is calculated, weighting recent intervals more heavily, dynamically updating expectations.
Important note:
After every regime shift, the projected crossover line resets its calculation. This reset is visually evident as the projection line appears to move further away after each regime change, temporarily "repelled" until the EMAs begin converging again. This ensures projections remain realistic, grounded in actual EMA convergence, and prevents overly optimistic forecasts immediately after a regime shift.
3. Gap Momentum & Adaptive Scaling
The indicator measures how quickly or slowly the gap between EMAs is changing ("gap momentum") and adjusts its forecast accordingly:
If the gap narrows rapidly, a crossover becomes more imminent.
If the gap widens, the next crossover is pushed further into the future.
The "gap factor" dynamically scales the projection based on recent gap momentum, bounded between reasonable limits (0.7–1.3).
4. Squeeze Ratio & Background Color (Visual Cues)
A "squeeze ratio" is computed when market conditions indicate tightening:
In a bullish regime, if the fast EMA is below the medial EMA (price pulling back towards long-term support), the squeeze ratio increases.
In a bearish regime, if the fast EMA rises above the medial EMA (price rallying into long-term resistance), the squeeze ratio increases.
What the Background Colors Mean:
Red Background: Indicates a bullish squeeze—price is compressing downward, hinting a bullish reversal or continuation breakout may occur soon.
Green Background: Indicates a bearish squeeze—price is compressing upward, suggesting a bearish reversal or continuation breakout could soon follow.
Opacity Explanation:
The transparency (opacity) of the background indicates the intensity of the squeeze:
High Opacity (solid color): Strong squeeze, high likelihood of imminent volatility or regime shift.
Low Opacity (faint color): Mild squeeze, signaling early stages of tightening.
Thus, more vivid colors serve as urgent visual warnings that a squeeze is rapidly intensifying.
5. Projected Next Crossover and Pseudo Crossover Mechanism
The indicator calculates an estimated future bar when a crossover (and thus, regime shift) is expected to occur. This calculation incorporates:
Historical EWMA interval.
Current squeeze intensity.
Gap momentum.
A dynamic penalty based on divergence from baseline conditions.
The "Pseudo Crossover" Explained:
A key adaptive feature is the pseudo crossover mechanism. If price action significantly deviates from the projected crossover (for example, if price stays beyond the projected line longer than expected), the indicator acknowledges the projection was incorrect and triggers a "pseudo crossover" event. Essentially, this acts as a reset, updating historical intervals with a weighted adjustment to recalibrate future predictions. In other words, if the indicator’s initial forecast proves inaccurate, it recognizes this quickly, resets itself, and tries again—ensuring it remains responsive and adaptive to actual market conditions.
🧠 Behavioral Theory: Normative Social Influence
This indicator is rooted in behavioral finance theory, specifically leveraging normative social influence (conformity). Traders commonly watch EMA signals (especially the 50 and 200 EMA crossovers). When traders collectively anticipate these signals, they begin trading ahead of actual crossovers, effectively creating self-fulfilling prophecies—similar to Solomon Asch’s famous conformity experiments, where individuals adopted group behaviors even against direct evidence.
This behavior means genuine regime shifts (actual EMA crossovers) rarely occur until EMAs visibly reconverge due to widespread anticipatory trading activity. The indicator quantifies these dynamics by objectively measuring EMA convergence and updating projections accordingly.
📊 How to Use This Indicator
Monitor the background color and opacity as primary visual cues.
A strongly colored background (solid red/green) is an early alert that a squeeze is intensifying—prepare for potential volatility or a regime shift.
Projected crossover lines give a dynamic target bar to watch for trend reversals or confirmations.
After each regime shift, expect a reset of the projection line. The line may seem initially repelled from price action, but it will recalibrate as EMAs converge again.
Trust the pseudo crossover mechanism to automatically recalibrate the indicator if its original projection misses.
🎯 Why Choose This Indicator?
Early Warning: Visual squeeze intensity helps anticipate market breakouts.
Behaviorally Grounded: Leverages real trader psychology (conformity and anticipation).
Objective & Adaptive: Uses real-time, data-driven updates rather than static levels or subjective analysis.
Easy to Interpret: Clear visual signals (arrows, labels, colors) simplify trading decisions.
Self-correcting (Pseudo Crossovers): Quickly adjusts when initial predictions miss, maintaining accuracy over time.
Summary:
The EMA-Based Squeeze Dynamics Indicator combines behavioral insights, dynamic Bayesian-like updates, intuitive visual cues, and a self-correcting pseudo crossover feature to offer traders a reliable early warning system for market squeezes and impending regime shifts. It transparently recalibrates after each regime shift and automatically resets whenever projections prove inaccurate—ensuring you always have an adaptive, realistic forecast.
Whether you're a discretionary trader or algorithmic strategist, this indicator provides a powerful tool to navigate market volatility effectively.
Happy Trading! 📈✨
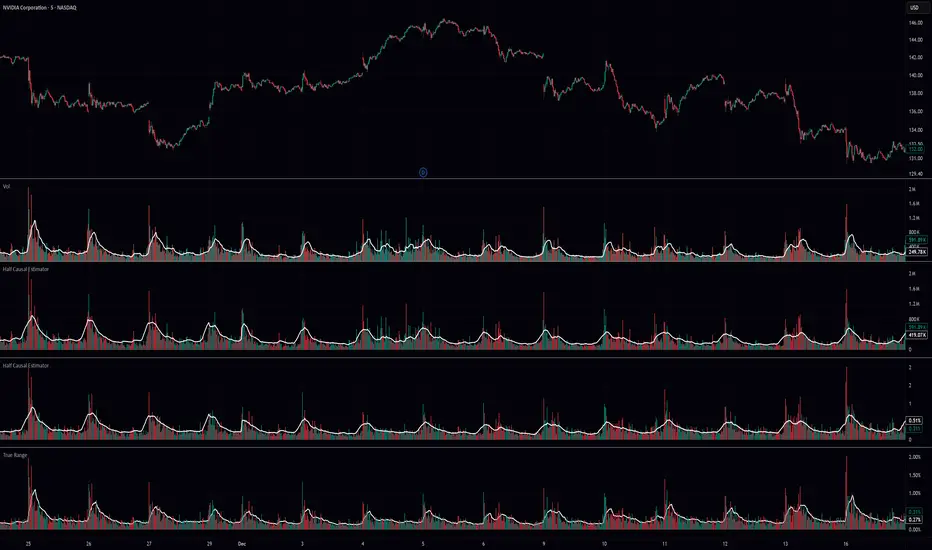
Half Causal EstimatorOverview
The Half Causal Estimator is a specialized filtering method that provides responsive averages of market variables (volume, true range, or price change) with significantly reduced time delay compared to traditional moving averages. It employs a hybrid approach that leverages both historical data and time-of-day patterns to create a timely representation of market activity while maintaining smooth output.
Core Concept
Traditional moving averages suffer from time lag, which can delay signals and reduce their effectiveness for real-time decision making. The Half Causal Estimator addresses this limitation by using a non-causal filtering method that incorporates recent historical data (the causal component) alongside expected future behavior based on time-of-day patterns (the non-causal component).
This dual approach allows the filter to respond more quickly to changing market conditions while maintaining smoothness. The name "Half Causal" refers to this hybrid methodology—half of the data window comes from actual historical observations, while the other half is derived from time-of-day patterns observed over multiple days. By incorporating these "future" values from past patterns, the estimator can reduce the inherent lag present in traditional moving averages.
How It Works
The indicator operates through several coordinated steps. First, it stores and organizes market data by specific times of day (minutes/hours). Then it builds a profile of typical behavior for each time period. For calculations, it creates a filtering window where half consists of recent actual data and half consists of expected future values based on historical time-of-day patterns. Finally, it applies a kernel-based smoothing function to weight the values in this composite window.
This approach is particularly effective because market variables like volume, true range, and price changes tend to follow recognizable intraday patterns (they are positive values without DC components). By leveraging these patterns, the indicator doesn't try to predict future values in the traditional sense, but rather incorporates the average historical behavior at those future times into the current estimate.
The benefit of using this "average future data" approach is that it counteracts the lag inherent in traditional moving averages. In a standard moving average, recent price action is underweighted because older data points hold equal influence. By incorporating time-of-day averages for future periods, the Half Causal Estimator essentially shifts the center of the filter window closer to the current bar, resulting in more timely outputs while maintaining smoothing benefits.
Understanding Kernel Smoothing
At the heart of the Half Causal Estimator is kernel smoothing, a statistical technique that creates weighted averages where points closer to the center receive higher weights. This approach offers several advantages over simple moving averages. Unlike simple moving averages that weight all points equally, kernel smoothing applies a mathematically defined weight distribution. The weighting function helps minimize the impact of outliers and random fluctuations. Additionally, by adjusting the kernel width parameter, users can fine-tune the balance between responsiveness and smoothness.
The indicator supports three kernel types. The Gaussian kernel uses a bell-shaped distribution that weights central points heavily while still considering distant points. The Epanechnikov kernel employs a parabolic function that provides efficient noise reduction with a finite support range. The Triangular kernel applies a linear weighting that decreases uniformly from center to edges. These kernel functions provide the mathematical foundation for how the filter processes the combined window of past and "future" data points.
Applicable Data Sources
The indicator can be applied to three different data sources: volume (the trading volume of the security), true range (expressed as a percentage, measuring volatility), and change (the absolute percentage change from one closing price to the next).
Each of these variables shares the characteristic of being consistently positive and exhibiting cyclical intraday patterns, making them ideal candidates for this filtering approach.
Practical Applications
The Half Causal Estimator excels in scenarios where timely information is crucial. It helps in identifying volume climaxes or diminishing volume trends earlier than conventional indicators. It can detect changes in volatility patterns with reduced lag. The indicator is also useful for recognizing shifts in price momentum before they become obvious in price action, and providing smoother data for algorithmic trading systems that require reduced noise without sacrificing timeliness.
When volatility or volume spikes occur, conventional moving averages typically lag behind, potentially causing missed opportunities or delayed responses. The Half Causal Estimator produces signals that align more closely with actual market turns.
Technical Implementation
The implementation of the Half Causal Estimator involves several technical components working together. Data collection and organization is the first step—the indicator maintains a data structure that organizes market data by specific times of day. This creates a historical record of how volume, true range, or price change typically behaves at each minute/hour of the trading day.
For each calculation, the indicator constructs a composite window consisting of recent actual data points from the current session (the causal half) and historical averages for upcoming time periods from previous sessions (the non-causal half). The selected kernel function is then applied to this composite window, creating a weighted average where points closer to the center receive higher weights according to the mathematical properties of the chosen kernel. Finally, the kernel weights are normalized to ensure the output maintains proper scaling regardless of the kernel type or width parameter.
This framework enables the indicator to leverage the predictable time-of-day components in market data without trying to predict specific future values. Instead, it uses average historical patterns to reduce lag while maintaining the statistical benefits of smoothing techniques.
Configuration Options
The indicator provides several customization options. The data period setting determines the number of days of observations to store (0 uses all available data). Filter length controls the number of historical data points for the filter (total window size is length × 2 - 1). Filter width adjusts the width of the kernel function. Users can also select between Gaussian, Epanechnikov, and Triangular kernel functions, and customize visual settings such as colors and line width.
These parameters allow for fine-tuning the balance between responsiveness and smoothness based on individual trading preferences and the specific characteristics of the traded instrument.
Limitations
The indicator requires minute-based intraday timeframes, securities with volume data (when using volume as the source), and sufficient historical data to establish time-of-day patterns.
Conclusion
The Half Causal Estimator represents an innovative approach to technical analysis that addresses one of the fundamental limitations of traditional indicators: time lag. By incorporating time-of-day patterns into its calculations, it provides a more timely representation of market variables while maintaining the noise-reduction benefits of smoothing. This makes it a valuable tool for traders who need to make decisions based on real-time information about volume, volatility, or price changes.
DM Support / Resistance (USA Session)This indicator is specifically designed for use on the 4-hour time frame and helps traders identify key support and resistance levels during the USA trading session (9:30 AM to 4:00 PM Eastern Time). The indicator calculates important price levels to assist in making well-informed entry and exit decisions, particularly for those focusing on swing trades or longer-term intraday strategies. It also includes a feature to skip setups when relevant fundamental news is scheduled, ensuring you avoid trading during periods of high volatility.
Key Features:
Support and Resistance Levels (S1 & R1):
The indicator calculates and displays Support 1 (S1) and Resistance 1 (R1) levels, which act as key barriers for price action and help traders spot potential reversal or breakout zones on the chart.
Pivot Point (PP):
The Pivot Point (PP) is calculated as the average of the previous period's high, low, and close. It serves as a central reference point for market direction, allowing traders to evaluate whether the market is in a bullish or bearish trend.
Market Bias:
The Bias is shown as a histogram that helps traders assess the strength of the market trend. A positive bias suggests bullish sentiment, while a negative bias signals bearish conditions. This can be used to confirm the overall trend direction.
4-Hour Time Frame:
The indicator is optimized for the 4-hour time frame, making it suitable for traders looking for swing trades or those who wish to capture longer-term trends within the USA session. The key support, resistance, and pivot levels are recalculated dynamically to reflect price action over 4-hour periods.
Dynamic Plotting and Alerts:
Support and resistance levels are drawn as dashed horizontal lines, updating in real-time to reflect the most current market data during the USA session. Alerts can be set for significant price movements crossing these levels.
Stop-Loss Strategy Based on 15-Minute Time Frame:
A unique feature of this indicator is its stop-loss strategy, which uses 15-minute time frame support and resistance levels. When a long or short entry is triggered on the 4-hour chart, traders should place their stop-loss according to the relevant 15-minute support or resistance level.
If the price closes above the 15-minute support for a long entry, or closes below the 15-minute resistance for a short entry, it signals the need to exit or adjust your position based on these levels.
Fundamental News Filter:
To avoid unnecessary risk, the indicator incorporates a fundamental news filter. If there is relevant news scheduled during the USA session, such as high-impact economic data or central bank announcements, the indicator will skip the setup for that period. This prevents traders from entering positions during times of elevated volatility caused by news events, which could result in unpredictable price movements.
How to Use:
Long Entry: When the Bias is positive and the price breaks above Support 1 (S1), this signals a potential bullish move. Consider entering a long position at this point.
Stop-Loss Strategy: Set your stop-loss at the respective 15-minute support level. If the price closes below this level, it could signal a reversal, prompting you to exit the trade.
Short Entry: When the Bias is negative and the price breaks below Resistance 1 (R1), this signals a potential bearish move. Enter a short position at this point.
Stop-Loss Strategy: Set your stop-loss at the respective 15-minute resistance level. If the price closes above this level, exit the short trade as it could indicate a bullish reversal.
Pivot Point (PP): The Pivot Point serves as a reference level to gauge potential price reversals. A move above the PP suggests a bullish bias, while trading below the PP suggests a bearish outlook.
Bias Histogram: The Bias Histogram helps confirm trend direction. A positive bias confirms long positions, while a negative bias reinforces short trades.
Avoid Trading During High-Impact News: If there is significant economic news or fundamental events scheduled during the USA session, the indicator will automatically skip any potential setup. This feature ensures you avoid entering trades that might be affected by unexpected news-driven volatility, keeping your trading strategy safer and more reliable.
Why Use This Indicator:
The 4-hour time frame is ideal for traders who prefer swing trading or those looking to capture longer-term trends in a structured manner. This indicator provides crucial insights into market direction, support/resistance levels, and potential entry/exit points.
The stop-loss management based on the 15-minute support and resistance levels helps traders protect their positions from sudden price reversals, ensuring more precise risk management.
The fundamental news filter is particularly useful for avoidance of high-risk periods. By skipping setups during high-impact news events, traders can avoid entering trades when price volatility could be unpredictable.
Overall, this indicator is a powerful tool for traders who want to make data-driven decisions based on technical analysis while ensuring that their positions are managed responsibly and avoiding news-driven risk.

Sun Moon Conjunctions Trine Oppositions 2025this script is an astrological tool designed to overlay significant Sun-Moon aspect events for 2025 on a Bitcoin chart. It highlights key lunar phases and aspects—Conjunctions (New Moon) in blue, Squares in red, Oppositions (Full Moon) in purple, and Trines in green—using background colors and labeled markers. Users can toggle visibility for each aspect type and adjust label sizes via customizable inputs. The script accurately marks events from January through December 2025, with labels appearing once per event, making it a valuable resource for exploring potential correlations between lunar cycles and Bitcoin price movements.
