2x Marubozu Signal (Wick ≤ 30%)The 2x Marubozu Signal (Wick ≤ 30%) is a powerful, momentum-based price action indicator designed to catch strong bullish or bearish trends early. It scans for two consecutive Marubozu-style candles (where wicks are ≤ 30% of the total candle size) to identify moments of solid conviction from buyers or sellers.
This indicator detects:
Bullish Signal: Two green candles in a row, both with tiny wicks (≤ 30% of total candle size), indicating strong buying pressure and momentum.
Bearish Signal: Two red candles in a row, both with tiny wicks (≤ 30%), signaling dominant selling pressure.
The signal appears on the second candle — confirming the continuation move after initial momentum.
Key Features:
🔍 Wick Ratio Filter: Only triggers if both candles have upper and lower wicks less than or equal to 30% of the full candle range (High - Low).
📈 Visual Signal Arrows:
Green Up Arrow on bullish 2x Marubozu
Red Down Arrow on bearish 2x Marubozu
⚙️ Clean and Lightweight: No lag, perfect for intraday, swing, or trend-based strategies.
🎯 Use Case:
Trend Confirmation: Enter after the second strong Marubozu to ride breakout moves.
Momentum Filter: Combine with your existing strategy to filter only high-conviction price action setups.
Reversal Spotting: Catch reversals at key support/resistance when Marubozus form.
🧠 Pro Tips:
Works best on 15m–1D charts, especially after consolidation.
Combine with support/resistance, volume, or EMA/SMA zones for confirmation.
Avoid overtrading in choppy zones—this is a momentum-only tool.
🚀 Who’s It For?
Price Action Traders
Scalpers & Swing Traders
Trend-followers
Crypto, Forex, Stocks
📌 Author Note:
This indicator was crafted for traders who trust pure candle structure over lagging indicators. If you respect momentum, this is your edge.
Индикаторы и стратегии

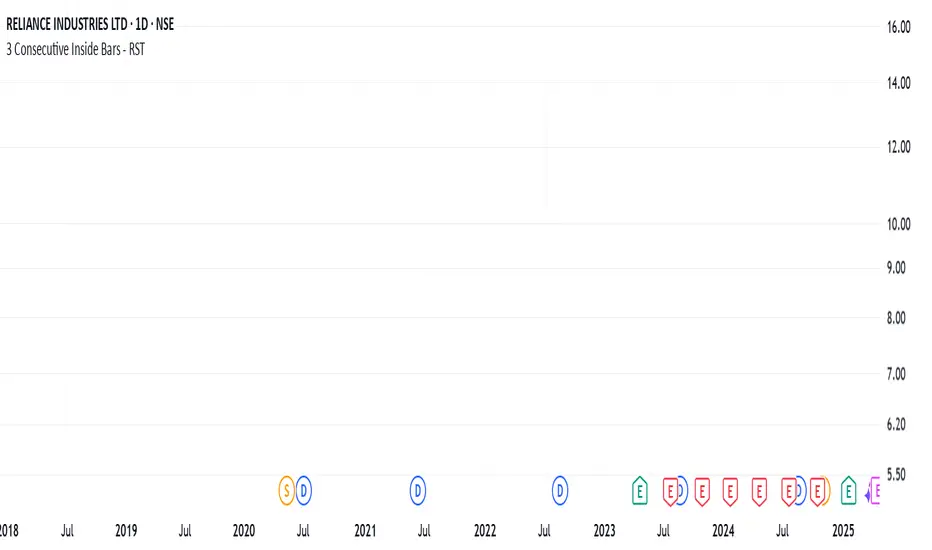
3 Consecutive Inside Bars - RSTInside bars are often used to identify potential consolidation periods or breakout setups.
This will provide tight range for 3 consecutive inside bars.
Remember that inside bar patterns are just one tool, and no indicator is perfect. Always use sound risk management.
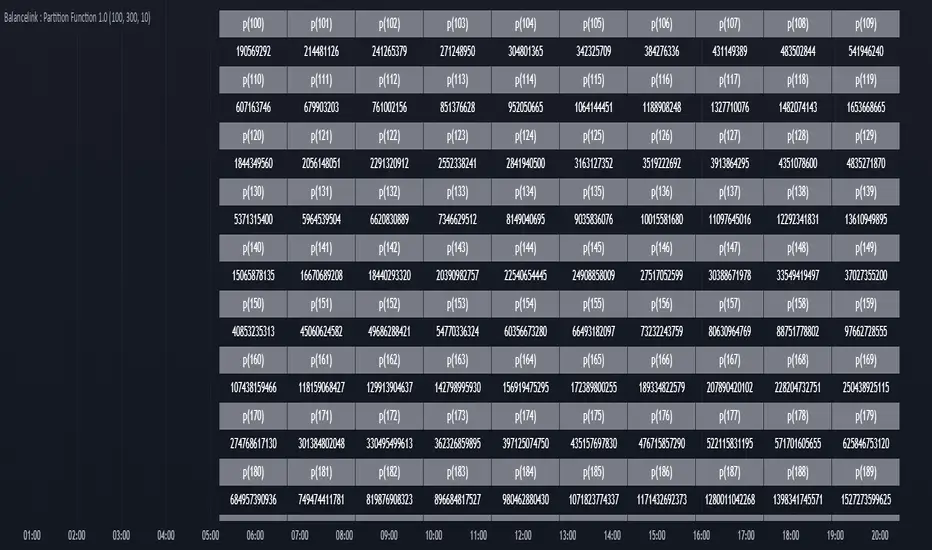
Balancelink : Partition Function 1.0This script computes the partition function values 𝑝(𝑛) using Euler’s Pentagonal Number Theorem and displays them in a horizontally wrapped table directly on the chart. The partition function is a classic function in number theory that counts the number of ways an integer 𝑛 can be expressed as a sum of positive integers, disregarding the order of the summands.
Key Features
Efficient Calculation:
The script computes 𝑝(𝑛) for all orders from 0 up to a user-defined maximum (set by the "End Order" input). The recursive computation leverages Euler’s Pentagonal Number Theorem, ensuring the function is calculated correctly for each order.
Display Range Selection:
Users can select a specific range of orders (for example, from 𝑛 = 100 to 𝑛 = 200 to display.) This means you can focus on a particular segment of the partition function results without cluttering the chart.
Horizontally Wrapped Table:
The partition values are organized into a clean, horizontal table with a customizable number of columns per row (default is 20). When the number of values exceeds the maximum columns, the table automatically wraps onto a new set of rows for better readability.
Medium Text Size:
The table cells use a medium (normal) text size for easy viewing and clarity.
How to Use
Inputs:
Start Order (n): The starting index from which you want to display the partition function (default is 100).
End Order (n): The ending index up to which the partition function values will be displayed (default is 200).
Max Columns Per Row: Determines how many results are shown per row before wrapping to the next (default is 20).
Calculation:
The script calculates all 𝑝(𝑛) values from 0 up to the specified "End Order". It then extracts and displays only the values in the chosen range.
Visualization:
The computed values are shown in a neatly arranged table at the top right of your TradingView chart, making it simple to scroll through and inspect the partition function values.
Use Cases
Educational & Research:
Ideal for educators and students exploring concepts of integer partitions and number theory.
Data Analysis & Pattern Recognition:
Useful for those interested in the behavior and growth of partition numbers as 𝑛 increases.
7-Day Narrow Range (NR7)NR7
NR7 stands for "Narrow Range 7." It identifies a day (or bar) with the narrowest trading range of the past seven days.
Traders often watch for NR7 patterns as they can indicate a period of consolidation before a potential breakout. A narrow range suggests that volatility is low, and a breakout could lead to a significant price move.
NR7 signals are often used in conjunction with other technical indicators and analysis techniques.
Remember that NR7 is just one tool, and no indicator is perfect. Always use sound risk management.
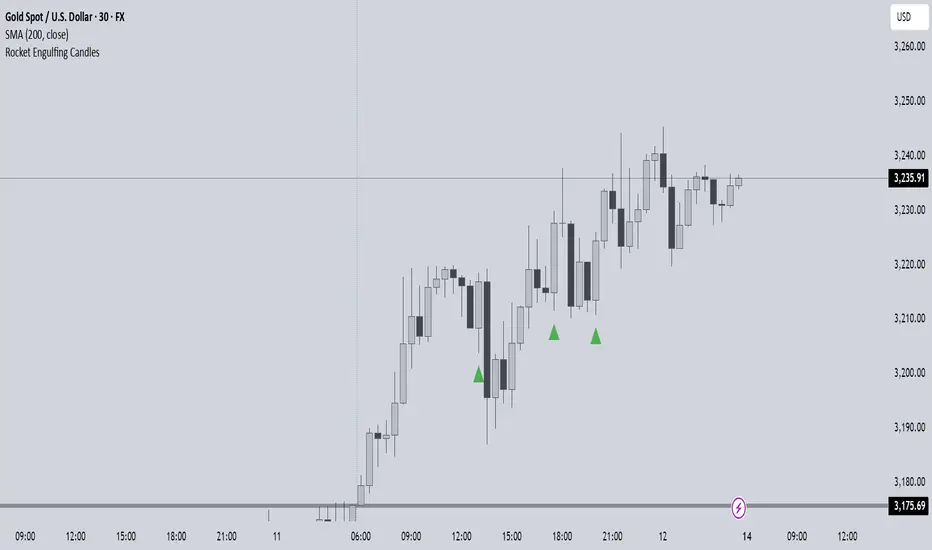
Rocket Engulfing Candles🚀 Rocket Engulfing Candles — Bullish & Bearish Detection
This script highlights powerful engulfing candles that resemble rockets — perfect for identifying potential reversals or momentum shifts.
Bullish Rocket (Green Triangle Up)
Fully engulfs the previous candle (higher high, lower low)
Closes higher (bullish body)
Has a longer lower wick (blast-off tail)
Bearish Rocket (Red Triangle Down)
Fully engulfs the previous candle
Closes lower (bearish body)
Has a longer upper wick (crash tail)
These patterns suggest strong buying/selling pressure with possible trend reversals. Ideal for traders looking to spot high-impact candle formations with a visual edge.
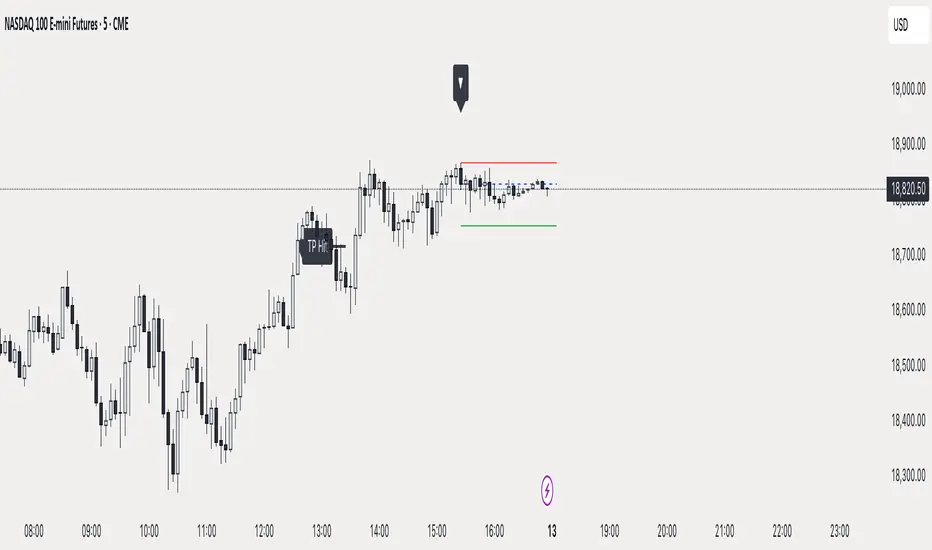
ICT Liquidity Sweep MAX RETRI (ALERT)Strategy Description: SMC + ICT Reversal Sniper | 5-Min | R2 TP
This strategy applies Smart Money Concepts (SMC) and ICT methodology to identify high-probability reversal trades using a clean, rule-based system designed for the 5-minute timeframe.
⸻
Core Logic:
• Liquidity Sweep: Identifies stop hunts beyond recent swing highs/lows using a configurable lookback window.
• Break of Structure (BOS): Validates a directional shift after the sweep.
• Fixed R2 Risk-Reward: Entry is followed by a 2:1 take-profit target. Stop loss is set at the sweep candle’s high/low.
• No Entry Between 8 PM–12 AM NY Time: Avoids the manipulation-prone and illiquid zone.
• Discreet SL Handling: SL hits close trades silently — no labels or visuals.
⸻
Entry Precision & Timing Notes:
• The strategy may occasionally fire before a confirmed liquidity sweep — this is expected. If a sweep occurs later, you may still re-enter toward equilibrium, with take profit also targeted at equilibrium.
• Alerts or trades that trigger near 9:30 AM NY often align with real direction, but this time can be volatile.
• For more reliable and lower-risk entries, focus on the 1:30 PM to 2:00 PM silver bullet window, which tends to produce cleaner setups with more favorable flow. 🖤
BySq - Market PsychologyThe script I provided is a Market Psychology Index indicator for TradingView, which focuses on three key psychological market phases:
FOMO (Fear of Missing Out)
Panic Selling
Reversal
This indicator uses volume, price changes, and specific time periods to gauge market sentiment. Let me break it down:
1. Input Parameters:
FOMO Period: Defines how many bars (candles) the FOMO index will consider for its calculation.
Panic Period: Defines the period to evaluate Panic Selling.
Reversal Period: Defines the period to evaluate potential price reversals.
You can adjust these periods based on your analysis preferences. The default for each period is 14.
2. FOMO Index:
The FOMO Index aims to capture the "fear of missing out" behavior in the market.
It uses volume and price change:
Volume is compared to the Simple Moving Average (SMA) of volume over the specified period.
Price change is calculated as the percentage change in price compared to the previous bar.
If both volume and price change indicate strong upward movement, the FOMO index spikes.
3. Panic Selling Index:
The Panic Selling Index captures when traders are selling out of fear, often in a rapid or irrational way.
Similar to the FOMO Index, it considers volume and price change:
It uses volume and compares it to the SMA of volume for the panic period.
Price change is negative, meaning it considers only price drops.
When there is high volume coupled with significant price drops, it signals panic selling.
4. Reversal Index:
The Reversal Index aims to detect potential trend reversals in the market.
This index also considers volume and price change:
It focuses on upward price movement and compares volume to its SMA.
If there’s strong upward price movement along with increasing volume, it signals the possibility of a price reversal.
5. Graphical Output:
Histograms are drawn on the chart for each of the three indices:
FOMO is shown in green (indicating the presence of FOMO) and red (when the index is low).
Panic Selling is shown in orange.
Reversal is shown in purple.
The Zero Line (horizontal dotted line) helps identify when any of the indices is positive or negative.
6. Labels:
Labels for each index are shown on the chart at the relevant bar when the index spikes.
FOMO is labeled "FOMO" in green when it spikes.
Panic Selling is labeled "Panic Selling" in orange when it spikes.
Reversal is labeled "Reversal" in purple when it spikes.
Additionally, period labels show above the chart, indicating the specific periods (FOMO, Panic, and Reversal periods) currently being applied. This provides clarity on what time frame each index is analyzing.
7. How to Use:
FOMO: High values may indicate that traders are buying out of fear of missing out on a rally, suggesting a potentially overheated market.
Panic Selling: High values could suggest irrational selling behavior or capitulation, potentially marking the bottom of a downtrend.
Reversal: High values signal the potential for a market reversal, where the price could change direction due to increased volume and upward movement.
8. Visual Appearance:
The indicator’s histograms change colors based on the level of market sentiment detected. The color-coded approach provides an easy-to-read visual representation of different psychological phases in the market.
The horizontal zero line allows easy differentiation between positive and negative values.
Summary:
This script combines the psychology of the market (FOMO, Panic Selling, and Reversal) into a set of indicators that help traders identify potential turning points or emotional states in the market. By focusing on volume and price change, the script attempts to give a clear picture of market sentiment and possible future movements.

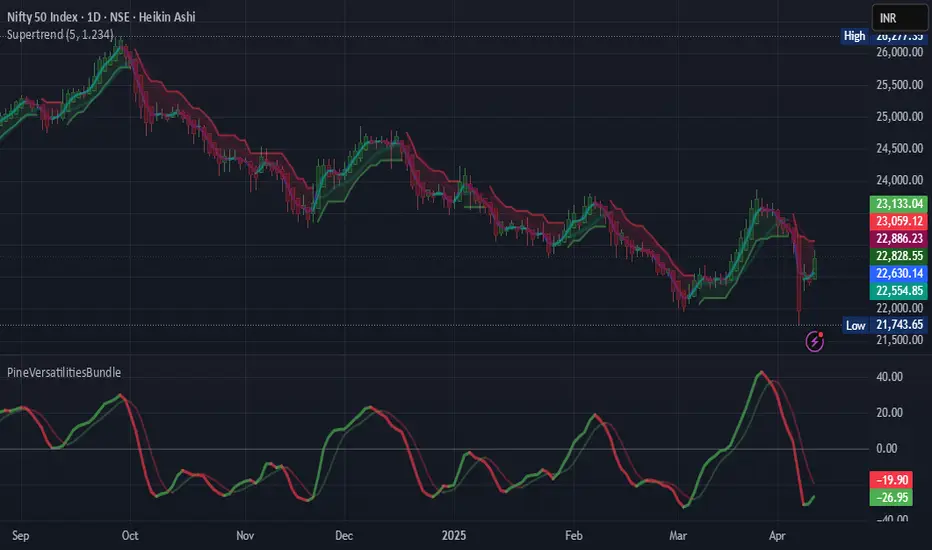
PineVersatilitiesBundleLibrary "PineVersatilitiesBundle"
Versatilities (aka, Versatile Utilities) Pack includes:
- Eighteen Price Variants bundled in a Map,
- Nine Smoothing Variants bundled in a Map,
- Visualisations that indicate on both - pane and chart.
price_variants(lb)
Computes Several different averages using current and previous OHLC values
Parameters:
lb (int) : - lookback distance for combining OHLC values from the past with the present
Returns: Map of Eighteen Uncommon Combinations of single and two-bar OHLC averages (rounded-to-mintick)
dynamic_MA(masrc, malen, lsmaoff, almasgm, almaoff, almaflr)
Dynamically computes Eight different MAs and returns a Map containing Nine MAs
Parameters:
masrc (float) : source series to compute MA
malen (simple int) : lookback distance for MA
lsmaoff (simple int) : optional LSMA offset - default is 0
almasgm (simple float) : optional ALMA sigma - default is 5
almaoff (simple float) : optional ALMA offset - default is 0.5
almaflr (simple bool) : optional ALMA floor flag - default is false
Returns: Map of MAs - 'ALMA', 'EMA', 'HMA', 'LSMA', 'RMA', 'SMA', 'SWMA', 'WMA', 'ALL' (rounded-to-mintick)
Moving Average Shift WaveTrend StrategyMoving Average Shift WaveTrend Strategy
🧭 Overview
The Moving Average Shift WaveTrend Strategy is a trend-following and momentum-based trading system designed to be overlayed on TradingView charts. It executes trades based on the confluence of multiple technical conditions—volatility, session timing, trend direction, and oscillator momentum—to deliver logical and systematic trade entries and exits.
🎯 Strategy Objectives
Enter trades aligned with the prevailing long-term trend
Exit trades on confirmed momentum reversals
Avoid false signals using session timing and volatility filters
Apply structured risk management with automatic TP, SL, and trailing stops
⚙️ Key Features
Selectable MA types: SMA, EMA, SMMA (RMA), WMA, VWMA
Dual-filter logic using a custom oscillator and moving averages
Session and volatility filters to eliminate low-quality setups
Trailing stop, configurable Take Profit / Stop Loss logic
“In-wave flag” prevents overtrading within the same trend wave
Visual clarity with color-shifting candles and entry/exit markers
📈 Trading Rules
✅ Long Entry Conditions:
Price is above the selected MA
Oscillator is positive and rising
200-period EMA indicates an uptrend
ATR exceeds its median value (sufficient volatility)
Entry occurs between 09:00–17:00 (exchange time)
Not currently in an active wave
🔻 Short Entry Conditions:
Price is below the selected MA
Oscillator is negative and falling
200-period EMA indicates a downtrend
All other long-entry conditions are inverted
❌ Exit Conditions:
Take Profit or Stop Loss is hit
Opposing signals from oscillator and MA
Trailing stop is triggered
🛡️ Risk Management Parameters
Pair: ETH/USD
Timeframe: 4H
Starting Capital: $3,000
Commission: 0.02%
Slippage: 2 pips
Risk per Trade: 2% of account equity (adjustable)
Total Trades: 224
Backtest Period: May 24, 2016 — April 7, 2025
Note: Risk parameters are fully customizable to suit your trading style and broker conditions.
🔧 Trading Parameters & Filters
Time Filter: Trades allowed only between 09:00–17:00 (exchange time)
Volatility Filter: ATR must be above its median value
Trend Filter: Long-term 200-period EMA
📊 Technical Settings
Moving Average
Type: SMA
Length: 40
Source: hl2
Oscillator
Length: 15
Threshold: 0.5
Risk Management
Take Profit: 1.5%
Stop Loss: 1.0%
Trailing Stop: 1.0%
👁️ Visual Support
MA and oscillator color changes indicate directional bias
Clear chart markers show entry and exit points
Trailing stops and risk controls are transparently managed
🚀 Strategy Improvements & Uniqueness
In-wave flag avoids repeated entries within the same trend phase
Filtering based on time, volatility, and trend ensures higher-quality trades
Dynamic high/low tracking allows precise trailing stop placement
Fully rule-based execution reduces emotional decision-making
💡 Inspirations & Attribution
This strategy is inspired by the excellent concept from:
ChartPrime – “Moving Average Shift”
It expands on the original idea with advanced trade filters and trailing logic.
Source reference:
📌 Summary
The Moving Average Shift WaveTrend Strategy offers a rule-based, reliable approach to trend trading. By combining trend and momentum filters with robust risk controls, it provides a consistent framework suitable for various market conditions and trading styles.
⚠️ Disclaimer
This script is for educational purposes only. Trading involves risk. Always use proper backtesting and risk evaluation before applying in live markets.

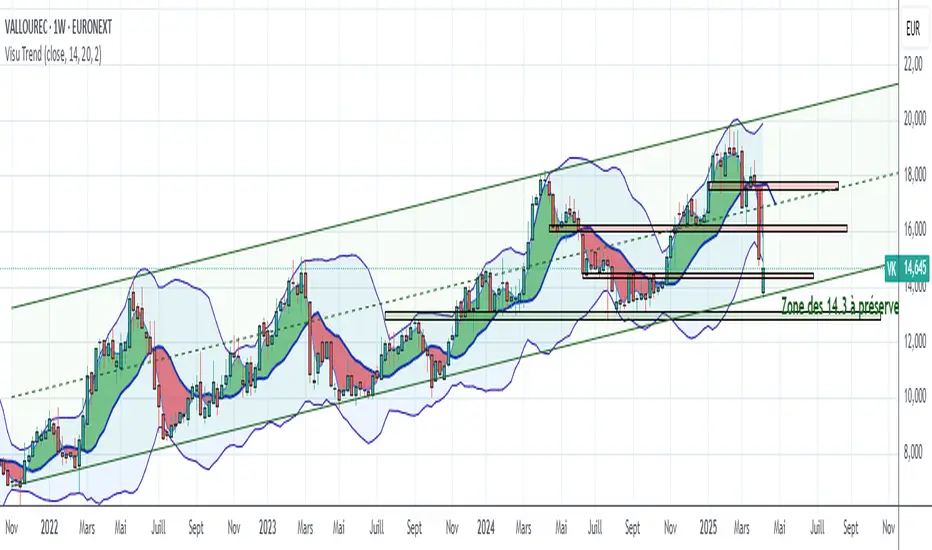
Visualisation tendancesThis script allows you to visualize the current trend of a financial asset.
It has two colors:
- Green for bullish phases
- Red for bearish phases
This allows you to instantly position yourself in the direction of the trend.
It also integrates Bollinger Bands, a volatility indicator.
This allows you to display two different indicators in a single indicator.
RTH and ETH RangesKey Functions :
Visualizes Regular Trading Hours (RTH) and Extended Trading Hours (ETH) price ranges
Tracks session highs, lows, and 50% levels where significant market reactions occur
Detects breakouts beyond previous session extremes
Trading Applications :
Exposes potential liquidity raids at session boundaries where smart money targets stop orders
Identifies critical price thresholds where institutional activity concentrates
Highlights divergences between RTH and ETH behavior that precede directional moves
Provides measurement of session volatility differences
Maps key price levels for objective entry and exit parameters
Reveals market dynamics at session transitions where institutional positioning changes

SL - 4 EMAs, 2 SMAs & Crossover SignalsThis TradingView Pine Script code is built for day traders, especially those trading crypto on a 1‑hour chart. In simple words, the script does the following:
Calculates Moving Averages:
It computes four exponential moving averages (EMAs) and two simple moving averages (SMAs) based on the closing price (or any price you select). Each moving average uses a different time period that you can adjust.
Plots Them on Your Chart:
The EMAs and SMAs are drawn on your chart in different colors and line thicknesses. This helps you quickly see the short-term and long-term trends.
Generates Buy and Sell Signals:
Buy Signal: When the fastest EMA (for example, a 10-period EMA) crosses above a slightly slower EMA (like a 21-period EMA) and the four EMAs are in a bullish order (meaning the fastest is above the next ones), the script will show a "BUY" label on the chart.
Sell Signal: When the fastest EMA crosses below the second fastest EMA and the four EMAs are lined up in a bearish order (the fastest is below the others), it displays a "SELL" label.
In essence, the code is designed to help you spot potential entry and exit points based on the relationships between multiple moving averages, which work as trend indicators. This makes it easier to decide when to trade on your 1‑hour crypto chart.

Dirty Market IndexThis indicator is designed to out an index displaying the level of dirtiness in market.
This level is defined by:
Sum of shadow lengths of last n candles (n is input and user can change it, it's 100 by default)
divided by
Sum of full candle bodies of last n candles (high - low)
This factor indicates how many percents of the market movement has been placed in shadows of candles, the higher this number, the dirtier market would be.
EMA & MA Crossover StrategyGuys, you asked, we did. Strategy for crossing moving averages .
The Moving Average Crossover trading strategy is possibly the most popular
trading strategy in the world of trading. First of them were written in the
middle of XX century, when commodities trading strategies became popular.
This strategy is a good example of so-called traditional strategies.
Traditional strategies are always long or short. That means they are never
out of the market. The concept of having a strategy that is always long or
short may be scary, particularly in today’s market where you don’t know what
is going to happen as far as risk on any one market. But a lot of traders
believe that the concept is still valid, especially for those of traders who
do their own research or their own discretionary trading.
This version uses crossover of moving average and its exponential moving average.
Strategy parameters:
Take Profit % - when it receives the opposite signal
Stop Loss % - when it receives the opposite signal
Current Backtest:
Account: 1000$
Trading size: 0.01
Commission: 0.05%
WARNING:
- For purpose educate only
- This script to change bars colors.

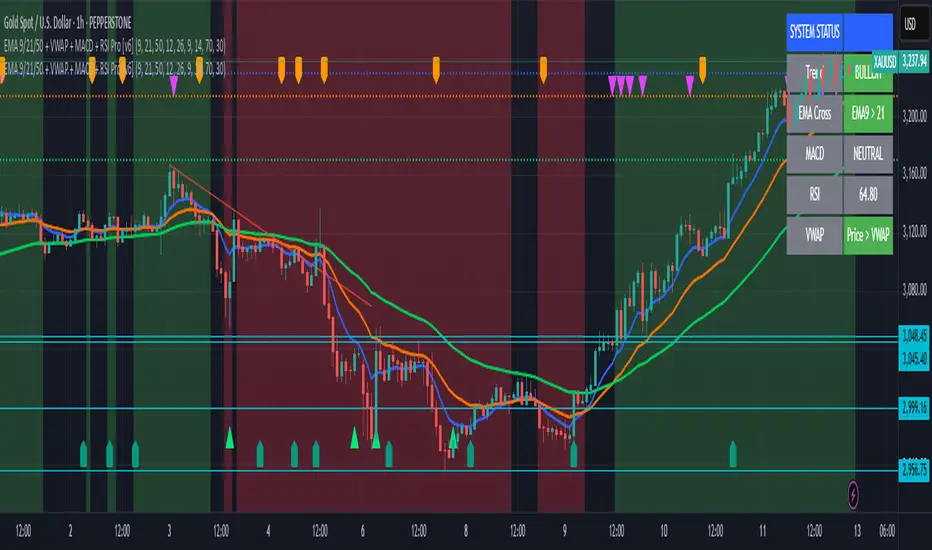
EMA 9/21/50 + VWAP + MACD + RSI Pro [v6]Overview:
A powerful multi-indicator tool combining Exponential Moving Averages (EMA 9, 21, 50), Volume-Weighted Average Price (VWAP), Moving Average Convergence Divergence (MACD), and Relative Strength Index (RSI) into a single, easy-to-read system. Designed for traders who want a clean, all-in-one dashboard for trend analysis, momentum confirmation, and overbought/oversold conditions.
Key Features:
1. Triple EMA System (9, 21, 50)
Identifies short-term and medium-term trends.
Bullish Signal: EMA 9 > EMA 21 > EMA 50 (Green Highlight)
Bearish Signal: EMA 9 < EMA 21 < EMA 50 (Red Highlight)
Helps confirm trend direction and potential reversals.
2. VWAP (Volume-Weighted Average Price)
Tracks intraday fair value price based on volume.
Bullish: Price above VWAP (Green)
Bearish: Price below VWAP (Red)
3. MACD (Standard 12, 26, 9 Settings)
Shows momentum shifts.
Bullish: MACD line > Signal line (Green)
Bearish: MACD line < Signal line (Red)
Histogram confirms strength of momentum.
4. RSI (14-Period Default)
Identifies overbought (>70) and oversold (<30) conditions.
Red: Overbought (Potential Reversal)
Green: Oversold (Potential Bounce)
5. Signal Dashboard (Top-Right Table)
Real-time summary of all indicators in one place.
Color-coded for quick interpretation (Green = Bullish, Red = Bearish).
How to Use This Indicator?
✅ Trend Confirmation:
Trade in the direction of EMA alignment (9 > 21 > 50 for uptrends).
Use VWAP as dynamic support/resistance.
✅ Momentum Entries:
Look for MACD crossovers while RSI is not extreme.
Avoid buying when RSI > 70 or selling when RSI < 30 (unless strong trend).
✅ Mean Reversion:
Fade extreme RSI readings (overbought/oversold) when price is at key levels.
Who Is This For?
✔ Swing Traders – EMA + MACD combo for trend-following.
✔ Day Traders – VWAP + EMA for intraday bias.
✔ RSI Traders – Clear overbought/oversold signals.
Settings Customization:
Adjust EMA lengths, RSI periods, and MACD settings as needed.
Toggle VWAP visibility on/off.
Why Use This Script?
📌 All-in-One: No need for multiple indicators cluttering your chart.
📌 Visual Clarity: Color-coded signals for quick decision-making.
📌 Flexible: Works on any timeframe (1M, 5M, 1H, Daily, etc.).
Install now and enhance your trading strategy with a professional-grade multi-indicator system!
Not a financial advice. Use at your own discretion and always apply risk management
SR Intensity CandleThis is a very simple script intended to find just what the title says, "Intensity Candles" is what i am calling them. A bullish intensity candle is taking the low of the previous candle and the close is above the previous candle high. Bearish intensity candle is the opposite, a candle that takes the high of the previous candle and the close is below the low of the previous candle.
Alternatively, if a "bullish" intensity candle is the mitigated and price pushes below, you can expect a back test short of the "bullish" intensity candle. They will act as SR zones for the future price action.
The BEST and most ideal spot for the intensity candles to happen is the see a bullish candle at the low of a move and a bearish candle at the highs indicating strong movement for reversal.

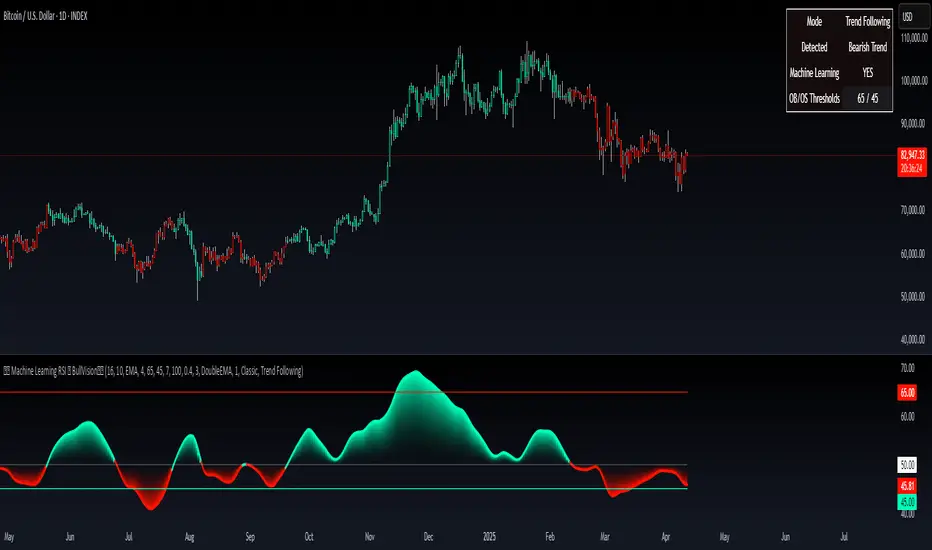
Machine Learning RSI ║ BullVisionOverview:
Introducing the Machine Learning RSI with KNN Adaptation – a cutting-edge momentum indicator that blends the classic Relative Strength Index (RSI) with machine learning principles. By leveraging K-Nearest Neighbors (KNN), this indicator aims at identifying historical patterns that resemble current market behavior and uses this context to refine RSI readings with enhanced sensitivity and responsiveness.
Unlike traditional RSI models, which treat every market environment the same, this version adapts in real-time based on how similar past conditions evolved, offering an analytical edge without relying on predictive assumptions.
Key Features:
🔁 KNN-Based RSI Refinement
This indicator uses a machine learning algorithm (K-Nearest Neighbors) to compare current RSI and price action characteristics to similar historical conditions. The resulting RSI is weighted accordingly, producing a dynamically adjusted value that reflects historical context.
📈 Multi-Feature Similarity Analysis
Pattern similarity is calculated using up to five customizable features:
RSI level
RSI momentum
Volatility
Linear regression slope
Price momentum
Users can adjust how many features are used to tailor the behavior of the KNN logic.
🧠 Machine Learning Weight Control
The influence of the machine learning model on the final RSI output can be fine-tuned using a simple slider. This lets you blend traditional RSI and machine learning-enhanced RSI to suit your preferred level of adaptation.
🎛️ Adaptive Filtering
Additional smoothing options (Kalman Filter, ALMA, Double EMA) can be applied to the RSI, offering better visual clarity and helping to reduce noise in high-frequency environments.
🎨 Visual & Accessibility Settings
Custom color palettes, including support for color vision deficiencies, ensure that trend coloring remains readable for all users. A built-in neon mode adds high-contrast visuals to improve RSI visibility across dark or light themes.
How It Works:
Similarity Matching with KNN:
At each candle, the current RSI and optional market characteristics are compared to historical bars using a KNN search. The algorithm selects the closest matches and averages their RSI values, weighted by similarity. The more similar the pattern, the greater its influence.
Feature-Based Weighting:
Similarity is determined using normalized values of the selected features, which gives a more refined result than RSI alone. You can choose to use only 1 (RSI) or up to all 5 features for deeper analysis.
Filtering & Blending:
After the machine learning-enhanced RSI is calculated, it can be optionally smoothed using advanced filters to suppress short-term noise or sharp spikes. This makes it easier to evaluate RSI signals in different volatility regimes.
Parameters Explained:
📊 RSI Settings:
Set the base RSI length and select your preferred smoothing method from 10+ moving average types (e.g., EMA, ALMA, TEMA).
🧠 Machine Learning Controls:
Enable or disable the KNN engine
Select how many nearest neighbors to compare (K)
Choose the number of features used in similarity detection
Control how much the machine learning engine affects the RSI calculation
🔍 Filtering Options:
Enable one of several advanced smoothing techniques (Kalman Filter, ALMA, Double EMA) to adjust the indicator’s reactivity and stability.
📏 Threshold Levels:
Define static overbought/oversold boundaries or reference dynamically adjusted thresholds based on historical context identified by the KNN algorithm.
🎨 Visual Enhancements:
Select between trend-following or impulse coloring styles. Customize color palettes to accommodate different types of color blindness. Enable neon-style effects for visual clarity.
Use Cases:
Swing & Trend Traders
Can use the indicator to explore how current RSI readings compare to similar market phases, helping to assess trend strength or potential turning points.
Intraday Traders
Benefit from adjustable filters and fast-reacting smoothing to reduce noise in shorter timeframes while retaining contextual relevance.
Discretionary Analysts
Use the adaptive OB/OS thresholds and visual cues to supplement broader confluence zones or market structure analysis.
Customization Tips:
Higher Volatility Periods: Use more neighbors and enable filtering to reduce noise.
Lower Volatility Markets: Use fewer features and disable filtering for quicker RSI adaptation.
Deeper Contextual Analysis: Increase KNN lookback and raise the feature count to refine pattern recognition.
Accessibility Needs: Switch to Deuteranopia or Monochrome mode for clearer visuals in specific color vision conditions.
Final Thoughts:
The Machine Learning RSI combines familiar momentum logic with statistical context derived from historical similarity analysis. It does not attempt to predict price action but rather contextualizes RSI behavior with added nuance. This makes it a valuable tool for those looking to elevate traditional RSI workflows with adaptive, research-driven enhancements.
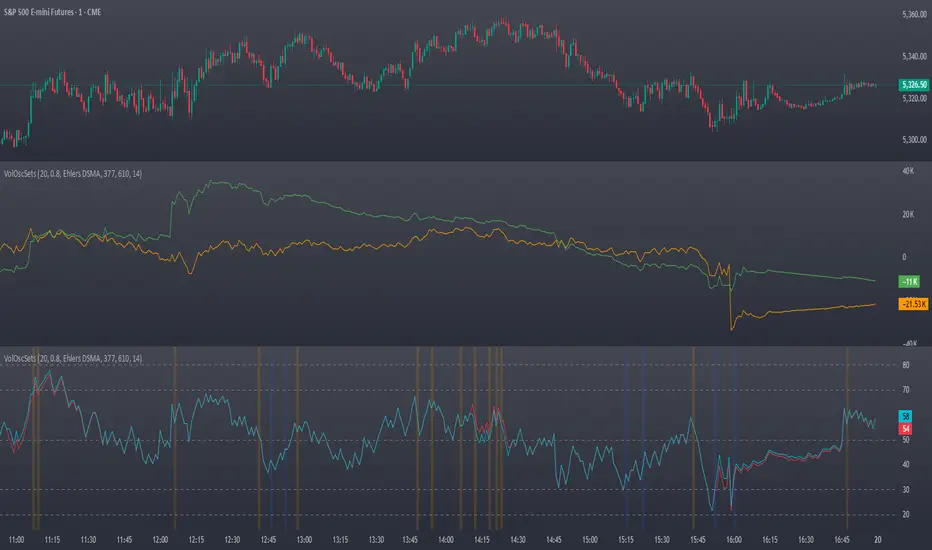
OBV & AD Oscillators with Dual Smoothing OptionsOn Balance Volume and Accumulation/Distribution
Overlaid into 1 and then some,
Now it is an oscillator!
3 customizable moving average types
- Ehlers Deviation Scaled Moving Average
- Volatility Dynamic Moving Average
- Simple Moving Average
Each with customizable periods
And with the ability to overlay a second set too
Default Settings have a longer period MA of 377 using Ehlers DSMA to better capture the standard view of OBV and A/D.
An extra overlay of a shorter period using a Volatility DMA uses Average True Range with its own custom settings, seeks to act more as an RSI
Multi-timeframe Moving Average Overlay w/ Sentiment Table🔍 Overview
This indicator overlays selected moving averages (MA) from multiple timeframes directly onto the chart and provides a dynamic sentiment table that summarizes the relative bullish or bearish alignment of short-, mid-, and long-term moving averages.
It supports seven moving average types — including traditional and advanced options like DEMA, TEMA, and HMA — and provides visual feedback via table highlights and alerts when strong momentum alignment is detected.
This tool is designed to support traders who rely on multi-timeframe analysis for trend confirmation, momentum filtering, and high-probability entry timing.
⚙️ Core Features
Multi-Timeframe MA Overlay:
Plot moving averages from 1-minute, 5-minute, 1-hour, 1-day, 1-week, and 1-month timeframes on the same chart for visual trend alignment.
Customizable MA Type:
Choose from:
EMA (Exponential Moving Average)
SMA (Simple Moving Average)
DEMA (Double EMA)
TEMA (Triple EMA)
WMA (Weighted MA)
VWMA (Volume-Weighted MA)
HMA (Hull MA)
Adjustable MA Length:
Change the length of all moving averages globally to suit your strategy (e.g. 9, 21, 50, etc.).
Sentiment Table:
Visually track trend sentiment across four key zones (Hourly, Daily, Weekly, Monthly). Each is based on the relative positioning of short-term and long-term MAs.
Sentiment Symbols Explained:
↑↑↑: Strong bullish momentum (short-term MAs stacked above longer-term MAs)
↑↑ / ↑: Moderate bullish bias
↓↓↓: Strong bearish momentum
↓↓ / ↓: Moderate bearish bias
Table Customization:
Choose the table’s position on the chart (bottom right, top right, bottom left, top left).
Style Customization:
Display MA lines as standard Line or Stepline format.
Color Customization:
Individual colors for each timeframe MA line for visual clarity.
Built-in Alerts:
Receive alerts when strong bullish (↑↑↑) or bearish (↓↓↓) sentiment is detected on any timeframe block.
📈 Use Cases
1. Trend Confirmation:
Use sentiment alignment across multiple timeframes to confirm the overall trend direction before entering a trade.
2. Entry Timing:
Wait for a shift from neutral to strong bullish or bearish sentiment to time entries during pullbacks or breakouts.
3. Momentum Filtering:
Only trade in the direction of the dominant multi-timeframe trend. For example, ignore long setups when all sentiment blocks show bearish alignment.
4. Swing & Intraday Scalping:
Use hourly and daily sentiment zones for swing trades, or rely on 1m/5m MAs for precise scalping decisions in fast-moving markets.
5. Strategy Layering:
Combine this overlay with support/resistance, RSI, or volume-based signals to enhance decision-making with multi-timeframe context.
⚠️ Important Notes
Lower-timeframe values (1m, 5m) may appear static on higher-timeframe charts due to resolution limits in TradingView. This is expected behavior.
The indicator uses MA stacking, not crossover events, to determine sentiment.

Fractal Pattern AnalysisFractal Pattern Key Elements and How to Read Them
1. Williams Fractals (Triangle Markers)
Red Triangles Pointing Down: Bearish fractals - potential resistance points and selling opportunities
Green Triangles Pointing Up: Bullish fractals - potential support points and buying opportunities
When to Act: Look for bullish fractals forming during uptrends and bearish fractals during downtrends
2. Moving Averages
Yellow Line (20 EMA): Short-term trend
Blue Line (50 EMA): Medium-term trend
Red Line (200 EMA): Long-term trend
Interpretation: When shorter MAs cross above longer MAs, it's bullish; when they cross below, it's bearish
Key Signal: The alignment of all three MAs (stacked in order) confirms a strong trend
3. Background Color
Green Background: Uptrend (all MAs aligned bullishly)
Red Background: Downtrend (all MAs aligned bearishly)
Yellow Background: Sideways/neutral market (MAs not clearly aligned)
4. Market Structure Markers (Small Circles)
Green Circles: Higher highs and higher lows (bullish structure)
Red Circles: Lower highs and lower lows (bearish structure)
Pattern Recognition: Multiple green circles suggest continuing uptrend; multiple red circles suggest continuing downtrend
5. Reversal Diamonds ("Rev" Markers)
Yellow Diamonds: Potential trend reversal points
Usage: These mark where the current trend might be changing direction
Confirmation: Wait for price to close beyond the diamond before acting
6. Bollinger Bands (Blue Lines with Fill)
Middle Band: 20-period SMA
Upper/Lower Bands: Volatility channels
Signals: Price touching upper band in uptrend is strength; touching lower band in downtrend is weakness
Squeeze: When bands narrow, expect a volatility breakout soon
7. Status Table (Top Right)
Shows current trend, volume direction, and overall signal at a glance
"BUY" signal appears when multiple bullish conditions align
"SELL" signal appears when multiple bearish conditions align

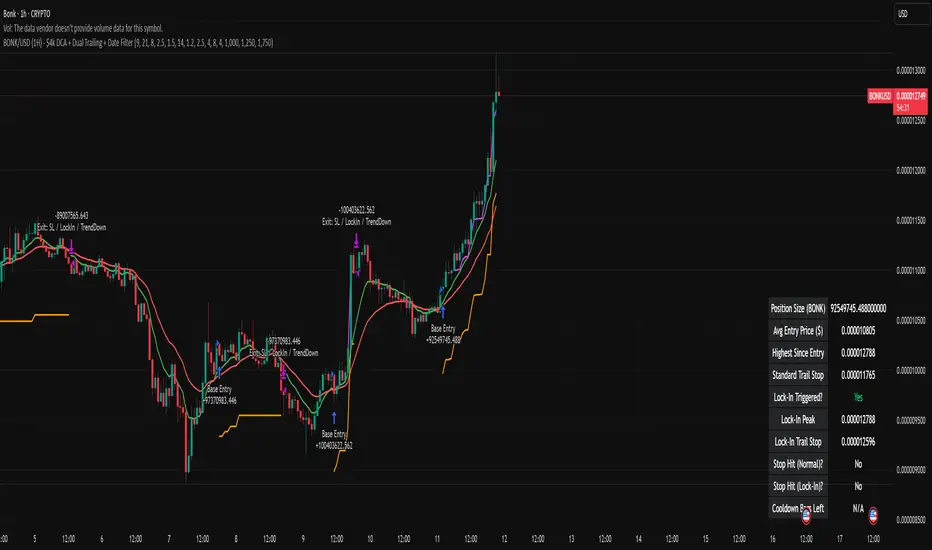
BONK/USD (1H) - $4k DCA + Dual Trailing + Date FilterThis strategy trades BONK/USD on the 1-hour chart, employing a Dollar-Cost Averaging (DCA) approach for long entries.
It initiates a Base Order when a faster Exponential Moving Average (EMA) crosses above a slower one (signaling a potential uptrend, default 9/21 EMA). If the price declines after entry, it can automatically place up to two additional Safety Orders at predetermined lower levels, calculated using either Average True Range (ATR) volatility or fixed percentage drops.
Exits are triggered by a trend reversal (EMA crossunder) or a dual trailing stop-loss mechanism, which includes both a standard trail and a tighter profit-locking trail activated after reaching a certain profit target.
The strategy includes user-configurable inputs for all key parameters (EMAs, order sizes, trailing stops, SO spacing) and an optional date filter to limit backtesting or execution to a specific period. It also generates alerts formatted for potential automation with platforms like 3Commas.
Market Structure - HH, HL, LH, LL with Trendlines & AlertsMarket Structure Script – HH, HL, LH, LL with Trendlines & Alerts
This Pine Script is designed to help identify key market structure patterns such as Higher Highs (HH), Higher Lows (HL), Lower Highs (LH), and Lower Lows (LL) on price charts. It also draws trendlines connecting the respective swing points and provides alerts when these important price patterns occur.
Key Features:
Swing High and Low Detection:
The script uses the ta.pivothigh and ta.pivotlow functions to identify significant swing highs and swing lows based on the pivot length (pivotLen). These points mark local peaks and troughs in the price action.
Dynamic Pivot Length:
The script adjusts the pivotLen (which defines the number of bars used to calculate swing points) based on the current timeframe of the chart. For example, for a 15-minute chart, it uses a pivot length of 5 bars, while for a daily chart, it uses 10 bars. This dynamic adjustment ensures that the script works across different timeframes.
Higher Highs (HH), Higher Lows (HL), Lower Highs (LH), Lower Lows (LL):
Higher High (HH): Identifies a price peak that is higher than the previous swing high, indicating an uptrend.
Higher Low (HL): Identifies a price trough that is higher than the previous swing low, supporting the idea of an ongoing uptrend.
Lower High (LH): Identifies a price peak that is lower than the previous swing high, suggesting a potential reversal or downtrend.
Lower Low (LL): Identifies a price trough that is lower than the previous swing low, indicating a downtrend.
Trendlines:
For each identified Higher High, Higher Low, Lower High, or Lower Low, the script automatically draws a trendline connecting the corresponding swing points. These trendlines provide a visual representation of the market’s price structure, showing support and resistance levels.
Labels:
The script places labels on the chart next to the respective swing points. These labels mark whether the point is a Higher High (HH), Higher Low (HL), Lower High (LH), or Lower Low (LL). This helps traders easily visualize the price pattern at a glance.
Alerts:
Alert conditions are set for when a Higher High (HH), Higher Low (HL), Lower High (LH), or Lower Low (LL) is detected. Users can set up alerts to be notified whenever one of these key market structure patterns forms. Alerts are an essential feature for traders who want to act quickly when important trend changes are happening.

Stochastic Overlay - Regression Channel (Zeiierman)█ Overview
The Stochastic Overlay – Regression Channel (Zeiierman) is a next-generation visualization tool that transforms the traditional Stochastic Oscillator into a dynamic price-based overlay.
Instead of leaving momentum trapped in a lower subwindow, this indicator projects the Stochastic oscialltor directly onto price itself — allowing traders to visually interpret momentum, overbought/oversold conditions, and market strength without ever taking their eyes off price action.
⚪ In simple terms:
▸ The Bands = The Stochastic Oscillator — but on price.
▸ The Midline = Stochastic 50 level
▸ Upper Band = Stochastic Overbought Threshold
▸ Lower Band = Stochastic Oversold Threshold
When the price moves above the midline → it’s the same as the oscillator moving above 50
When the price breaks above the upper band → it’s the same as Stochastic entering overbought.
When the price reaches the lower band →, think of it like Stochastic being oversold.
This makes market conditions visually intuitive. You’re literally watching the oscillator live on the price chart.
█ How It Works
The indicator layers 3 distinct technical elements into one clean view:
⚪ Stochastic Momentum Engine
Tracks overbought/oversold conditions and directional strength using:
%K Line → Momentum of price
%D Line → Smoothing filter of %K
Overbought/Oversold Bands → Highlight potential reversal zones
⚪ Volatility Adaptive Bands
Dynamic bands plotted above and below price using:
ATR * Stochastic Scaling → Creates wider bands during volatile periods & tighter bands in calm conditions
Basis → Moving average centerline (EMA, SMA, WMA, HMA, RMA selectable)
This means:
→ In strong trends: Bands expand
→ In consolidations: Bands contract
⚪ Regression Channel
Projects trend direction with different models:
Logarithmic → Captures non-linear growth (perfect for crypto or exponential stocks)
Linear → Classic regression fit
Adaptive → Dynamically adjusts sensitivity
Leading → Projects trend further ahead (aggressive mode)
Channels include:
Midline → Fair value trend
Upper/Lower Bounds → Deviation-based support/resistance
⚪ Heatmap - Bull & Bear Power Strength
Visual heatmeter showing:
% dominance of bulls vs bears (based on close > or < Band Basis)
Automatic normalization regardless of timeframe
Table display on-chart for quick visual insight
Dynamic highlighting when extreme levels are reached
⚪ Trend Candlestick Coloring
Bars auto-color based on trend filter:
Above Basis → Bullish Color
Below Basis → Bearish Color
█ How to Use
⚪ Trend Trading
→ Use Band direction + Regression Channel to identify trend alignment
→ Longs favored when price holds above the Basis
→ Shorts favored when price stays below the Basis
→ Use the Bull & Bear heatmap to asses if the bulls or the bears are in control.
⚪ Mean Reversion
→ Look for price to interact with Upper or Lower Band extremes
→ Stochastic reaching OB/OS zones further supports reversals
⚪ Momentum Confirmation
→ Crossovers between %K and %D can confirm continuation or divergence signals
→ Especially powerful when happening at band boundaries
⚪ Strength Heatmap
→ Quickly visualize current buyer vs seller control
→ Sharp spikes in Bull Power = Aggressive buying
→ Sharp spikes in Bear Power = Heavy selling pressure
█ Why It Useful
This is not a typical Stochastic or regression tool. The tool is designed for traders who want to:
React dynamically to price volatility
Map momentum into volatility context
Use adaptive regression channels across trend styles
Visualize bull vs bear power in real-time
Follow trends with built-in reversal logic
█ Settings
Stochastic Settings
Stochastic Length → Period of calculation. Higher = smoother, Lower = faster signals.
%K Smoothing → Smooths the Stochastic line itself.
%D Smoothing → Smooths the moving average of %K for slower signals.
Stochastic Band
Band Length → Length of the Moving Average Basis.
Volatility Multiplier → Controls band width via ATR scaling.
Band Type → Choose MA type (EMA, SMA, WMA, HMA, RMA).
Regression Channel
Regression Type → Logarithmic / Linear / Adaptive / Leading.
Regression Length → Number of bars for regression calculation.
Heatmap Settings
Heatmap Length → Number of bars to calculate bull/bear dominance.
-----------------
Disclaimer
The content provided in my scripts, indicators, ideas, algorithms, and systems is for educational and informational purposes only. It does not constitute financial advice, investment recommendations, or a solicitation to buy or sell any financial instruments. I will not accept liability for any loss or damage, including without limitation any loss of profit, which may arise directly or indirectly from the use of or reliance on such information.
All investments involve risk, and the past performance of a security, industry, sector, market, financial product, trading strategy, backtest, or individual's trading does not guarantee future results or returns. Investors are fully responsible for any investment decisions they make. Such decisions should be based solely on an evaluation of their financial circumstances, investment objectives, risk tolerance, and liquidity needs.
