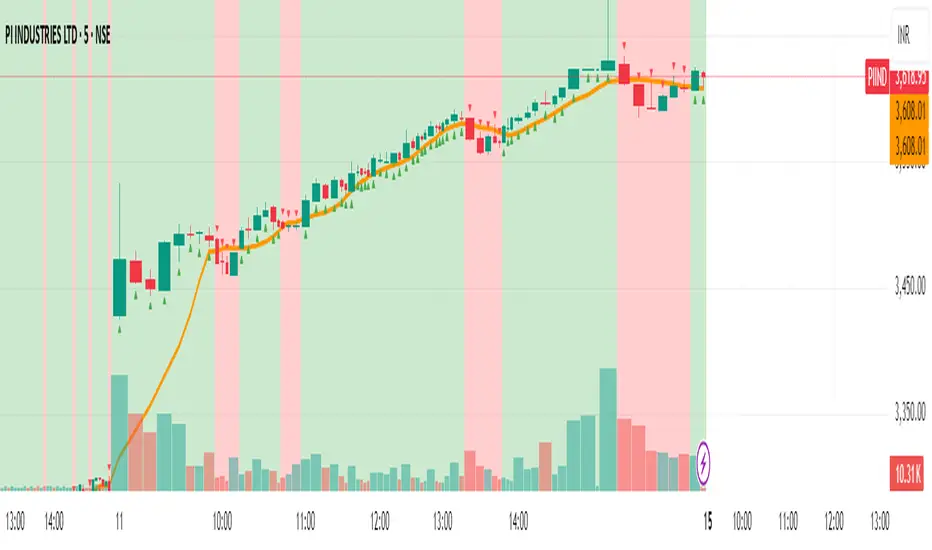
Candle vs 8 SMA - Red & Green📈 Script Name: Candle vs 8 SMA – Red & Green
This TradingView Pine Script visually compares each candle's close price to the 8-period Simple Moving Average (SMA) and highlights the chart accordingly:
🔍 What It Does:
Calculates the 8-period SMA
sma8 = ta.sma(close, 8)
This line computes the average of the last 8 closing prices to smooth out short-term fluctuations.
Plots the SMA Line
Orange line shown on the chart.
Helps you visually track the short-term trend.
Identifies Candle Position
candleAbove: true if the candle’s close is above the SMA
candleBelow: true if the candle’s close is below the SMA
Highlights Background
If the close is above the 8 SMA → Green background (indicating bullish behavior)
If the close is below the 8 SMA → Red background (indicating bearish behavior)
Plots Triangle Shapes
Green triangle below candle when above the SMA
Red triangle above candle when below the SMA
Helps quickly identify conditions at a glance
🧠 Why Use It?
This script is useful for:
Intraday trend confirmation
Spotting momentum shifts
Visual clarity on how price reacts to a dynamic support/resistance (SMA)
Aiding quick decisions for scalping or intraday trades
Индикаторы и стратегии
Daily Borders with Weekday Labels[fitfatq]Indicator Overview
This indicator displays daily vertical border lines and the previous day’s weekday label on intraday charts (i.e., charts with a timeframe lower than Daily). It draws a vertical line at the start of each new trading day and places a label displaying the previous day’s weekday (e.g., Monday) at the horizontal midpoint between the previous and the current day. Users can customize various visual aspects such as the separator line style and width, label style, text color, and text size. Additionally, the indicator offers an option to fix the label’s Y coordinate at a specified price level to prevent it from being overlapped by candlesticks.
Parameter Details
Use Fixed Weekday Label Y Coordinate
Type: Boolean
Default: false
Description: When enabled, the weekday label’s vertical position will be fixed at a specified price level (see next parameter). Otherwise, the label’s Y position is determined dynamically (typically based on the current bar’s low minus 3 ticks).
Fixed Weekday Label Y Coordinate (price)
Type: Float
Default: 130.0
Description:
This parameter sets the fixed price level at which the weekday label will be displayed if the "Use Fixed Weekday Label Y Coordinate" option is enabled. Please input a value that corresponds to your chart’s price scale (e.g., 130.50). Note: In charts with high price levels (for example, stocks trading at 3000 or above), it is recommended to set this value to 3000 or above. The higher the value, the closer the label will appear to the candlesticks.
Separator Line Style
Type: String (Options: "Solid", "Dotted", "Dashed")
Default: "Dotted"
Description: Specifies the style of the vertical separator line drawn at the start of each new day. "Solid" displays a continuous line, "Dotted" shows a dotted line, and "Dashed" provides a dashed line.
Separator Line Width
Type: Integer
Default: 1
Description: Determines the thickness of the separator line. A higher number results in a thicker line; the minimum value is 1.
Label Style
Type: String (Options: "None", "Label Up", "Label Down", "Label Left", "Label Right", "Label Center")
Default: "None"
Description: Sets the built-in style for the weekday label. "None" means no background or border (plain text only), while other options apply predefined visual effects.
Text Color
Type: Color
Default: Black
Description: Determines the text color of the weekday label.
Label Text Size
Type: String (Options: "Tiny", "Small", "Normal", "Large", "Huge")
Default: "Normal"
Description: Specifies the text size of the weekday label. Adjust according to preference to ensure the label is readable.
Usage Summary
How It Works:
The indicator detects the start of a new trading day using a change in the daily timeframe (via ta.change(time("D"))). When a new day begins, it draws a vertical separator line at the first bar of that day. If previous day data is available, the indicator calculates the horizontal midpoint between the start of the previous day and the current day and displays the previous day’s weekday label at that position. If the fixed Y coordinate option is enabled, the label is drawn at the specified price level; otherwise, it is positioned relative to the current bar’s low.
Customization:
Users can adjust all visual aspects, including the line style and width as well as the label style, text color, and text size. The fixed Y coordinate option allows the label’s vertical position to remain constant, which helps prevent overlapping with price bars.
Chart Requirement:
This indicator only operates on intraday charts (timeframes lower than Daily) and will not display on Daily or higher timeframe charts.
License
This indicator is released under the Mozilla Public License 2.0. Please credit the original author (fitfatq) when using or sharing this script.

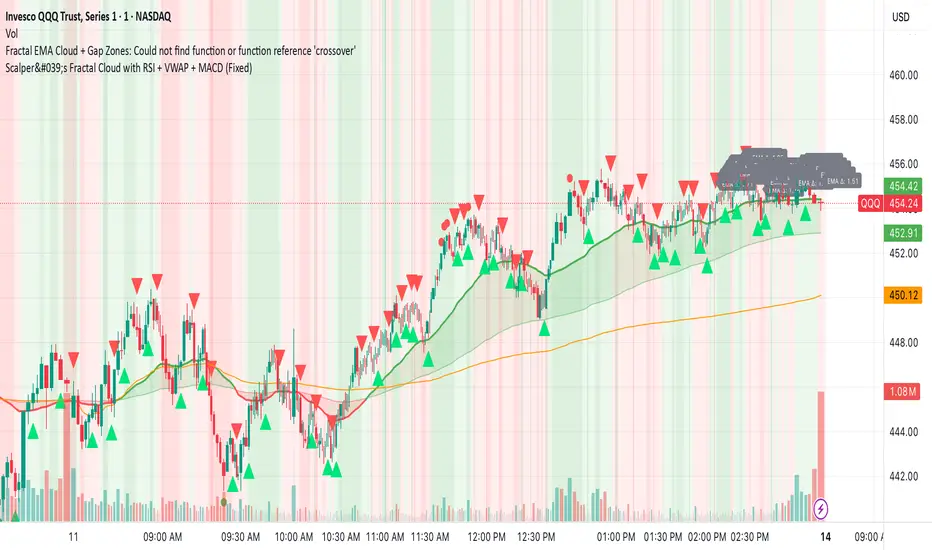
Scalper's Fractal Cloud with RSI + VWAP + MACD (Fixed)Scalper’s Fractal Confluence Dashboard
1. Purpose of the Indicator
This TradingView indicator script provides a high-confluence setup for scalping and day trading. It blends momentum indicators (RSI, MACD), trend bias tools (EMA Cloud, VWAP), and structure (fractal swings, gap zones) to help confirm precise entries and exits.
2. Components of the Indicator
- EMA Cloud (50 & 200 EMA): Trend bias – green means bullish, red means bearish. Avoid longs under red cloud.
- VWAP: Institutional volume anchor. Ideal entries are pullbacks to VWAP in direction of trend.
- Gap Zones: Shows open-air zones (white space) where price can move fast. Used to anticipate momentum moves.
- ZigZag Swings: Marks structural pivots (highs/lows) – useful for stop placement and range anticipation.
- MACD Histogram: Shows bullish or bearish momentum via background color.
- RSI: Overbought (>70) or oversold (<30) warnings. Good for exits or countertrend reversion plays.
- EMA Spread Label: Quick view of momentum strength. Wide spread = strong trend.
3. Scalping Entry Checklist
Before entering a trade, confirm these conditions:
• • Bias: EMA cloud color supports trade direction
• • Price is above/below VWAP (confirming institutional flow)
• • MACD histogram matches direction (green for long, red for short)
• • RSI not at extreme (unless you’re fading trend)
• • If entering gap zone, expect fast move
• • Recent swing high/low nearby for target or stop
4. Risk & Sizing Guidelines
Risk 1–2% of account per trade. Place stop below recent swing low (for longs) or high (for shorts). Use fractional sizing near VWAP or white space zones for scalping reversals.
5. Daily Trade Journal Template
- Date:
- Ticker:
- Setup Type (VWAP pullback, Gap Break, EMA reversion):
- Entry Time:
- Bias (Green/Red Cloud):
- RSI Level / MACD Reading:
- Stop Loss:
- Target:
- Result (P/L):
- What I Did Well:
- What Needs Work:
financial_history_utilsLibrary "financial_history_utils"
get_fq_value_n_quarters_ago(symbol, financial_id, n)
Parameters:
symbol (string)
financial_id (string)
n (int)

20 EMA and 50 EMA with Dynamic Coloringthis is my indictor to do swing trend when price is above 20 ema and 50ema then i looking for only long.

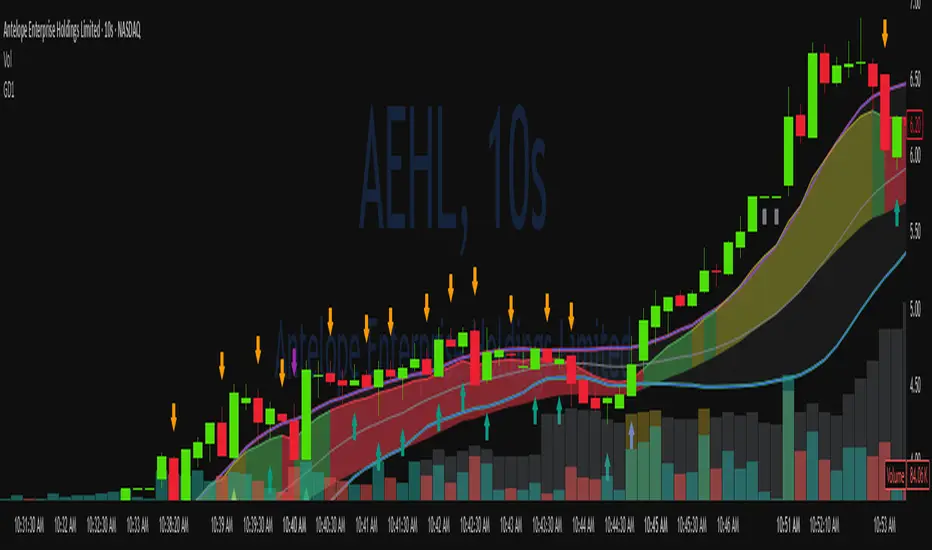
Green*DiamondGreen*Diamond (GD1)
Unleash Dynamic Trading Signals with Volatility and Momentum
Overview
GreenDiamond is a versatile overlay indicator designed for traders seeking actionable buy and sell signals across various markets and timeframes. Combining Volatility Bands (VB) bands, Consolidation Detection, MACD, RSI, and a unique Ribbon Wave, it highlights high-probability setups while filtering out noise. With customizable signals like Green-Yellow Buy, Pullback Sell, and Inverse Pullback Buy, plus vibrant candle and volume visuals, GreenDiamond adapts to your trading style—whether you’re scalping, day trading, or swing trading.
Key Features
Volatility Bands (VB): Plots dynamic upper and lower bands to identify breakouts or reversals, with toggleable buy/sell signals outside consolidation zones.
Consolidation Detection: Marks low-range periods to avoid choppy markets, ensuring signals fire during trending conditions.
MACD Signals: Offers flexible buy/sell conditions (e.g., cross above signal, above zero, histogram up) with RSI divergence integration for precision.
RSI Filter: Enhances signals with customizable levels (midline, oversold/overbought) and bullish divergence detection.
Ribbon Wave: Visualizes trend strength using three EMAs, colored by MACD and RSI for intuitive momentum cues.
Custom Signals: Includes Green-Yellow Buy, Pullback Sell, and Inverse Pullback Buy, with limits on consecutive signals to prevent overtrading.
Candle & Volume Styling: Blends MACD/RSI colors on candles and scales volume bars to highlight momentum spikes.
Alerts: Set up alerts for VB signals, MACD crosses, Green*Diamond signals, and custom conditions to stay on top of opportunities.
How It Works
Green*Diamond integrates multiple indicators to generate signals:
Volatility Bands: Calculates bands using a pivot SMA and standard deviation. Buy signals trigger on crossovers above the lower band, sell signals on crossunders below the upper band (if enabled).
Consolidation Filter: Suppresses signals when candle ranges are below a threshold, keeping you out of flat markets.
MACD & RSI: Combines MACD conditions (e.g., cross above signal) with RSI filters (e.g., above midline) and optional volume spikes for robust signals.
Custom Logic: Green-Yellow Buy uses MACD bullishness, Pullback Sell targets retracements, and Inverse Pullback Buy catches reversals after downmoves—all filtered to avoid consolidation.
Visuals: Ribbon Wave shows trend direction, candles blend momentum colors, and volume bars scale dynamically to confirm signals.
Settings
Volatility Bands Settings:
VB Lookback Period (20): Adjust to 10–15 for faster markets (e.g., 1-minute scalping) or 25–30 for daily charts.
Upper/Lower Band Multiplier (1.0): Increase to 1.5–2.0 for wider bands in volatile stocks like AEHL; decrease to 0.5 for calmer markets.
Show Volatility Bands: Toggle off to reduce chart clutter.
Use VB Signals: Enable for breakout-focused trades; disable to focus on Green*Diamond signals.
Consolidation Settings:
Consolidation Lookback (14): Set to 5–10 for small caps (e.g., AEHL) to catch quick consolidations; 20 for higher timeframes.
Range Threshold (0.5): Lower to 0.3 for stricter filtering in choppy markets; raise to 0.7 for looser signals.
MACD Settings:
Fast/Slow Length (12/26): Shorten to 8/21 for scalping; extend to 15/34 for swing trading.
Signal Smoothing (9): Reduce to 5 for faster signals; increase to 12 for smoother trends.
Buy/Sell Signal Options: Choose “Cross Above Signal” for classic MACD; “Histogram Up” for momentum plays.
Use RSI Div + MACD Cross: Enable for high-probability reversal signals.
RSI Settings:
RSI Period (14): Drop to 10 for 1-minute charts; raise to 20 for daily.
Filter Level (50): Set to 55 for stricter buys; 45 for sells.
Overbought/Oversold (70/30): Tighten to 65/35 for small caps; widen to 75/25 for indices.
RSI Buy/Sell Options: Select “Bullish Divergence” for reversals; “Cross Above Oversold” for momentum.
Color Settings:
Adjust bullish/bearish colors for visibility (e.g., brighter green/red for dark themes).
Border Thickness (1): Increase to 2–3 for clearer candle outlines.
Volume Settings:
Volume Average Length (20): Shorten to 10 for scalping; extend to 30 for swing trades.
Volume Multiplier (2.0): Raise to 3.0 for AEHL’s volume surges; lower to 1.5 for steady stocks.
Bar Height (10%): Increase to 15% for prominent bars; decrease to 5% to reduce clutter.
Ribbon Settings:
EMA Periods (10/20/30): Tighten to 5/10/15 for scalping; widen to 20/40/60 for trends.
Color by MACD/RSI: Disable for simpler visuals; enable for dynamic momentum cues.
Gradient Fill: Toggle on for trend clarity; off for minimalism.
Custom Signals:
Enable Green-Yellow Buy: Use for momentum confirmation; limit to 1–2 signals to avoid spam.
Pullback/Inverse Pullback % (50): Set to 30–40% for small caps; 60–70% for indices.
Max Buy Signals (1): Increase to 2–3 for active markets; keep at 1 for discipline.
Tips and Tricks
Scalping Small Caps (e.g., AEHL):
Use 1-minute charts with VB Lookback = 10, Consolidation Lookback = 5, and Volume Multiplier = 3.0 to catch $0.10–$0.20 moves.
Enable Green-Yellow Buy and Inverse Pullback Buy for quick entries; disable VB Signals to focus on Green*Diamond logic.
Pair with SMC+ green boxes (if you use them) for reversal confirmation.
Day Trading:
Try 5-minute charts with MACD Fast/Slow = 8/21 and RSI Period = 10.
Enable RSI Divergence + MACD Cross for high-probability setups; set Max Buy Signals = 2.
Watch for volume bars turning yellow to confirm entries.
Swing Trading:
Use daily charts with VB Lookback = 30, Ribbon EMAs = 20/40/60.
Enable Pullback Sell (60%) to exit after rallies; disable RSI Color for cleaner candles.
Check Ribbon Wave gradient for trend strength—bright green signals strong bulls.
Avoiding Noise:
Increase Consolidation Threshold to 0.7 on volatile days to skip false breakouts.
Disable Ribbon Wave or Volume Bars if the chart feels crowded.
Limit Max Buy Signals to 1 for disciplined trading.
Alert Setup:
In TradingView’s Alerts panel, select:
“GD Buy Signal” for standard entries.
“RSI Div + MACD Cross Buy” for reversals.
“VB Buy Signal” for breakout plays.
Set to “Once Per Bar Close” for confirmed signals; “Once Per Bar” for scalping.
Backtesting:
Replay on small caps ( Float < 5M, Price $0.50–$5) to test signals.
Focus on “GD Buy Signal” with yellow volume bars and green Ribbon Wave.
Avoid signals during gray consolidation squares unless paired with RSI Divergence.
Usage Notes
Markets: Works on stocks, forex, crypto, and indices. Best for volatile assets (e.g., small-cap stocks, BTCUSD).
Timeframes: Scalping (1–5 minutes), day trading (15–60 minutes), or swing trading (daily). Adjust settings per timeframe.
Risk Management: Combine with stop-losses (e.g., 1% risk, $0.05 below AEHL entry) and take-profits (3–5%).
Customization: Tweak inputs to match your strategy—experiment in replay to find your sweet spot.
Disclaimer
Green*Diamond is a technical tool to assist with trade identification, not a guarantee of profits. Trading involves risks, and past performance doesn’t predict future results. Always conduct your own analysis, manage risk, and test settings before live trading.
Feedback
Love Green*Diamond? Found a killer setup?
Lesson LineImitates the "Larsson Line" indicator. Uses ema34 and ema55 (both Fibonacci numbers) for the moving averages. No clue if that is what CTO Larsson uses, but this seems to replicate it pretty well.
Gold is a bullish trend and blue is a bearish trend. For entertainment purposes only.

Super Arma Institucional PRO v6.3v6.3
Based on EMA 20 and 200 and SMA 50.
RSI, MACD and ADX built-in with supports and resistances.
Built-in volume, AI reviews the opening and closing of the previous candle and as the price moves it draws the supports and resistances that accompany the price on the chart in real time.
It works perfectly on all time frames, it was designed primarily for trading cryptocurrencies.

Premarket High/Low Breakout Alert (SMA8 Filter)Premarket High/Low Breakout Alert (SMA8 FilterPremarket High/Low Breakout Alert (SMA8 FilterPremarket High/Low Breakout Alert (SMA8 Filter

Premarket High/Low Breakout Alert (SMA8 Filter)premarket high low breakout alert.premarket high low breakout alert.premarket high low breakout alert.

cc AJ Algo 2 - 3,59,17,11,47,29 This indicator will appear under the main chart.
It will provide Goldbach times based on the UTC+2 Zurich Time Zone.
Values in the window pane are derived from the 24HR format of time. (HH:MM)
The only numbers (values) that will appear in this pane are those that are part of the
Goldbach Algo 2 Path as instructed by Ajay on his YouTube channel www.youtube.com
The numbers of 3, 59, 17, 11, 47, 29 are in the Algo 2 Path.
This script/indicator DOES NOT PREDICT nor does it CALCULATE the Algo 1 Path.
The indicator supplies numbers that appear in the path from specific candle time calculations.
Each number that appears in the indicator pane will be a Red Label, a Grey Label, or Green Label.
Red labels are the result of subtraction of the hour from the minute of that candles time.
Grey labels are extracting just the minute portion of that candles time.
Green labels are the result of addition of the minute to the hour of that candles time.

SKYFOR Chandelier StrategyHello everyone)) Its me SKYFOR)) Trading on VOOI))) If you like my indicator I will be happy if you can follow me on twitter too

NQ/MNQ Position Sizing
Despite having my own position sizing calculator in an excel sheet, the manual process of having to identify my next trade, switch tabs/screens, input my values into the sheet, go back into TV, input the trade parameters with appropriate contract sizing, has always really gotten to me. I also found that I would often miss ideal entries due to the delay this caused.
I searched TV for position sizing calculators but almost all the ones I found seemed to be similar: based on some form of manual input for the entry and stop parameters, many of which had way more settings and parameters than I needed, also over complicated things.
I just needed something that would allow me to dynamically set my entry and stop levels directly on the chart, and spit out the appropriate contracts I should be using, either on NQ or MNQ, to maintain my desired level of risk, so I could quickly execute the necessary trade.
So, I coded my own and it's been a huge help to me already, so I thought I may as well publish the script as can't imagine there aren't others out there that also hate the manual data entry process of calculating risk.
Upon first load, the script will ask you to set your Entry and Stop levels, before drawing respective lines for these on the chart, and calculating contract sizing based on your risk settings, which you can update directly. The reset values may be buggy, will be easier to just remove the script and re-apply it to your chart if you ever lose track of the levels you've set.
Hope it's useful.

Raicher EMA/SMAThis script has the intention to help follow and understand x.com strategy trade and her unconventional 343 minutes time frame.

Global M2 Money+ Supply Input Lead (USD)Global M2 Money Supply + INR+CAD Input Lead (USD)
This indicator calculates the global M2 money supply in USD by aggregating M2 data from multiple economies, converted to USD using their respective exchange rates. It overlays the scaled M2 data on the chart with a user-defined time shift to analyze potential correlations with asset prices, such as Bitcoin. The indicator is designed to help traders assess global liquidity trends with a customizable lead or lag.
Countries Included:
Eurozone (EUM2)
North America: United States (USM2), Canada (CAM2)
Non-EU Europe: Switzerland (CHM2), United Kingdom (GBM2), Finland (FIM2), Russia (RUM2)
Pacific: New Zealand (NZM2)
Asia: China (CNM2), Taiwan (TWM2), Hong Kong (HKM2), India (INM2), Japan (JPM2), Philippines (PHM2), Singapore (SGM2)
Latin America: Brazil (BRM2), Colombia (COM2), Mexico (MXM2)
Middle East: United Arab Emirates (AEM2), Turkey (TRM2)
Africa: South Africa (ZAM2)
Input for Lead/Lag:
Time Shift (days): Adjust this input to shift the M2 data forward (positive values) or backward (negative values) on the chart. For example, setting a lead of 85 days shifts the M2 data 85 days into the future, helping traders analyze potential leading indicators for price movements.

Triple Confirmation Scalper v2 - Alarm CompatibleTriple Confirmation Scalper Strategy
A high-probability scalping strategy combining trend momentum, overbought/sold conditions, and volume confirmation to filter low-noise signals.
📊 Strategy Logic
Trend Direction
Dual EMA crossover (9 & 21 periods) for momentum and trend bias.
Overbought/Oversold Zones
RSI (14-period) to avoid entries at extremes.
Volume Spike Filter
OBV + 20-period volume average to confirm breakout validity.
Dynamic Risk Management
Stop-loss: Adaptive to recent price action (5-candle low/high ±1%).
Take-profit: 1.5% target (1.5:1 risk/reward).
🔍 Advanced Features
Precision VWAP (20-period, HLC3-based) for dynamic S/R levels.
Visual Aids:
EMA/VWAP bands + trend-colored background.
Volume spike alerts.
TradingView Alerts pre-configured for long/short signals.
⚙️ Default Settings
Commission: 0.1% factored into backtests.
Mode: Supports both long/short positions.
⚠️ Disclaimer
This is a technical analysis tool, not financial advice.
Past performance ≠ future results. Test thoroughly in a demo account.
Adjust parameters (e.g., EMA periods, RSI thresholds) to match your risk tolerance.
✅ TradingView Compliance Notes:
No exaggerated claims (e.g., "100% win rate").
Clear disclaimer included.
Focus on objective strategy logic (no promotional language).

ICT Judas + Silver Bullet🔰 ICT Judas + Silver Bullet Indicator (SMC-based)
Built for Prop Firm and High Win Rate Intraday Traders
This indicator identifies key institutional setups from Inner Circle Trader (ICT) and Smart Money Concepts (SMC) strategies, optimized for XAUUSD, EURUSD, and other high-volume pairs on the 5-minute chart.
📌 Core Features:
✅ Asian Range Box (02:00–08:00 SGT) – used as manipulation anchor
✅ London Killzone (14:00–16:00 SGT) – Judas Swing detection
✅ New York Killzone (22:30–23:30 SGT) – Silver Bullet setups
✅ Automatic Fair Value Gap (FVG) detection
✅ Liquidity sweep detection based on 20-bar EQH/EQL
✅ Entry + Stop Loss + Take Profit visualization with adjustable RR
✅ Alerts for Judas and Silver setups
✅ Perfect for prop firm scalping and intraday swing logic
🛠️ How It Works:
- Judas Swing: triggers when liquidity above the Asian high is swept during London Killzone
- Silver Bullet: triggers when liquidity below recent lows is swept during NY Killzone
- Entry shown via circle, SL and TP lines based on user-defined RR and stop-loss pip distance
- Designed to be paired with SMC/ICT OB/FVG confirmation entries
⚙️ Settings:
- Adjustable session times
- Toggle FVG display
- Set RR and SL pips to match prop firm rules
- Compatible with alert webhooks for Telegram
🕰️ Note:
All times are fixed to **SGT (GMT+8)**. If you're in another timezone, adjust your TradingView timezone accordingly or update the session inputs manually during Daylight Saving Time changes.
🔔 Alert-Ready:
Use alerts for live signals and pair with webhooks for automation.
🔍 Recommended Pairings:
XAUUSD, EURUSD, GBPUSD, NAS100 on M5 chart
📈 Win Rate Potential:
Backtested with high-probability setups aligned with prop firm daily goals. Best used with strict discipline and 1-2 setups per day.
—
Built with ❤️ by a trader, for traders looking for precision-based executions using ICT logic.

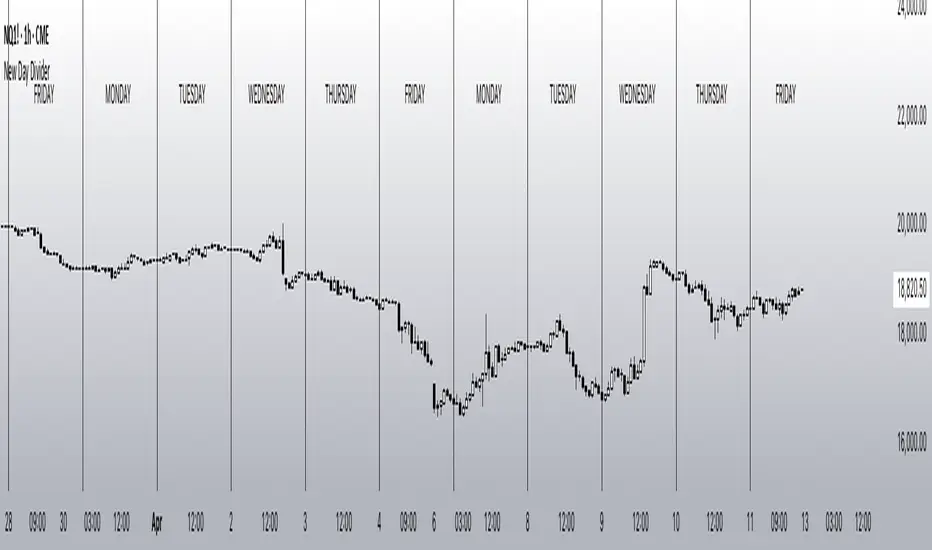
New Day DividerPlots vertical dividers on your chart to mark the beginning of a new trading day based on your preferred time convention.
✅ Customizable New Day Start Time:
"Use Midnight" → Marks the start of a new day at 00:00 (midnight) in the selected timezone.
"Use Digital Open" → Marks the start of a new day at 18:00 New York time, commonly used for digital asset trading.
✅ Full Timezone Support:
Choose from all U.S. time zones (default: New York).
Supports UTC and full UTC offset adjustments for global traders.
✅ Customizable Line Appearance:
Select divider color, width, and style (Solid, Dashed, or Dotted).
Webby's Market OrderThis is visual representation of Webby's Market Order.
When three consecutive lows are above 21 EMA, Uptrend expectation is natural.
When three highs are below 21 EMA, Downtrend expectation is natural.
Alert Conditions can be set when uptrend and down trend are expected.
Use this indicator with IXIC or SPY or major indices.
This is set at three lows/Highs above 21 EMA as looked by Mike Webster.

AI Volume StrategyAI Volume Strategy detects significant volume spikes and combines them with trend direction and candlestick color to generate buy and sell signals. The strategy uses an Exponential Moving Average (EMA) of volume to identify abnormal volume spikes that may indicate strong market activity. Additionally, it uses a 50-period EMA of price to filter the trend and decide on entry direction.
Key Features:
Volume Spike Detection: The strategy detects when the current volume exceeds the EMA of volume by a user-defined multiplier, signaling abnormal increases in market activity.
Trend Direction Filter: The strategy uses a 50-period EMA of price to determine the market trend. Buy signals are generated when the price is above the EMA (uptrend), and sell signals are generated when the price is below the EMA (downtrend).
Candle Color Filter: The strategy generates a buy signal only when the current candle is bullish (green) and a sell signal only when the current candle is bearish (red).
Exit after X Bars: The strategy automatically closes the position after a specified number of bars (default is 5 bars), but the exit condition can be adjusted based on user preference, timeframe, and backtesting results. The default exit is after 5 bars, but users can set it to 1 bar or any other number depending on their preferences and strategy.
Signals:
Buy Signal: Generated when a volume spike occurs, the trend is upward, and the current candle is bullish.
Sell Signal: Generated when a volume spike occurs, the trend is downward, and the current candle is bearish.
Alerts:
Buy Alert: Alerts the user when a buy signal is triggered.
Sell Alert: Alerts the user when a sell signal is triggered.
Visualization:
Buy Signal: A green label appears below the bar when the buy conditions are met.
Sell Signal: A red label appears above the bar when the sell conditions are met.
Volume EMA: Optionally, the Volume EMA line can be plotted on the chart to visualize volume trends.
This strategy helps traders identify potential entry points based on increased volume activity while considering trend direction and candlestick patterns. With the ability to adjust the exit condition, users can fine-tune the strategy to their specific needs and backtest results.

AI Volume SignalsAI Volume Signals
The AI Volume Signals indicator detects significant volume spikes and combines them with trend direction and candle color to generate buy and sell signals. This script utilizes an Exponential Moving Average (EMA) of volume to detect abnormal volume spikes, which could indicate strong market activity. It also filters signals based on the trend direction determined by a 50-period EMA of the price.
Key Features:
Volume Spike Detection: The indicator detects when the current volume exceeds the EMA of volume by a user-defined multiplier, signaling an unusual increase in market activity.
Trend Direction Filter: The 50-period EMA of the price is used to determine the market trend. Buy signals are generated when the price is above the EMA (uptrend), and sell signals occur when the price is below the EMA (downtrend).
Candle Color Filter: The indicator only generates a buy signal when the current candle is bullish (green), and a sell signal when the current candle is bearish (red).
Optional Volume EMA Line: A customizable option allows users to toggle the visibility of the Volume EMA line on the chart. By default, the line is hidden, but can be enabled in the settings.
Signals:
Buy Signal: Generated when a volume spike occurs, the trend is upward, and the current candle is bullish.
Sell Signal: Generated when a volume spike occurs, the trend is downward, and the current candle is bearish.
Alerts:
Buy Alert: Alerts the user when a buy signal is triggered.
Sell Alert: Alerts the user when a sell signal is triggered.
Visualization:
Buy Signal: A green label appears below the bar when the buy conditions are met.
Sell Signal: A red label appears above the bar when the sell conditions are met.
Volume EMA: A line representing the EMA of the volume is plotted on the chart for reference. The visibility of this line can be toggled in the settings.
This indicator can help traders identify potential entry points based on increased volume activity while considering trend direction and candlestick patterns.

Average Body RangeThe Average Body Range (ABR) indicator calculates the average size of a candle's real body over a specified period. Unlike the traditional Average Daily Range (ADR), which measures the full range from high to low, the ABR focuses solely on the absolute difference between the open and close of each bar. This provides insight into market momentum and trading activity by reflecting how much price is actually moving from open to close , not just in total.
This indicator is especially useful for identifying:
Periods of strong directional movement (larger body sizes)
Low-volatility or indecisive markets (smaller body sizes)
Changes in trend conviction or momentum
Customization:
Length: Number of bars used to compute the average (default: 14)
Use ABR to enhance your understanding of price behavior and better time entries or exits based on market strength.

Weekly Open (Current Week Only)📘 Indicator Name: Weekly Open (Current Week Only)
📝 Description:
This indicator plots a horizontal line representing the weekly open price, visible only during the current trading week. At the beginning of each new week (based on TradingView’s weekly time segmentation), the indicator captures the open price of the first candle and draws a constant line across the chart until the week ends. Once the new week begins, the line resets and updates with the new weekly open.
🎯 How to Use – ICT Concepts Integration (Weekly Profile):
This tool is designed to complement ICT (Inner Circle Trader) trading strategies, particularly within the weekly profile framework, by offering a clear and persistent visual of the weekly open, which is a critical reference point in ICT’s market structure theory.
✅ Use Cases:
Directional Bias:
According to ICT concepts, price trading above the weekly open suggests a bullish bias for the week, while trading below it implies bearish conditions.
Traders can use the weekly open line to align their intraweek trades with higher timeframe directional bias.
Dealing Ranges:
Weekly open helps frame the weekly dealing range, especially when combined with other levels like weekly high/low or previous week’s range.
It allows traders to identify potential liquidity pools or areas where price may seek to rebalance.
Mean Reversion Entries:
Price often reverts to or reacts from the weekly open. Traders may use this as a target or entry level, particularly during Monday/Tuesday setups.
Works well in conjunction with concepts like OTE (Optimal Trade Entry) and Judas Swings.
Risk Management:
Acts as a clean and visual anchor to structure stop losses or take-profits based on weekly bias shifts.
