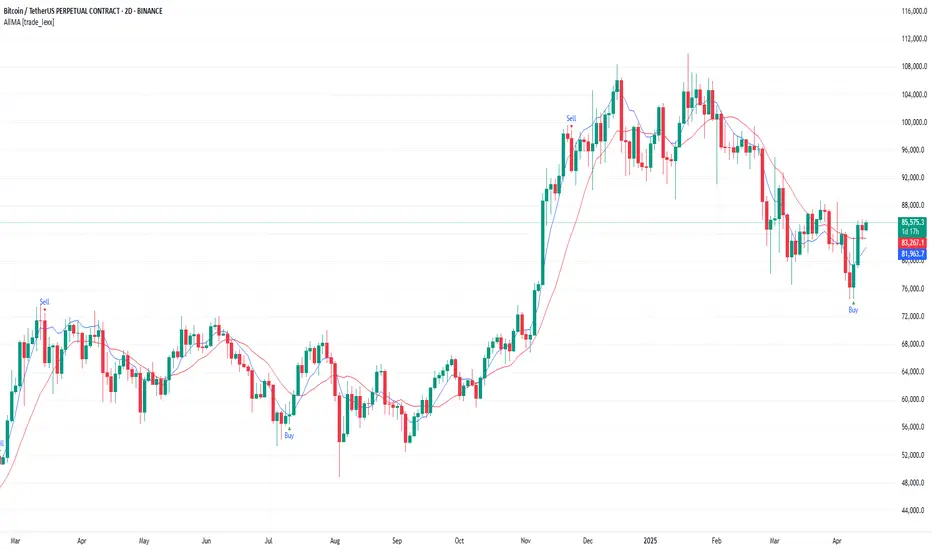
AllMA Trend Radar [trade_lexx]📈 AllMA Trend Radar is your universal trend analysis tool!
📊 What is AllMA Trend Radar?
AllMA Trend Radar is a powerful indicator that uses various types of Moving Averages (MA) to analyze trends and generate trading signals. The indicator allows you to choose from more than 30 different types of moving averages and adjust their parameters to suit your trading style.
💡 The main components of the indicator
📈 Fast and slow moving averages
The indicator uses two main lines:
- Fast MA (blue line): reacts faster to price changes
- Slow MA (red line): smoother, reflects a long-term trend
The combined use of fast and slow MA allows you to get trend confirmation and entry/exit points from the market.
🔄 Wide range of moving averages
There are more than 30 types of moving averages at your disposal:
- SMA: Simple moving average
- EMA: Exponential moving average
- WMA: Weighted moving average
- DEMA: double exponential MA
- TEMA: triple exponential MA
- HMA: Hull Moving Average
- LSMA: Moving average of least squares
- JMA: Eureka Moving Average
- ALMA: Arnaud Legoux Moving Average
- ZLEMA: moving average with zero delay
- And many others!
🔍 Indicator signals
1️⃣ Fast 🆚 Slow MA signals (intersection and ratio of fast and slow MA)
Up/Down signals (intersection)
- Buy (Up) signal:
- What happens: the fast MA crosses the slow MA from bottom to top
- What does the green triangle with the "Buy" label under the candle look
like - What does it mean: a likely upward trend reversal or an uptrend strengthening
- Sell signal (Down):
- What happens: the fast MA crosses the slow MA from top to bottom
- What does it look like: a red triangle with a "Sell" mark above the candle
- What does it mean: a likely downtrend reversal or an increase in the downtrend
Greater/Less signals (ratio)
- Buy signal (Greater):
- What happens: the fast MA becomes higher than the slow MA
- What does it look like: a green triangle with a "Buy" label under the candle
- What does it mean: the formation or confirmation of an uptrend
- Sell signal (Less):
- What happens: the fast MA becomes lower than the slow MA
- What does it look like: a red triangle with a "Sell" mark above the candle
- What does it mean: the formation or confirmation of a downtrend
2️⃣ Signals ⚡️ Fast MA (fast MA and price)
Up/Down signals (intersection)
- Buy signal (Up Fast):
- What happens: the price crosses the fast MA from bottom to top
- What does it look like: a green triangle with a "Buy" label under the candle
- What does it mean: a short-term price growth signal
- Sell signal (Down Fast):
- What happens: the price crosses the fast MA from top to bottom
- What does it look like: a red triangle with a "Sell" label above the candle
- What does it mean: a short-term price drop signal
Greater/Less signals (ratio)
- Buy signal (Greater Fast):
- What happens: the price is getting higher than the fast MA
- What does it look like: a green triangle with a "Buy" label under the candle
- What does it mean: the price is above the fast MA, which indicates an upward movement
- Sell signal (Less Fast):
- What happens: the price is getting lower than the fast MA
- What does it look like: a red triangle with a "Sell" mark above the candle
- What does it mean: the price is under the fast MA, which indicates a downward movement
3️⃣ Signals 🐢 Slow MA (slow MA and price)
Up/Down signals (intersection)
- Buy signal (Up Slow):
- What happens: the price crosses the slow MA from bottom to top
- What does it look like: a green triangle with a "Buy" label under the candle
- What does it mean: a potential medium-term upward trend reversal
- Sell signal (Down Slow):
- What happens: the price crosses the slow MA from top to bottom
- What does it look like: a red triangle with a "Sell" label above the candle
- What does it mean: a potential medium-term downward trend reversal
Greater/Less signals (ratio)
- Buy signal (Greater Slow):
- What happens: the price is getting above the slow MA
- What does it look like: a green triangle with a "Buy" label under the candle
- What does it mean: the price is above the slow MA, which indicates a strong upward movement
- Sell signal (Less Slow):
- What is happening: the price is getting below the slow MA
- What does it look like: a red triangle with a "Sell" mark above the candle
- What does it mean: the price is under the slow MA, which indicates a strong downward movement
🛠 Filters to filter out false signals
1️⃣ Minimum distance between the signals
- What it does: sets the minimum number of candles between signals of the same type
- Why it is needed: it prevents the appearance of too frequent signals, especially during periods of high volatility
- How to set it up: Set a different value for each signal type (default: 3-5 bars)
- Example: if the value is 3 for Up/Down signals, after the buy signal appears, the next buy signal may appear no earlier than 3 bars later
2️⃣ Advanced indicator filters
🔍 RSI Filter
- What it does: Checks the Relative Strength Index (RSI) value before generating a signal
- Why it is needed: it helps to avoid countertrend entries and catch reversal points
- How to set up:
- For buy signals (🔋 Buy): set the RSI range, usually in the oversold zone (for example, 1-30)
- For sell signals (🪫 Sell): set the RSI range, usually in the overbought zone (for example, 70-100)
- Example: if the RSI = 25 (in the range 1-30), the buy signal will be confirmed
📊 MFI Filter (Cash Flow Index)
- What it does: analyzes volumes and the direction of price movement
- Why it is needed: confirms signals with data on the activity of cash flows
- How to set up:
- For buy signals (🔋 Buy): set the MFI range in the oversold zone (for example, 1-25)
- For sell signals (🪫 Sell): set the MFI range in the overbought zone (for example, 75-100)
- Example: if MFI = 80 (in the range of 75-100), the sell signal will be confirmed
📈 Stochastic Filter
- What it does: analyzes the position of the current price relative to the price range
- Why it is needed: confirms signals based on overbought/oversold conditions
- How to configure:
- You can configure the K Length, D Length and Smoothing parameters
- For buy signals (🔋 Buy): set the stochastic range in the oversold zone (for example, 1-20)
- For sell signals (🪫 Sell): set the stochastic range in the overbought zone (for example, 80-100)
- Example: if stochastic = 15 (is in the range of 1-20), the buy signal will be confirmed
🔌 Connecting to trading strategies
The indicator provides various connectors to connect to your trading strategies.:
1️⃣ Individual connectors for each type of signal
- 🔌Fast vs Slow Up/Down MA Signal🔌: signals for the intersection of fast and slow MA
- 🔌Fast vs Slow Greater/Less MA Signal🔌: signals of the ratio of fast and slow MA
- 🔌Fast Up/Down MA Signal🔌: signals of the intersection of price and fast MA
- 🔌Fast Greater/Less MA Signal🔌: signals of the ratio of price and fast MA
- 🔌Slow Up/Down MA Signal🔌: signals of the intersection of price and slow MA
- 🔌Slow Greater/Less MA Signal🔌: Price versus slow MA signals
2️⃣ Combined connectors
- 🔌Combined Up/Down MA Signal🔌: combines all the crossing signals (Up/Down)
- 🔌Combined Greater/Less MA Signal🔌: combines all the signals of the ratio (Greater/Less)
- 🔌Combined All MA Signals🔌: combines all signals (Up/Down and Greater/Less)
❗️ All connectors return values:
- 1: buy signal
- -1: sell signal
- 0: no signal
📚 How to start using AllMA Trend Radar
1️⃣ Selection of types of moving averages
- Add an indicator to the chart
- Select the type and period for the fast MA (default: DEMA with a period of 14)
- Select the type and period for the slow MA (default: SMA with a period of 14)
- Experiment with different types of MA to find the best combination for your trading style
2️⃣ Signal settings
- Turn on the desired signal types (Up/Down, Greater/Less)
- Set the minimum distance between the signals
- Activate and configure the necessary filters (RSI, MFI, Stochastic)
3️⃣ Checking on historical data
- Analyze how the indicator works based on historical data
- Pay attention to the accuracy of the signals and the presence of false alarms
- Adjust the settings if necessary
4️⃣ Introduction to the trading strategy
- Decide which signals will be used to enter the position.
- Determine which signals will be used to exit the position.
- Connect the indicator to your trading strategy through the appropriate connectors
🌟 Practical application examples
Scalping strategy
- Fast MA: TEMA with a period of 8
- Slow MA: EMA with a period of 21
- Active signals: Fast MA Up/Down
- Filters: RSI (range 1-40 for purchases, 60-100 for sales)
- Signal spacing: 3 bars
Strategy for day trading
- Fast MA: TEMA with a period of 10
- Slow MA: SMA with a period of 20
- Active signals: Fast MA Up/Down and Fast vs Slow Greater/Less
- Filters: MFI (range 1-25 for purchases, 75-100 for sales)
- Signal spacing: 5 bars
Swing Trading Strategy
- Fast MA: DEMA with a period of 14
- Slow MA: VWMA with a period of 30
- Active signals: Fast vs Slow Up/Down and Slow MA Greater/Less
- Filters: Stochastic (range 1-20 for purchases, 80-100 for sales)
- Signal spacing: 8 bars
A strategy for positional trading
- Fast MA: HMA with a period of 21
- Slow MA: SMA with a period of 50
- Active signals: Slow MA Up/Down and Fast vs Slow Greater/Less
- Filters: RSI and MFI at the same time
- The distance between the signals: 10 bars
💡 Tips for using AllMA Trend Radar
1. Select the types of MA for market conditions:
- For trending markets: DEMA, TEMA, HMA (fast MA)
- For sideways markets: SMA, WMA, VWMA (smoothed MA)
- For volatile markets: KAMA, AMA, VAMA (adaptive MA)
2. Combine different types of signals:
- Up/Down signals work better when moving from a sideways trend to a directional
one - Greater/Less signals are optimal for fixing a stable trend
3. Use filters effectively:
- The RSI filter works great in trending markets
- MFI filter helps to confirm the strength of volume movement
- Stochastic filter works well in lateral ranges
4. Adjust the minimum distance between the signals:
- Small values (2-3 bars) for short-term trading
- Average values (5-8 bars) for medium-term trading
- Large values (10+ bars) for long-term trading
5. Use combination connectors:
- For more reliable signals, connect the indicator through the combined connectors
💰 With the AllMA Trend Radar indicator, you get a universal trend analysis tool that can be customized for any trading style and timeframe. The combination of different types of moving averages and advanced filters allows you to significantly improve the accuracy of signals and the effectiveness of your trading strategy!
Индикаторы и стратегии
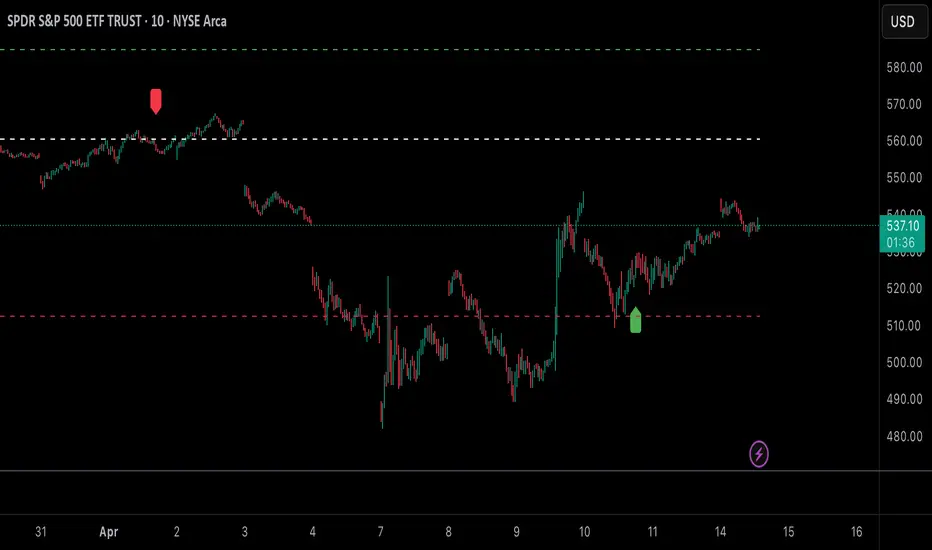
sideways market for strangle📌 Description of "Sideways Market for Strangle" Script**
This **Pine Script** is designed to identify a **sideways market**, which is ideal for **option strangle strategies**. The script plots a **green signal** below the price chart when the market is in a low-volatility, non-trending phase.
---
🔹 How It Works**
1️⃣ **RSI Condition (Measures Market Momentum)**
- The script uses a **Relative Strength Index (RSI) with a length of 11**.
- If **RSI is between 40 and 60**, the market is neither overbought nor oversold, indicating a range-bound or sideways trend.
2️⃣ **ADX Condition (Checks Trend Strength)**
- The **Average Directional Index (ADX)** is used to measure trend strength.
- If **ADX is below 25**, it confirms a weak trend.
- Additionally, ADX must be **lower than both DI+ and DI-**, ensuring that there’s no strong bullish or bearish momentum.
3️⃣ **Signal Plotting**
- When both conditions are met (RSI between 40-60 and ADX < 25 with ADX < DI+ & DI-), a **green shape appears below the price chart**.
- This signal suggests that the market is in a **sideways phase**, making it suitable for **strangle or non-directional option strategies**.
---
🔹 Why Use This for a Strangle Strategy?**
- **Strangles perform best in a sideways market** where implied volatility is low.
- This indicator helps traders avoid **trending markets**, reducing risk.
- **Simple visualization** makes it easy to identify low-movement zones at a glance.
---
🔹 How to Use in TradingView**
1. **Add this script** as a custom indicator.
2. **Look for green signals** appearing below candles.
3. When the signal appears, consider setting up a **strangle options strategy**.
4. Avoid trading when the market shows **strong trends** (RSI out of range or ADX above 25).
---
🚀 Summary**
✅ **Detects sideways markets for strangle strategies**
✅ **Uses RSI (11) & ADX (14) for confirmation**
✅ **Filters out trending conditions**
✅ **Easy-to-use signal for option traders**

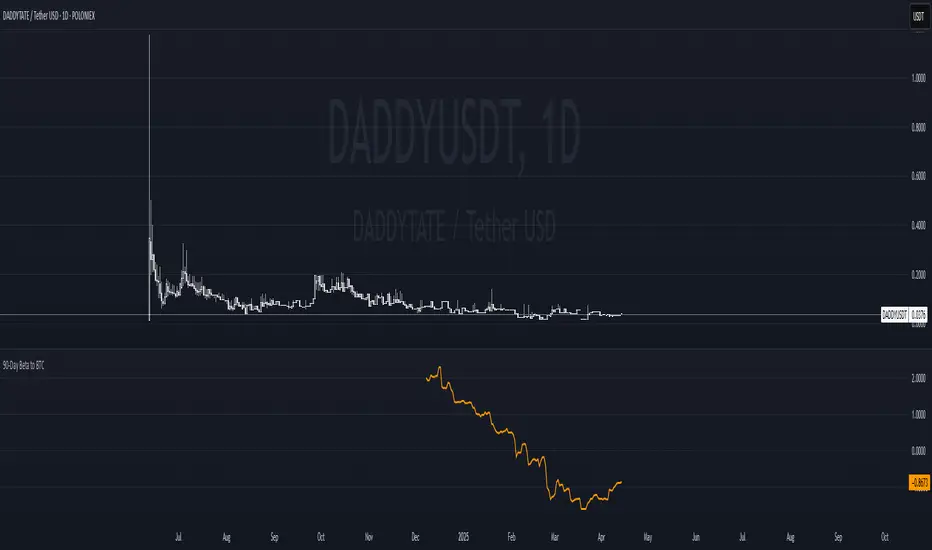
90-Day Beta to BTCOverview:
The 90-Day Beta to BTC indicator measures the volatility of a specific token relative to Bitcoin (BTC) over the past 90 days. Beta is a widely used statistical measure in financial markets that indicates how much a token's price moves in relation to BTC. A higher beta means the token is more volatile compared to BTC, while a lower beta means it is less volatile or moves similarly to BTC.
How It Works:
This indicator calculates the daily logarithmic returns of both the token and Bitcoin, then computes the covariance between their returns and the variance of Bitcoin’s returns. The resulting Beta value reflects the degree to which the token’s price fluctuates relative to Bitcoin's price over the past 90 days.
Beta > 1: The token is more volatile than Bitcoin, showing higher price swings.
Beta = 1: The token moves in lockstep with Bitcoin, exhibiting similar volatility.
Beta < 1: The token is less volatile than Bitcoin, showing smaller price fluctuations.
Beta = 0: The token's price movement is uncorrelated with Bitcoin’s price.
Negative Beta: The token moves opposite to Bitcoin, indicating an inverse relationship.
Use Case:
This indicator is particularly useful for traders or investors looking to identify tokens with high speculative volatility. Tokens with Beta values above 1 are typically high-risk, high-reward assets, often driven by hype, social trends, or market speculation. Conversely, tokens with Beta values below 1 offer a more stable price relationship with Bitcoin, making them less volatile and potentially safer.
In the context of a Trash Token Tournament, tokens with a higher Beta (greater than 1) may be more attractive due to their heightened volatility and potential for larger price swings, making them the “wild cards” of the market.
Visual Representation:
The Beta value is plotted as a line chart beneath the main price chart, offering a visual representation of the token’s volatility relative to Bitcoin over the last 90 days. Spikes in Beta indicate periods of increased volatility, while drops suggest stability.
Big Candle Highlighter (Nifty 1m)This indicator will help option buyers to avoid taking trade in impulsive candles.
For Example :
Normal 1m candle: ~10–15 pts
Big candle (possible liquidity/impulse): >18 pts
Very large / avoid chasing: >25 pts
If you see a candle that breaks structure with a 25-30 point range and closes strong, it’s often:
A liquidity sweep
A news spike
Or the start of an impulsive leg — in which case entering at close can be risky without a retest

Volume and Volatility Ratio Indicator-WODI该指标名为“交易量与波动率比例指标-WODI”,主要基于交易量和价格波动率构造一个复合指数,帮助识别市场内可能存在的异常或转折信号。具体实现如下:
用户自定义参数
用户可以设置交易量均线长度(vol_length)、指数的短期与长期均线长度(index_short_length、index_long_length)、均线敏感度(index_magnification)、阈值放大因子(index_threshold_magnification)以及检测K线形态的区间(lookback_bars)。这些参数为后续计算提供了灵活性,允许用户根据不同市场环境自定义指标的敏感度和响应速度。
交易量均线与百分比计算
首先通过 ta.sma 计算指定长度的交易量简单均线(vol_ma)。
接下来,将当前交易量与均线进行比较,计算出当前交易量占均线的百分比(vol_percent),这反映了短期内交易量的相对活跃程度。
波动率的衡量
使用当前K线的最高价和最低价计算振幅,再除以收盘价乘以100得到波动率(volatility),从而反映市场价格波动的幅度。
构建交易量/波动率指数
将交易量百分比与波动率相乘,形成了“交易量/波动率指数”(volatility_index)。该指数能够同时反映市场的交易活跃度和价格波动性,两者的联合作用帮助捕捉市场的“热度”。
计算指标均线与阈值
对交易量/波动率指数分别计算短期均线(index_short_ma)和长期均线(index_long_ma),并通过乘以一个敏感度参数(index_magnification)进行调整。
同时,依据长期均线计算一个阈值(index_threshold),起到过滤噪音的作用。当指数突破该阈值时,可能预示着市场的重要变化。
K线形态与反转模式检测
通过遍历最近几根K线(由lookback_bars控制),指标会检测是否符合一系列预定条件(涉及交易量、价格振幅、K线形态等),以判断是否存在反转模式。若符合条件,则标记为反转模式,从而为潜在的转折点提供提示。
图表展示
最终在独立窗口中绘制多个元素:
指数短均线与长均线:经过敏感度调整后显示,用于分析指数趋势。
交易量/波动率指数:采用阶梯线风格绘制,直观展示指数变化。
阈值线:作为参考水平,便于判断指数是否突破常规范围。
交易量柱状图:当当前交易量高于均线时,通过不同颜色显示;当检测到反转模式时,颜色会进一步强化,帮助用户迅速识别潜在信号。
English Description
This indicator, titled “Volume and Volatility Ratio Indicator - WODI”, is designed to construct a composite index based on trading volume and price volatility, aiding in the identification of abnormal market conditions or potential reversal signals. Its functionality is broken down as follows:
User-Defined Parameters
The indicator allows users to set parameters such as the moving average length for volume (vol_length), the short and long moving average lengths for the index (index_short_length and index_long_length), a sensitivity multiplier (index_magnification), a threshold magnification factor (index_threshold_magnification), and the number of bars for pattern detection (lookback_bars). These parameters provide flexibility to adjust the sensitivity and responsiveness of the indicator based on different market conditions.
Volume Moving Average and Percentage Calculation
A simple moving average (SMA) of volume is computed over the specified length (vol_ma) using the ta.sma function.
The current volume is then compared to its moving average to calculate the volume percentage (vol_percent), reflecting the relative trading intensity in the short term.
Measuring Volatility
Volatility is calculated based on the current bar’s high and low prices, normalized by the closing price and multiplied by 100, which provides a measure of the market’s price fluctuation magnitude.
Constructing the Volume/Volatility Index
The index (volatility_index) is derived by multiplying the volume percentage by the calculated volatility. This composite metric reflects both market activity and price movement, effectively capturing the overall “heat” of the market.
Calculating the Index Moving Averages and Threshold
Two moving averages for the volatility_index are computed: one short-term (index_short_ma) and one long-term (index_long_ma). These are then adjusted by the sensitivity multiplier (index_magnification).
A threshold level (index_threshold) is calculated based on the long-term moving average multiplied by the threshold magnification factor, serving to filter out market noise. When the index exceeds this threshold, it may signal significant market shifts.
Detection of Reversal Patterns
The indicator iterates through the recent bars (as determined by lookback_bars) to check whether a set of predetermined conditions (involving trends in the volatility_index, volume comparisons, price closes, and K-line patterns) are met. If these conditions are satisfied, it flags a reversal pattern, which may serve as a warning for a potential market turnaround.
Visualization on the Chart
The final display includes several elements plotted in a separate indicator window:
The short-term and long-term moving averages of the index (after sensitivity adjustment) which help visualize the trend of the composite index.
The volatility index itself is drawn using a step-line style for clarity.
A threshold line is plotted to provide a reference level against which index movements can be compared.
A volume histogram is also displayed, where bars are colored differently when the current volume exceeds the moving average; the color is further enhanced if a reversal pattern is detected, making it easy for users to quickly spot potential signals.

Multi-Timeframe Trend Table📊 Multi-Timeframe Trend Table
Overview
This powerful trend-tracking tool gives you a real-time snapshot of market trends across multiple timeframes — all in one compact and color-coded table. Designed for traders who want fast, clean, and multi-timeframe awareness at a glance.
⸻
✅ Features
• 7 Key Timeframes Monitored:
2min · 5min · 15min · 1h · 4h · 1d · 1w
• Trend Detection Based on EMAs
Uses a fast (default 20) and slow (default 200) EMA to determine if a timeframe is trending:
• 🟢 Uptrend: Fast EMA is above slow EMA
• 🔴 Downtrend: Slow EMA is above fast EMA
• 🟠 Sideways: EMAs are close (configurable threshold)
• Raw EMA Distance
See the actual difference between fast and slow EMAs for each timeframe — great for gauging trend strength.
• EMA Slope Analysis
A unique “Slope” column tells you the current behavior of EMAs:
• 📈 Pointing Up
• 📉 Pointing Down
• 🔄 Crossing Up/Down
• ➡️ Lateral
• Instant Alerts
Alerts fire the moment a trend flips on any timeframe, keeping you ahead of market shifts.
• Optional Chart EMAs
Toggle on/off the fast and slow EMAs on your active chart for extra clarity.
⸻
🧠 Use Case Examples
• Confirm trades with alignment across multiple timeframes
• Spot early trend reversals with crossing behavior
• Add a higher-timeframe filter to your scalping system
• Monitor key EMAs without changing your chart timeframe
⸻
⚙️ Configuration
• EMA lengths and sideways threshold are fully adjustable
• Enable/disable chart overlays for EMAs
• Table dynamically updates in real time
⸻
💡 Pro Tip: Use this indicator alongside your entry strategy to only trade in the direction of the dominant trends.
⸻

Anchored VWAP Pro (Final Visibility Enhanced)This is a fully customizable Anchored VWAP (Volume Weighted Average Price) indicator designed for traders who prioritize precision, clarity, and macro trend analysis.
Unlike traditional VWAPs tied to daily or session data, this version allows you to manually anchor the VWAP to any candle in history—ideal for macro swing trading, cycle lows, breakouts, and reaccumulation phases.
Features:
• Manual Anchor Date: Set the exact year, month, and day for your VWAP to begin
• Custom Price Source: Choose between HLC3, close, or any OHLC-based input
• VWAP Bands: Two standard deviation bands for identifying overextension or fair value zones
• Full Visual Control:
• Toggle each band on/off individually
• Adjust color, line width, and line style (solid, dotted, dashed)
• Built for Clarity: Designed to stand out on both light and dark charts
This script is ideal for:
• Identifying macro confluence zones
• Defining risk during trend pullbacks
• Confirming breakout legitimacy
• Layering with other tools like Market Cipher, VRVP, and Fib levels
Inspired by the work of LonesomeTheBlue, Algokid, and other pros—this is a cleaner, more flexible and updated alternative for precision trading.
Script created and published by @ImmortalEmerson
For advanced swing traders, crypto analysts, and macro trend specialists.

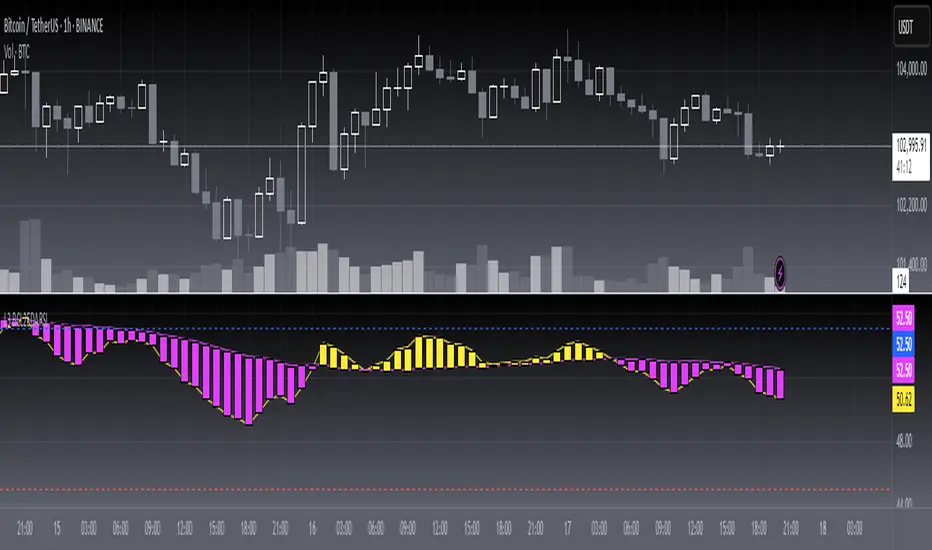
[blackcat] L3 Ehlers DFT-Adapted RSIOVERVIEW
The L3 Ehlers DFT-Adapted RSI is an advanced technical indicator that combines Digital Fourier Transform (DFT) analysis with traditional RSI calculations to provide enhanced market trend identification and trading signals.
FEATURES
• DFT-based frequency analysis of price movements
• Adaptive RSI calculation using dominant cycle detection
• Fast and slow moving average lines
• Color-coded candlestick visualization
• Horizontal reference lines at 45 and 55
• Intelligent sideways detection and label management
• Customizable parameter inputs
HOW TO USE
Configure the following inputs:
• Price source (default: HL2)
• Window size (default: 50)
• Overbought threshold (default: 70)
• Oversold threshold (default: 30)
• Fraction multiplier (default: 0.5)
Interpret the indicator:
• Yellow candles indicate bullish momentum
• Fuchsia candles indicate bearish momentum
• Crosses between fast and slow lines suggest potential trend changes
• Position relative to the 45/55 lines indicates overall market sentiment
• Labels appear only when sideways conditions break
SIDESWAYS DETECTION
• Sideways conditions are identified when:
The difference between fast and slow lines is less than 0.5
Both lines show minimal movement (< 0.1) • During sideways periods:
Existing labels are removed
No new labels are generated • When sideways ends:
If trend reverses, opposite label is generated
If trend continues, no new label is created
LIMITATIONS
• Requires sufficient historical data for accurate calculations
• Performance may vary across different market conditions
• Parameter sensitivity requires careful calibration
NOTES
• The indicator uses Ehlers' proprietary DFT methodology
• Default settings are optimized for general market conditions
• Consider adjusting parameters based on your trading timeframe and strategy
Gold Price with Time ShiftOverview
The "Gold Price with Time Shift" indicator allows you to visualize the Gold price (XAUUSD) with a customizable time shift, enabling you to lag or lead the data by a specified number of bars. Whether you're analyzing historical trends or projecting Gold’s price into the future, this indicator provides a flexible tool to align Gold price movements with other market indicators or events.
Features
Customizable Time Shift: Shift the Gold price backward (lag) or forward (lead) by a user-defined number of bars. Positive values lag the data, while negative values project it into the future.
Future Projection: When leading the Gold price (negative time shift), the indicator extends the chart into the future, displaying the last known price as a flat projection for easy comparison.
Daily Timeframe: Fetches Gold price data on a daily timeframe, ensuring consistency for long-term analysis.
User-Friendly Inputs: Easily adjust the Gold ticker and time shift via the settings panel to suit your analysis needs.

VWAP 2.0 with desv + Initial Balance by RiotWolftrading🌟 Overview
This powerful tool is designed for traders who want to harness the power of the Volume Weighted Average Price (VWAP) alongside session-based ranges to make informed trading decisions. Whether you're a day trader or a swing trader, this indicator provides a clean and effective way to identify support, resistance, and market trends—all in one place! 💡
✨ Key Features
Auto-Anchored VWAP 📊
Automatically calculates the VWAP based on a user-defined anchor period (e.g., Daily, Weekly, Monthly).
Resets at the start of each period (e.g., daily for a Daily anchor).
Displays a customizable VWAP line with standard deviation bands to highlight key price levels.
Standard Deviation Bands 📏
Plots up to three sets of standard deviation bands above and below the VWAP (multipliers: 1.0, 2.0, 3.0).
Includes volume percentage labels to show where trading volume is concentrated. 📉
Session High/Low Range 🕒
Identifies the high and low prices within a customizable session (default: 12:00 to 15:31).
Draws horizontal lines at the session high and low, with dotted deviation lines for additional reference points.
Perfect for spotting key levels during your trading session! 🔑
Time-Based Range Box ⏰
Highlights a specific time window (default: 15:40 to 15:50) with a colored box showing the high and low prices.
Ideal for tracking price action during high-impact events like news releases or market opens. 📅
Alerts 🚨
Set up alerts for when the price crosses above or below the VWAP—never miss a potential trading opportunity!
⚙️ Settings
Customize the indicator to fit your trading style with these easy-to-use settings:
VWAP Settings
Timezone 🌍: Select your timezone (default: GMT+2) to align calculations with your local time.
VWAP Source 📈: Choose the price source for VWAP (default: hlc3 - average of high, low, close).
Std Deviation Multipliers 📐: Adjust the multipliers for the bands (default: 1.0, 2.0, 3.0).
Line Width ✏️: Set the thickness of the VWAP and band lines (default: 1).
Session Time ⏳: Define the session window for VWAP calculations (default: 08:00-18:00, all days).
Show Upper/Lower Bands 👀: Toggle visibility for each set of bands (default: Band 1 visible, Bands 2 & 3 hidden).
Range Settings
Range Start/End Time 🕙: Set the time window for the range box (default: 15:40 to 15:50).
Box Color 🎨: Customize the border color (default: blue).
Box Background Color 🖌️: Adjust the background color (default: light aqua, 90% transparency).
I created this indicator to provide a streamlined, clutter-free tool for traders who rely on VWAP and session-based analysis. It focuses on the essentials—VWAP, standard deviation bands, session high/low, and range box—without unnecessary overlays. I hope it helps you in your trading journey! If you have feedback or suggestions, feel free to share—I’d love to hear from you! 😊
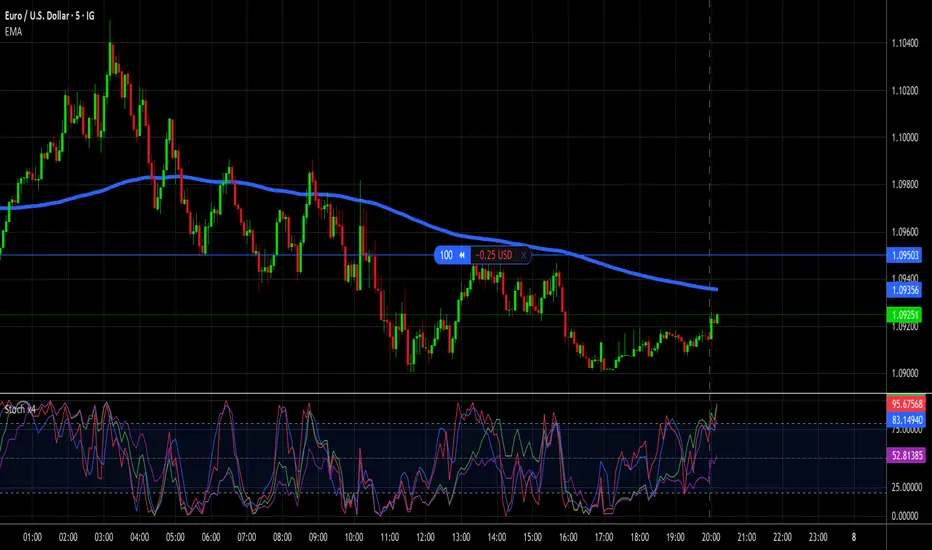
Stochastic with 4 %K LinesQuad Rotation Stochastic Strategy – Indicator Description
The Quad Rotation Strategy is a momentum-based technical analysis tool that overlays four distinct Stochastic %K lines on a single chart. Each line is calculated using a unique set of parameters, allowing traders to visualize and compare momentum signals across varying sensitivities — from fast-reacting setups to slower, trend-confirming ones.
This multi-speed stochastic view is designed to help traders:
Identify rotation points where shorter-term stochastic lines cross faster than longer-term lines, signaling early reversals or trend continuation.
Confirm strength or weakness in price action by observing alignment or divergence among the %K lines.
Fine-tune entries and exits by using fast %K lines for timing and slower ones for confirmation.
🔍 How It Works:
Four separate %K lines are plotted, each with configurable Length and Smoothing.
All lines are calculated using the standard Stochastic formula:
(%K = SMA of (Close - Low) / (High - Low) over period)
No %D lines are included to keep the focus on %K behavior across different speeds.
Standard overbought (80), oversold (20), and midline (50) levels are provided for context.
This indicator is best used in:
Trend continuation setups where faster stochastics pull back to oversold while slower ones remain bullish.
Reversal zones where all four %K lines converge or cross in extreme levels.
Range-bound environments where confluence of extremes offers swing trade opportunities.
Indian Market Price LevelsScript to mark levels in Indian market to look for levels in market that including supports and resistance in the market

15Min Engulfing Break StrategyThe strategy involves the Engulfing Theory, Bullish and Bearish Engulfing patterns. Its specifically for 15 Minute chart. win ratio is 76%.

Combined EMA/Smiley & DEM System## 🔷 General Overview
This script creates an advanced technical analysis system for TradingView, combining multiple Exponential Moving Averages (EMAs), Simple Moving Averages (SMAs), dynamic Fibonacci levels, and ATR (Average True Range) analysis. It presents the results clearly through interactive, real-time tables directly on the chart.
---
## 🔹 Indicator Structure
The script consists of two main parts:
### **1. EMA & SMA Combined System with Fibonacci**
- **Purpose:**
Provides visual insights by comparing multiple EMA/SMA periods and identifying significant dynamic price levels using Fibonacci ratios around a calculated "Golden" line.
- **Components:**
- **Moving Averages (MAs)**:
- 20 EMAs (periods from 20 to 400)
- 20 SMAs (also from 20 to 400)
- **Golden Line:**
Calculated as the average of all EMAs and SMAs.
- **Dynamic Fibonacci Levels:**
Key ratios around the Golden line (0.5, 0.618, 0.786, 1.0, 1.272, 1.414, 1.618, 2.0) dynamically adjust based on market conditions.
- **Fibonacci Labels:**
Labels are shown next to Fibonacci lines, indicating their numeric value clearly on the chart.
- **Table (Top Right Corner):**
- Displays:
- **Input:** EMA/SMA periods sorted by their current average price levels.
- **AVG:** The average of corresponding EMA & SMA pairs.
- **EMA & SMA Values:** Individual EMA/SMA values clearly marked.
- **Dynamic Highlighting:** Highlights the row whose average (EMA+SMA)/2 is closest to the current price, helping identify immediate price action significance.
- **Sorting Logic:**
Each EMA/SMA pair is dynamically sorted based on their average values. Color coding (red/green) is used:
- **Green:** EMA/SMA pairs with shorter periods when their average is lower.
- **Red:** EMA/SMA pairs with longer periods when their average is lower.
- **Star (⭐):** Represents the "Golden" average clearly.
---
### **2. DEM System (Dynamic EMA/ATR Metrics)**
- **Purpose:**
Provides detailed ATR statistics to assess market volatility clearly and quickly.
- **Components:**
- **Moving Averages:**
- SMA lines: 25, 50, 100, 200.
- **Bollinger Bands:**
- Based on 20-period SMA of highs and standard deviation of lows.
- **ATR Analysis:**
- ATR calculations for multiple periods (1-day, 10, 20, 30, 40, 50).
- **ATR Premium:** Average ATR of all calculated periods, providing an overarching volatility indicator.
- **ATR Table (Bottom Right Corner):**
- Displays clearly structured ATR values and percentages relative to the current close price:
- Columns: **ATR Period**, **Value**, and **% of Close**.
- Rows: Each specific ATR (1D, 10, 20, 30, 40, 50), plus ATR premium.
- The ATR premium is highlighted in yellow to signify its importance clearly.
---
## 🔹 Key Features and Logic Explained
- **Dynamic EMA/SMA Sorting:**
The script computes the average of each EMA/SMA pair and sorts them dynamically on each bar, highlighting their relative importance visually. This allows traders to easily interpret the strength of current support/resistance levels based on moving averages.
- **Closest EMA/SMA Pair to Current Price:**
Calculates the absolute difference between the current price and all EMA/SMA averages, highlighting the closest one for quick reference.
- **Fibonacci Ratios:**
- Dynamically calculated Fibonacci levels based on the "Golden" EMA/SMA average give clear visual guidance for potential targets, supports, and resistances.
- Labels are continuously updated and placed next to levels for clarity.
- **ATR Volatility Analysis:**
- Provides immediate insight into market volatility with absolute and relative (percentage-based) ATR values.
- ATR premium summarizes volatility across multiple timeframes clearly.
---
## 🔹 Practical Use Case:
- Traders can quickly identify support/resistance and critical price zones through EMA/SMA and Fibonacci combinations.
- Useful in assessing immediate volatility, guiding stop-loss and take-profit levels through detailed ATR metrics.
- The dynamic highlighting in tables provides intuitive, real-time decision support for active traders.
---
## 🔹 How to Use this Script:
1. **Adjust EMA & SMA Lengths** from indicator settings if different periods are preferred.
2. **Monitor dynamic Fibonacci levels** around the "Golden" average to identify possible reversal or continuation points.
3. **Check EMA/SMA table:** Rows highlighted indicate immediate significance concerning current market price.
4. **ATR table:** Use volatility metrics for better risk management.
---
## 🔷 Conclusion
This advanced Pine Script indicator efficiently combines multiple EMAs, SMAs, dynamic Fibonacci retracement levels, and volatility analysis using ATR into a comprehensive real-time analytical tool, enhancing traders' decision-making capabilities by providing clear and actionable insights directly on the TradingView chart.

Change % - NQ / ES / YM Funded Futures Risk Manager – NQ / ES / YM
🎯 Purpose
This tool is designed for funded futures traders who need to comply with daily risk rules from Topstep, Apex, and similar programs. It tracks the real-time daily % price change in major U.S. equity index futures: Nasdaq (NQ), S&P 500 (ES), and Dow Jones (YM).
⚠️ Why It Matters
Most funded trading programs prohibit trading when the market is within 2% of CME’s daily price limits. This script provides a clear, real-time visual warning to help avoid account violations or disqualification.
🧠 What It Does
Detects the instrument (NQ1!, ES1!, YM1!, and front-month contracts like NQM2025)
Calculates % change from the daily open
Simulates CME’s ±7% daily limit bands
Displays a floating panel with current change in %
Shows a warning if price is within the restricted last 2%
Optionally triggers a visual or sound alert
🔍 Why It’s Different
This is not a predictive or technical analysis tool.
It’s a real-time compliance assistant designed to protect your funded account during volatile sessions.
No complex logic, just clear visual safety for serious traders.
🧭 How To Use It
Add the script to your chart
Use it on NQ1!, ES1!, or YM1! (or M2025 contracts)
The panel shows live price change % from today’s open
When price enters the last 2% of CME’s limit, a warning appears
Avoid entering trades during these times to stay compliant
🖼️ Recommended Chart Setup
✔️ Only this script applied
✔️ Show ticker, timeframe, and the floating panel
✔️ Clean background (no extra drawings or indicators)
✔️ Use on a volatile day for better demonstration (e.g. -2% day)
✅ Fully compliant with TradingView’s script publishing rules.
✅ Focused on risk awareness and rule enforcement.
✅ Supports real-world funded traders.

3 KZ w/ DSTScript is based on the guide from www.tradingcode.net
I have added and aligned multiple User input, formating, timezones and DST options for Japan, Berlin, London and New York.
I have created it to make my back testing easier without needing to think about DST changes.
If anybody have an good idea on how to place session name and day above each session (like in "MKT Session"). Please let me know. Plan is to added it eventually.
Feel free to reuse and please give a heads-up if You add additional cool features.
Kind regards
Bjørn Voss

Alpha Conviction Engine PRO: 70% ConfluenceOnly fires signals when 70%+ of key strategies align
Includes both bullish and bearish logic across:
MA crossover & pullbacks (50/200)
Fibonacci retracements
Bollinger Band breakout/reversion
Volume Profile structure (POC, VAH, VAL)
ATR breakouts
Quant-style conviction (volume spikes, range expansion)
3M-10Y Yield Spread3M-10Y Yield Spread Indicator Description
What It Is:
This indicator calculates the difference (spread) between the 3-month and 10-year US Treasury yields, plotted as a line with a zero reference. The background turns red when the spread inverts (falls below zero), signaling when the 3-month yield exceeds the 10-year yield.
What It Helps Understand:
Economic Health: An inverted yield curve (spread < 0) often predicts recessions, as it reflects market expectations of future economic slowdown, typically preceding downturns by 6-18 months.
Fed Policy Impact: Fed rate hikes can push short-term yields (like the 3-month) higher, potentially causing inversion if long-term yields (10-year) don’t rise as much due to growth concerns. Conversely, Fed rate cuts can lower short-term yields, steepening the curve (spread > 0), signaling economic stimulus or recovery expectations.

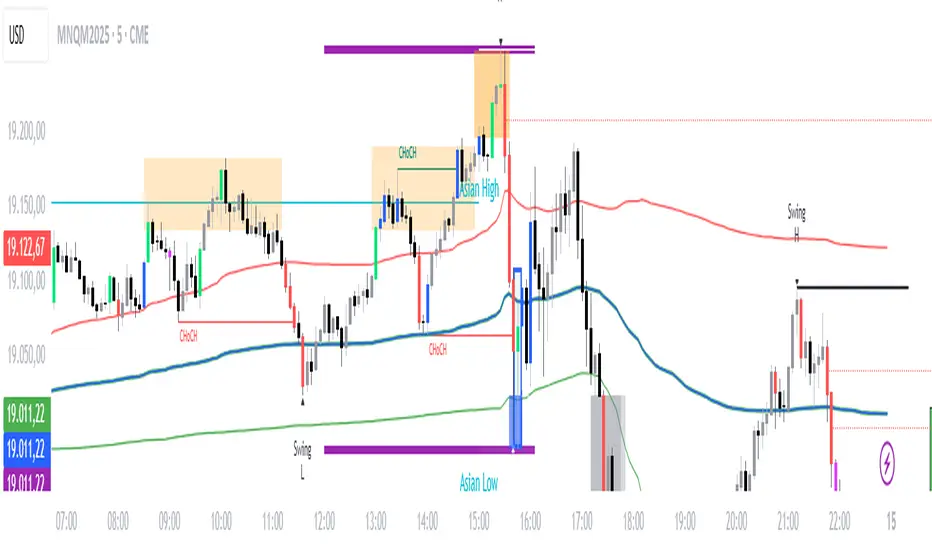
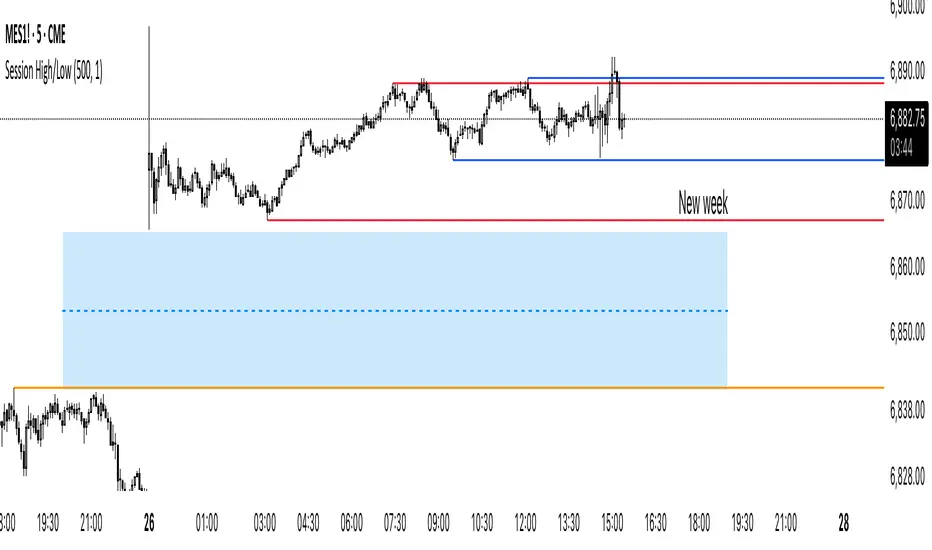
Session Highs and Lows IndicatorSession Highs and Lows Indicator
This indicator automatically tracks and displays the High and Low prices for major trading sessions:
London
New York
Asia
New York Close
For each session, it plots:
A label at the highest and lowest price point reached during the session.
A dashed line showing the high and low levels extended to the right (until the current bar), helping traders visualize key support/resistance zones.
You can toggle visibility for each session individually through the settings panel.
Session times are set in GMT+8, but you can adjust them in the code if needed.
Color code:
London: Blue
New York: Red
Asia: Green
New York Close: Orange
All lines and labels are semi-transparent to avoid chart clutter.
Ideal for intraday and session-based trading strategies.
VWAP+bgcolorThe "VWAP+bgcolor" indicator is an enhanced version of the Volume Weighted Average Price (VWAP) that visually highlights price action relative to the VWAP line. By coloring the chart background, it helps traders quickly identify whether the price is above or below the VWAP, making it easier to spot bullish or bearish market conditions.

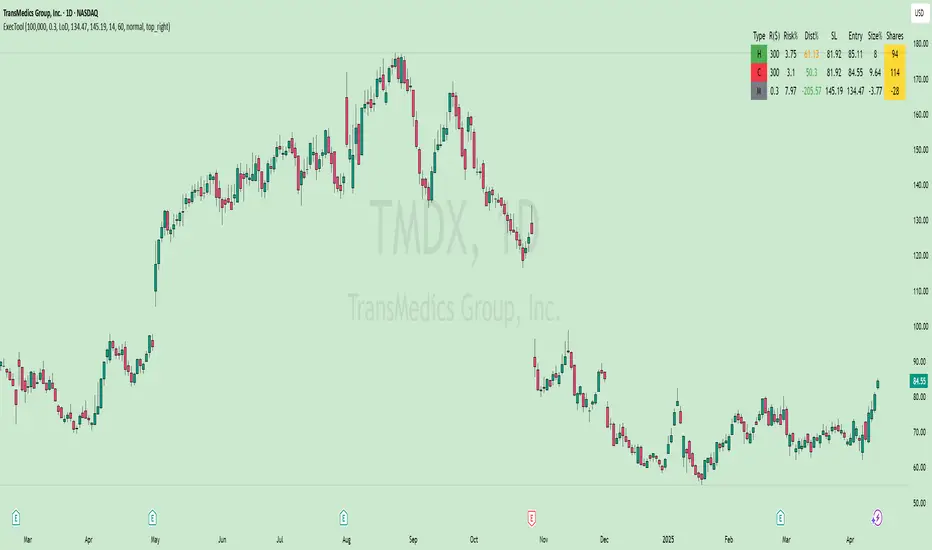
Enhanced Execution ToolA comprehensive position sizing calculator for disciplined risk management
Description :
This tool provides traders with precise position sizing calculations based on their account parameters and market conditions. The indicator calculates optimal position sizes for different entry scenarios while maintaining strict risk control.
Key Features:
Multiple entry options (High, Close, Manual)
Flexible stop loss configuration (LoD or Previous Day Low)
Account-based risk management (1% risk by default)
ATR-based distance metrics for volatility assessment
Clear visual table displaying all critical trade parameters
How to Use:
Configure your account size and risk percentage
Select your preferred entry methods (High/Close/Manual)
Choose stop loss reference (Low of Day or Previous Day Low)
View calculated position sizes and risk parameters
For manual entries, input your desired entry and stop prices
Input Parameters:
Account Configuration: Set your capital and risk tolerance
Entry Options: Choose which entry methods to display
Stop Loss: Select stop loss reference level
Technical Settings: Adjust ATR length and distance limits
Display Options: Customize table appearance
Output Includes:
Risk amount in dollars
Risk as percentage of entry price
Entry to stop loss as percentage of ATR
Stop loss price
Entry price
Position size as % of account
Share quantity
Ideal For:
Traders who want to maintain consistent risk management
Those who need quick position sizing calculations
Investors who trade with multiple entry strategies
Note: Always verify calculations before executing trades. This tool is designed to assist with trade planning, not as trade advice.
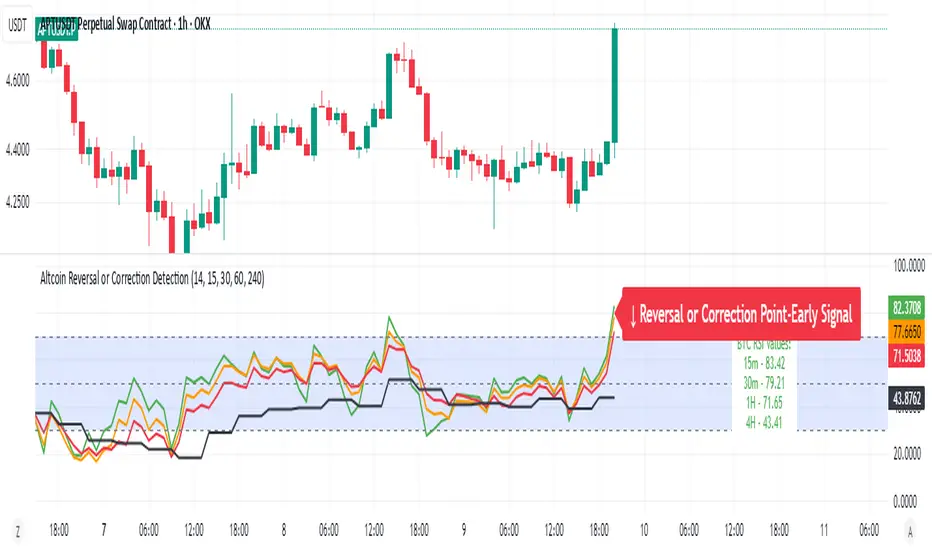
Altcoin Reversal or Correction DetectionINDICATOR OVERVIEW: Altcoin Reversal or Correction Detection
Altcoin Reversal or Correction Detection is a powerful crypto-specific indicator designed exclusively for altcoins by analyzing their RSI values across multiple timeframes alongside Bitcoin’s RSI. Since BTC's price movements have a strong influence on altcoins, this tool helps traders better understand whether a reversal or correction signal is truly reliable or just noise. Even if an altcoin appears oversold or overbought, it may continue trending with BTC—so this indicator gives you the full picture.
The indicator is optimized for CRYPTO MARKETS only. Not suitable for BTC itself—this is a precision tool built only for ALTCOINS only.
This indicator is not only for signals but also serves as a tool for observing all the information from different timeframes of BTC and altcoins collectively.
How the Calculation Works: Algorithm Overview
The Altcoin Reversal or Correction Detection indicator relies on an algorithm that compares the RSI values of the altcoin across multiple timeframes with Bitcoin's RSI values. This allows the indicator to identify key market moments where a reversal or correction might occur.
BTC-Altcoin RSI Correlation: The algorithm looks for the correlation between Bitcoin's price movements and the altcoin's price actions, as BTC often influences the direction of altcoins. When both Bitcoin and the altcoin show either overbought or oversold conditions in a significant number of timeframes, the indicator signals the potential for a reversal or correction.
Multi-Timeframe Confirmation: Unlike traditional indicators that may focus on a single timeframe, this tool checks multiple timeframes for both BTC and the altcoin. When the same overbought/oversold conditions are met across multiple timeframes, it confirms the likelihood of a trend reversal or correction, providing a more reliable signal. The more timeframes that align with this pattern, the stronger the signal becomes.
Overbought/Oversold Conditions & Extreme RSI Values: The algorithm also takes into account the size of the RSI values, especially focusing on extreme overbought and oversold levels. The greater the RSI values are in these extreme regions, the stronger the potential reversal or correction signal. This means that not only do multiple timeframes need to confirm the condition, but the magnitude of the overbought or oversold RSI level plays a crucial role in determining the strength of the signal.
Signal Strength Levels: The signals are classified into three levels:
Early Signal
Strong Signal
Very Strong Signal
By taking into account the multi-timeframe analysis of both BTC and the altcoin RSI values, along with the magnitude of these RSI values, the indicator offers a highly reliable method for detecting potential reversals and corrections.
Who Is This Indicator Suitable For?
This indicator can also be used to detect reversal points, but it is especially effective for scalping. It highlights potential correction points, making it perfect for quick entries during smaller market pullbacks or short-term trend shifts, which is more suitable for scalpers looking to capitalize on short-term movements
Integration with other tools
Use this tool alongside key Support and Resistance zones to further enhance your trade by filtering for even better quality entries and focusing only on high-quality reversal or correction setups. It can be also used with other indicators and suitable with other personalised strategies.
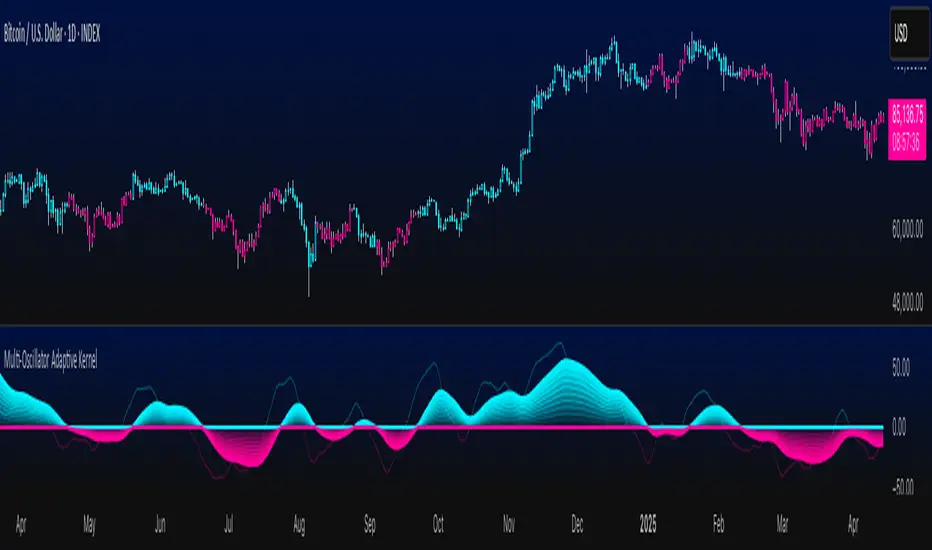
Multi-Oscillator Adaptive KernelMulti-Oscillator Adaptive Kernel
Introduction
The Multi-Oscillator Adaptive Kernel (MOAK) is a powerful momentum-based indicator that fuses multiple popular oscillators RSI, Stochastic, MFI, and CCI into a single, adaptive tool. Through advanced kernel smoothing techniques, MOAK is engineered to filter out market noise and deliver clearer, more consistent trend signals. Whether in trending or ranging markets, MOAK equips traders with a holistic perspective on momentum across multiple timeframes.
Key Features
Oscillator Fusion: Combines normalized values from RSI, Stochastic, Money Flow Index, and Commodity Channel Index to capture broader momentum shifts.
Advanced Kernel Smoothing: Utilizes three kernel smoothing algorithms—Exponential, Linear, and Gaussian—to refine raw oscillator data and minimize false signals.
Customizable Sensitivity: Traders can tailor the indicator's responsiveness by adjusting lookback periods, kernel lengths, and smoothing sensitivity.
Clear Visual Signals: Features a color-coded signal line—cyan for bullish, magenta for bearish—with gradient fills to reflect trend intensity and direction.
Overbought/Oversold Zones: A central zero line helps identify momentum extremes, with layered gradients to indicate the strength of potential reversals or continuations.
Adaptive Signal Design: Dynamically adjusts its output to align with changing market conditions, offering reliable performance across diverse market environments.
How It Works
MOAK starts by calculating and normalizing input from four widely used momentum oscillators: Relative Strength Index (RSI), Stochastic Oscillator, Money Flow Index (MFI), and Commodity Channel Index (CCI). These values are then aggregated to form a composite momentum reading.
To reduce market noise and enhance signal clarity, the composite reading is passed through one of three user-selectable kernel smoothing filters—Exponential, Linear, or Gaussian. These algorithms shape the data curve, softening abrupt fluctuations while preserving meaningful trends.
The resulting smoothed output is rendered visually as a central signal line, colored cyan for upward momentum and magenta for downward momentum. A series of gradient fills around this line illustrates the intensity of the underlying momentum, with the zero line acting as a visual boundary between overbought and oversold regions. Users can customize key parameters such as lookback window, kernel length, and sensitivity level, ensuring the indicator can be optimized for different assets and trading styles.
Examples
MOAK is able to provide clear trend detection on large cap token such as Bitcoin in the example shown below and resistant to noise during consolidation period.
Downside positions are also handled by the indicator, this time on Solana which is more volatile than Bitcoin but even with more volatility MOAK was able to catch an early entry in the downside move.
Below an example on a lower timeframe with a low cap token Fartcoin where MOAK triggered an early entry on a positive uptrend.
Conclusion
MOAK is a sophisticated yet intuitive momentum indicator, merging the strengths of multiple oscillators into a cohesive and adaptive signal. Its kernel-based smoothing and customizable parameters make it a valuable tool for traders seeking to identify trend direction, assess momentum strength, and filter out short-term noise with precision. Ideal for both trend-following and range-trading strategies, MOAK offers a versatile edge in dynamic market conditions.
Disclaimer
This indicator is provided for informational and educational purposes only. It does not constitute financial advice, nor does it guarantee specific results. Always perform your own analysis and consult a licensed financial advisor before making any trading decisions. Use at your own risk.