Session Aware VWAPEver Wonder Why Sessions Feel So Different?
London’s caffeine rush kicks in at 07:00 UTC, New York brings its own energy at 13:00 UTC, and Asia’s quiet mornings can suddenly roar. Each session has its own heartbeat, and this indicator traces it with precision, painting VWAP and its bands only when a session’s live. It’s like tuning into different radio stations, just with price action.
Spotlight on the Main Features
Deviation Multiplier & ATR Length
Tweak a 1.5× ATR band, tighten it for calm markets, loosen up when volatility spikes.
Volume Spike Filter
Flags those “wait, did you see that?” moments when volume suddenly jumps.
Trend EMA + Buffer
A 50‑period EMA with half an ATR buffer—filters noise but still catches real momentum.
Session Boxes & Debug Mode
Shaded session boundaries keep you oriented; debug mode if you love a bit of chart clutter.
Here’s the Thing: How It Works
Reset VWAP at each session start (fresh sum of price×volume & volume).
Calculate upper and lower bands using ATR×deviation multiplier.
Plot only during its session—London lines vanish when New York takes over, and so on.
Putting It to Work: Real‑World Tips
Quick Scalps: When price snaps above the lower band on a volume spike during London overlap, you might grab a quick tick or two.
Trend Confirmation: If price stays above the EMA buffer across sessions, lean into longs. If it dips below, maybe pause and grab coffee.
Dodge False Breakouts: Built‑in 5‑bar cooldown helps you ignore that one‑off fake‑out.
Ready to Give It a Spin?
Try it on EUR/USD or GBP/JPY, then drop your setups below let’s learn out loud.
Индикаторы и стратегии

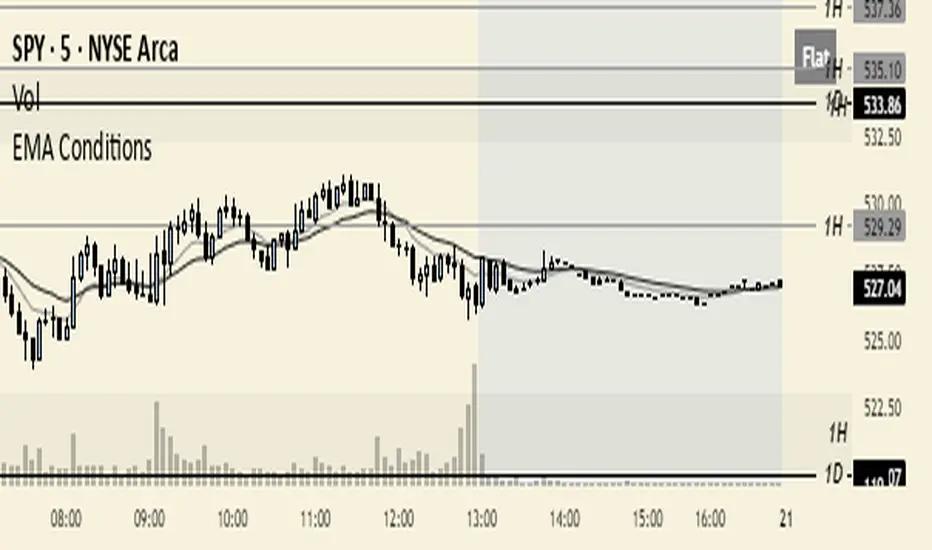
EMA ConditionsThis indicator was developed with the intention to display current market conditions according to the EMAs. There's a little box in the top right to display the conditions. I wanted to design something that shows already established market conditions, which is why I chose to use EMAs and candle closes as the source for identifying market conditions.
Personally, I scalp momentum in trending market conditions, so having an already established trend lets me know when it's appropriate for me to apply my edge on my lower time frame. I use a 5m time frame for my setups and this is where I apply this indicator. I designed the indicator to function off any time frame, so you can use this indicator with whatever time frame you want.
There are 5 conditions that I've set in place for this indicator, they're as follows:
1. Bullish conditions are met when price has closed 3+ consecutive candles over both EMAs (9 and 20 EMAs by default, but you can also choose what EMAs you want).
2. Bearish conditions are met when price has closed 3+ consecutive candles below both EMAs.
3. Reversal conditions are met when EMAs have crossed, and it will show those reversal conditions for the following 4 bars after the EMA cross over has taken place. Once there have been 4 bars closed, it will then show whatever condition is currently present.
4. Wait conditions are met when price is above/below (depending on direction of trend) the 9 ema.
- So in a bull trend, if price is below the 9 ema, it'll show "Wait"
5. Flat conditions are met when both EMAs are showing minimal changes in value over a specified number of candles. This indicates that EMAs are moving sideways and volatility is low. Likely in range bound or chop environments.
- The Flat threshold is adjustable. I have it set to 0.03% with a candle look back of 2 bars. This works the best for my edge, but you can set them to what you want.
The Flat and Wait conditions will override all other conditions. The Reversal conditions will override both Bullish and Bearish conditions. This way, when the indicator is showing Bullish or Bearish conditions, you'll know that nothing else is present.
Since I only trade in trending market conditions, I only trade when Bullish or Bearish conditions are met. If anything else is there then I'm not looking for my setups at that time. But you can use this however you'd like. If you like trading ranges, then trade when EMAs show flat. If you want to fade reversals and trade mean reversion, wait for a reversal condition to show and then look to fade that move. Get creative with it and with your edge. Don't put yourself in a box.
This indicator was made using Grok AI since I have no clue how to write code. I'll make the script available for everyone, so you can make adjustments yourself and do your own thing with it if you want.
If you have any questions or suggestions on how to improve the indicator, feel free to contact me on X: x.com

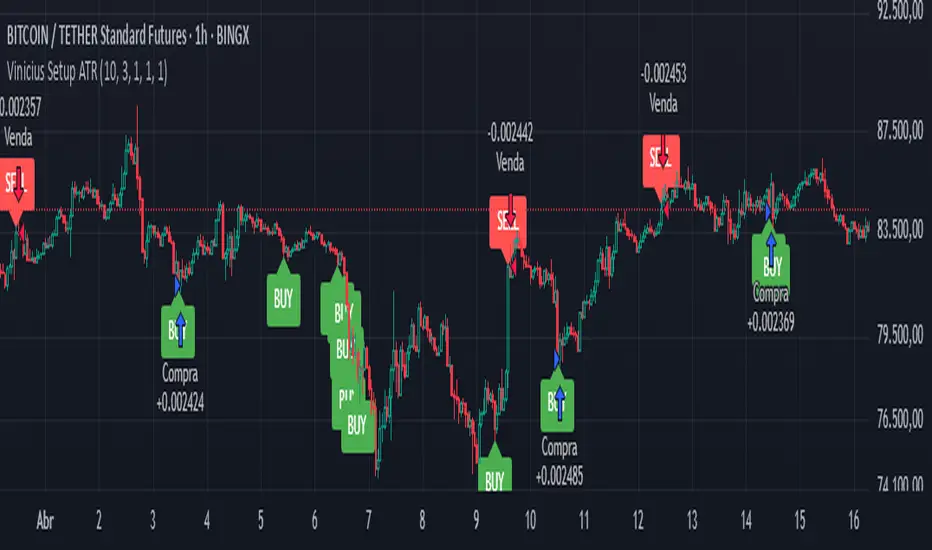
Vinicius Setup ATR
Description:
This script is a strategy based on the Supertrend indicator combined with volume analysis, candle strength, and RSI. Its goal is to identify potential entry points for buy and sell trades based on technical criteria, without promising profitability or guaranteed results.
Script Components:
Supertrend: Used as the main trend compass. When the trend is positive (direction = 1), buy signals are considered; when negative (direction = -1), sell signals are considered.
Volume: Entries are only validated if the volume is above the average of the last 20 candles, adjusted with a 1.2 multiplier.
Candle Body: The candle body must be larger than a certain percentage of the ATR, ensuring sufficient strength and volatility.
RSI: Used as a filter to avoid trades in extreme overbought or oversold zones.
Support and Resistance: Identified based on simple pivots (5 periods before and after).
Customizable Parameters:
ATR Length and Multiplier: Controls the sensitivity of the Supertrend.
RSI Period: Adjusts the relative strength filter.
Minimum Volume and Candle Body: Settings to validate entry signals.
Entry Conditions:
Buy: Positive trend + strong candle + high volume + RSI below 70.
Sell: Negative trend + strong candle + high volume + RSI above 30.
Exit Conditions:
The trade is closed upon the appearance of an opposite signal.
Notes:
This is a technical system with no profit guarantees.
It is recommended to test with realistic capital values and parameters suited to your risk management.
The script is not optimized for specific profitability, but rather to support study and the construction of setups with objective criteria.
StochDL 355This is a Stochastic indicator marking Regular and Hidden Divergence which I liked from the script of Dev Lucem who called his indicator "Plain Stochastic Divergence". I call this indicator StochDL to give Dev Lucem credit for his original contribution. I noticed in his original script that the %K and %D calculation could be improved which I changed to be: period K and period D should be calculated to be %K. Then smooth K and %K should be smoothed to get %D.
His script nicely identifies regular and hidden divergence for %K. However, I then added script to also identify regular and hidden divergence for %D. The "top Spot" and "Bottom Spot" mark when the divergence is complete. It is not my intention to claim that I solely generated this indicator, however, I have altered and added content to make this indicator unique from the original.
I use these arrows for to alert me that there is divergence. I then use other indicators to confirm a change of trend has taken place.

LvlPrice levels for Nasdaq NQ
using NDX and QQQ Price levels and convert them daily to NQ
Levels derived from
Option Flow
Whales target
GEX Levels
0dtde Levels
Largest Sweeps
Darkpools

EMA6–EMA18 Trend Signal SystemThis is a dual-timeframe trend-following indicator designed for intraday traders.
It combines exponential moving averages (EMAs) from two timeframes:
1-hour EMA6 and EMA18 are used to define the major trend direction.
If EMA6 > EMA18 on the hourly chart, the background turns green (indicating an uptrend).
If EMA6 < EMA18, the background turns red (indicating a downtrend).
Entry signals are triggered only on the 15-minute chart:
A long signal appears when EMA6 crosses above EMA18 during an hourly uptrend.
A short signal appears when EMA6 crosses below EMA18 during an hourly downtrend.
Signal arrows are plotted directly on the chart:
Green triangle up = Long signal
Red triangle down = Short signal
Both EMA6 and EMA18 are plotted for visual reference.
This setup helps align lower timeframe entries with higher timeframe trend confirmation, offering traders more precise entry points and reducing noise.
—
The script is intended for use on 15-minute charts and works best in trending markets.
© All rights reserved. Author: hank552

AstraeaAi IndicatorBinary Options Indicator
The indicator is based on the MACD, it gives short positions on a 1-minute timeframe for 4 minutes of the transaction, on a 30c timeframe for 2 minutes of the transaction.


30 Normalized Price with LimitsThis indicator shows the normalized price of the top 30 NASDAQ companies.
The main purpose of the indicator is to identify which company is primarily driving the NASDAQ and to anticipate the market using the information we have.
This indicator is designed to be used in combination with other similar ones I’ve published, which monitor the RSI, CCI, MACD, etc., of the top 30 NASDAQ companies.

Exponential Trend [AlgoAlpha]OVERVIEW
This script plots an adaptive exponential trend system that initiates from a dynamic anchor and accelerates based on time and direction. Unlike standard moving averages or trailing stops, the trend line here doesn't follow price directly—it expands exponentially from a pivot determined by a modified Supertrend logic. The result is a non-linear trend curve that starts at a specific price level and accelerates outward, allowing traders to visually assess trend strength, persistence, and early-stage reversal points through both base and volatility-adjusted extensions.
CONCEPTS
This indicator builds on the idea that trend-following tools often need dynamic, non-static expansion to reflect real market behavior. It uses a simplified Supertrend mechanism to define directional context and anchor levels, then applies an exponential growth function to simulate trend acceleration over time. The exponential growth is unidirectional and resets only when the direction flips, preserving trend memory. This method helps avoid whipsaws and adds time-weighted confirmation to trends. A volatility buffer—derived from ATR and modifiable by a width multiplier—adds a second layer to indicate zones of risk around the main trend path.
FEATURES
Exponential Trend Logic : Once a directional anchor is set, the base trend line accelerates using an exponential formula tied to elapsed bars, making the trend stronger the longer it persists.
Volatility-Adjusted Extension : A secondary band is plotted above or below the base trend line, widened by ATR to visualize volatility zones, act as soft stop regions or as a better entry point (Dynamic Support/Resistance).
Color-Coded Visualization : Clear green/red base and extension lines with shaded fills indicate trend direction and confidence levels.
Signal Markers & Alerts : Triangle markers indicate confirmed trend reversals. Built-in alerts notify users of bullish or bearish direction changes in real-time.
USAGE
Use this script to identify strong trends early, visually measure their momentum over time, and determine safe areas for entries or exits. Start by adjusting the *Exponential Rate* to control how quickly the trend expands—the higher the rate, the more aggressive the curve. The *Initial Distance* sets how far the anchor band is placed from price initially, helping filter out noise. Increase the *Width Multiplier* to widen the volatility zone for more conservative entries or exits. When the price crosses above or below the base line, a new trend is assumed and the exponential projection restarts from the new anchor. The base trend and its extension both shift over time, but only reset on a confirmed reversal. This makes the tool especially useful for momentum continuation setups or trailing stop logic in trending markets.

Session Highs/Lows for Full Day + Open/Close Labelsthis indicator shows the start and stop of each trading session and plots the high and low of each session

30 Prezzi Normalizzati (Daily Reset)This indicator shows the normalized price of the top 30 NASDAQ companies. Like the previous one, its main use is to identifying which company is primarily driving the NASDAQ and in anticipating the market using the information at our disposal. The difference between this indicator and others is that the price is anchored to a common starting point for all companies, offering a clearer view of the market's opening dynamics.
This indicator is designed to be used in combination with other similar tools I’ve published, which track the RSI, CCI, MACD, etc.., of the top 30 NASDAQ companies

30 ATR NormalizedThis indicator shows the normalized ATR of the top 30 NASDAQ companies.
The main purpose of the indicator is to identify which company is primarily driving the NASDAQ, anticipate increases or decreases in market volume, or spot correlations and divergences.
Essentially, this indicator is a composite ATR.
This indicator is designed to be used in combination with other similar ones I've published, which monitor the RSI, CCI, MACD, etc., of the top 30 NASDAQ companies

5 Moving Averages Indicator5 Moving Averages Indicator
This indicator plots five customizable moving averages on the price chart, allowing traders to analyze multiple timeframes and trend layers simultaneously.
Each moving average can be set individually to SMA, EMA, or WMA.
All lengths are fully adjustable to fit different trading strategies.
Designed for traders who need to monitor short-term, medium-term, and long-term trends together.
Clean visual layout with color separation for clarity.
Use this tool to identify trend direction, potential crossover signals, and dynamic areas of support/resistance across different periods.
Ideal for scalping, day trading, and swing trading.
Disclaimer: This indicator is a tool to assist analysis and should not be considered financial advice. Always use with proper risk management.

Time Cycles# New York Time Cycles Indicator
## Overview
The Time Cycles indicator is a specialized technical analysis tool designed to divide the trading day into distinct time blocks based on New York trading hours. Developed for TradingView, this indicator helps traders identify and analyze market behavior during specific time periods throughout the trading session. The indicator displays six consecutive time blocks, each representing 90-minute segments of the trading day, while tracking price ranges within each block.
## Core Concept
The Time Cycles indicator is built on the premise that different periods during the trading day often exhibit unique market characteristics and behaviors. By segmenting the trading day into standardized 90-minute blocks, traders can:
1. Identify recurring patterns at specific times of day
2. Compare price action across different time blocks
3. Recognize potential support and resistance levels based on the high and low of previous time blocks
4. Develop time-based trading strategies specific to certain market hours
## Time Block Structure
The indicator divides the trading day into six sequential 90-minute blocks based on New York time:
1. **Box 1**: 07:00 - 08:30 ET
2. **Box 2**: 08:30 - 10:00 ET
3. **Box 3**: 10:00 - 11:30 ET
4. **Box 4**: 11:30 - 13:00 ET
5. **Box 5**: 13:00 - 14:30 ET
6. **Box 6**: 14:30 - 16:00 ET
These time blocks cover the core US trading session from pre-market into regular market hours.
## Visual Representation
Each time block is represented on the chart as a visual box that:
- Spans the exact time period of the block (horizontally)
- Extends from the highest high to the lowest low recorded during that time period (vertically)
- Is displayed with customizable colors and transparency levels
- Automatically builds in real-time as price action develops
Additionally, the indicator draws dashed projection lines that:
- Display the high and low of the most recently completed time block
- Extend forward in time (for up to 24 hours)
- Help traders identify potential support and resistance levels
## Technical Implementation
The indicator employs several key technical features:
1. **Time Detection**: Accurately identifies the current New York time to place each box in the correct time period
2. **Dynamic Box Creation**: Initializes and updates boxes in real-time as price action develops
3. **Range Tracking**: Continuously monitors and adjusts the high and low of each active time block
4. **Projection Lines**: Creates horizontal dashed lines projecting the high and low of the most recently completed time block
5. **Daily Reset**: Automatically resets all boxes and lines at the start of each new trading day
6. **Customization**: Allows users to set custom colors and transparency levels for each time block
This Time Cycles indicator provides traders with a structured framework for analyzing intraday market movements based on specific time periods. By understanding how the market typically behaves during each 90-minute block, traders can develop more targeted strategies and potentially identify higher-probability trading opportunities throughout the trading day.

FVG# Fair Value Gap (FVG) Indicator
## Overview
The Fair Value Gap (FVG) indicator is a technical analysis tool designed to identify potential areas of price imbalance in the market. These imbalances, known as "fair value gaps," represent discontinuities in price movement where supply and demand were significantly imbalanced, potentially creating zones that price may return to in the future. This indicator was developed by Michele Amori for TradingView and operates as an overlay on price charts.
## Core Concept
Fair Value Gaps occur when price makes a significant move in one direction, leaving behind an area where no trading occurred. Specifically:
- **Bullish FVG**: Forms when the low of the current candle is higher than the high of the candle two positions back, creating an upward gap in price movement.
- **Bearish FVG**: Forms when the high of the current candle is lower than the low of the candle two positions back, creating a downward gap in price movement.
These gaps represent potential "fair value" areas that price may revisit to establish equilibrium between buyers and sellers.
## Visual Representation
The indicator displays FVGs in the following manner:
1. **Bullish FVGs**:
- Represented by semi-transparent green boxes
- Extend from the high of the candle two positions back to the low of the current candle
- Include a dashed green center line representing the middle point of the gap
2. **Bearish FVGs**:
- Represented by semi-transparent red boxes
- Extend from the low of the candle two positions back to the high of the current candle
- Include a dashed red center line representing the middle point of the gap
All FVG boxes and their center lines are extended to the right of the chart, making them visible until they are filled or invalidated.
## Invalidation Logic
The indicator automatically removes FVGs when they are considered filled or invalidated:
- **Bullish FVGs**: Removed when the closing price falls below the bottom of the FVG box, indicating that the upward gap has been filled.
- **Bearish FVGs**: Removed when the closing price rises above the top of the FVG box, indicating that the downward gap has been filled.
This removal only occurs after a candle is confirmed (fully formed), ensuring that premature invalidation doesn't occur during candle formation.
## Technical Implementation
The indicator uses arrays to store and manage the FVG boxes and their center lines. Key features of the implementation include:
- Creation of new FVGs only after candle confirmation
- Dynamic addition and removal of visual elements
- Transparent coloring (80% transparency) for better chart visibility
- Dashed center lines with less transparency (25%) to highlight the middle point of gaps

30 CCI Normalizzati (Daily Reset)This indicator displays the normalized CCI of the top 30 companies in the NASDAQ.
The main utility of the indicator is to identify which company is primarily driving the NASDAQ and which one is not highly correlated, allowing you to anticipate entries into zones that can be considered similar to overbought and oversold conditions, or to spot divergences.
Essentially, this indicator is a composite CCI.
This indicator is designed to be used in combination with other similar tools I've published, which track the RSI, ATR, MACD, etc., of the top 30 NASDAQ companies.

[Kpt-Ahab] PnL-calculatorThe PnL-Cal shows how much you’re up or down in your own currency, based on the current exchange rate.
Let’s say your home currency is EUR.
On October 10, 2022, you bought 10 Tesla stocks at $219 apiece.
Back then, with an exchange rate of 0.9701, you spent €2,257.40.
If you sold the 10 Tesla shares on April 17, 2025 for $241.37 each, that’s around a 10% gain in USD.
But if you converted the USD back to EUR on the same day at an exchange rate of 1.1398, you’d actually end up with an overall loss of about 6.2%.
Right now, only a single entry point is supported.
If you bought shares on different days with different exchange rates, you’ll unfortunately have to enter an average for now.
For viewing on a phone, the table can be simplified.

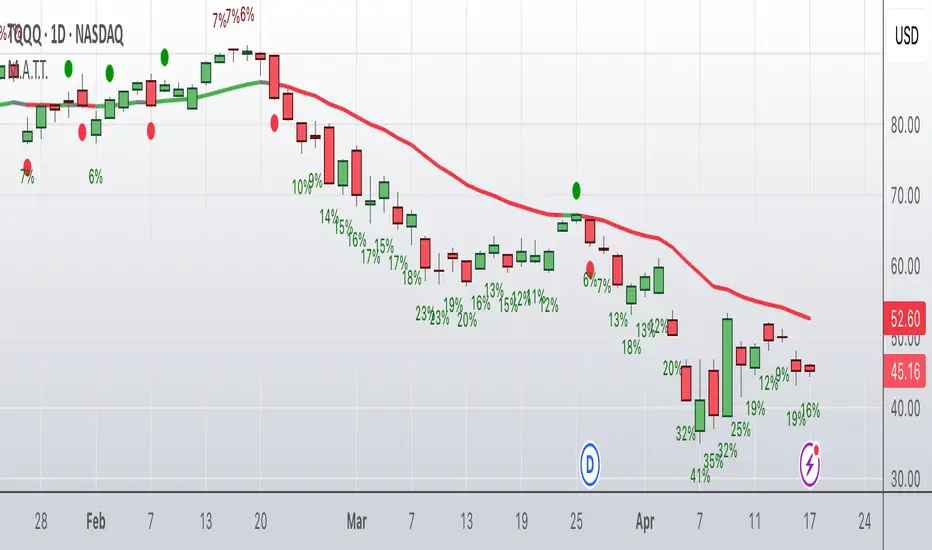
Moving Average Trend ToolsI. How M.A.T.T. Adds Value to the TradingView Community:
The "Moving Average Trend Tools" (M.A.T.T.) is a versatile Pine Script v6 indicator that empowers traders with clear trend analysis, reliable trade signals, and real-time insights. Its intuitive design and robust features make it a valuable addition to the TradingView Community Scripts by catering to traders of all levels. Here’s why it stands out:
Clear Trend Visualization: M.A.T.T. plots a moving average (MA) with dynamic coloring—green for rising, red for falling, and gray for flat—based on a user-defined lookback period. This simplifies trend interpretation, helping traders quickly assess market momentum.
Reliable Trade Signals : The script identifies price crossovers above or below the MA, plotting green circles for bullish crosses and red for bearish, confirmed on closed bars to prevent repainting. These signals guide entry and exit points for trend-following or reversal strategies.
Real-Time Extension Detection : M.A.T.T. calculates percentage price deviations from the MA, displaying real-time labels when thresholds (e.g., 6%) are exceeded. This highlights overextended moves, ideal for spotting reversals or pullbacks, with alerts to keep traders informed.
Extensive Customization : Traders can tailor the MA type (SMA, EMA, WMA, HMA), length, colors, line width, and label sizes. This flexibility supports diverse strategies across markets like stocks, forex, and crypto, from scalping to swing trading.
Automated Alerts : Alert conditions for crossovers and extensions integrate seamlessly with TradingView’s system, enabling traders to stay updated without constant chart monitoring.
M.A.T.T. combines trend analysis, signal generation, and overextension detection into a single, user-friendly tool. Its accessibility, reliability, and educational value for Pine Script learners make it a compelling contribution to the community.
II. What M.A.T.T. Does, How It Works, and Its Originality:
What It Does :
M.A.T.T. enhances trend analysis and trade decision-making through three core features:
Dynamic MA Visualization: Plots a customizable MA (SMA, EMA, WMA, or HMA) with trend-based coloring to reflect rising, falling, or flat market conditions.
Price Crossover Signals : Marks bullish (green circles) and bearish (red circles) crossovers, confirmed on closed bars, with alerts for trade opportunities.
Price Extension Labels : Displays real-time percentage deviations of price from the MA, with alerts when user-defined thresholds are breached, signaling potential reversals.
How It Works :
M.A.T.T. leverages Pine Script v6 for precise calculations and user-friendly outputs:
Inputs: Users select MA type, length, lookback period, colors, and thresholds for extensions, plus label styles and sizes for customization.
MA Calculation : A switch function computes the chosen MA (e.g., ta.ema(close, 21) for EMA). Trend direction is determined using ta.rising or ta.falling over the lookback period, coloring the MA accordingly.
Crossover Logic : Bullish crossovers (close > ma and close < ma ) and bearish crossovers (close < ma and close > ma ) are plotted as circles on confirmed bars (barstate.isconfirmed) to ensure reliability. Alerts trigger only on the first bar of a crossover.
Extension Logic : Percentage deviations are calculated as ((price - ma) / ma) * 100, using the high for above-MA extensions and low for below. Labels appear in real-time when thresholds are exceeded, with alerts on transitions to avoid noise.
Why It’s Original
M.A.T.T. distinguishes itself through a unique blend of features and thoughtful design:
All-in-One Design : It integrates dynamic MA coloring, non-repainting crossover signals, and real-time extension detection, addressing trend identification, trade signals, and overextension warnings in one tool—unlike most MA indicators that focus on a single aspect.
Real-Time Extension Labels : Displaying percentage deviations with customizable thresholds is a rare feature, ideal for volatile markets and not commonly found in standard scripts.
Non-Repainting Signals : Confirmed crossover signals enhance reliability for live trading, setting M.A.T.T. apart from less rigorous indicators.
Optimized Alert Condtions : Alerts trigger only on transitions (e.g., first bar of a crossover or extension), reducing noise and improving usability.
Visual and Functional Flexibility : Support for four MA types, extensive customization, and a clean interface (dynamic colors, tiny circles, clear labels) make it adaptable and user-friendly.
While MA plotting or crossovers exist elsewhere, M.A.T.T.’s seamless integration, real-time extension detection, alert conditions, and focus on reliability and customization create a distinctive, practical tool. Its balance of simplicity and sophistication makes it a unique asset for the TradingView community.
Highlight Candle Body ≤ 10 Ticks (Clean & Subtle)Purpose:
This indicator highlights candlesticks where the body size (difference between open and close) is 10 ticks or less, specifically for instruments like Crude Oil futures (CL) where 1 tick = 0.01.
How it works:
It calculates the body size: abs(close - open)
If the body is ≤ 0.10 (10 ticks), the candle is softly colored in muted orange.
Wicks are ignored — only the body is considered.
No additional shapes or markers — clean and minimal.
Use case:
Helps identify periods of indecision or low momentum — such as potential pause candles, traps, or setups just before volatility returns.

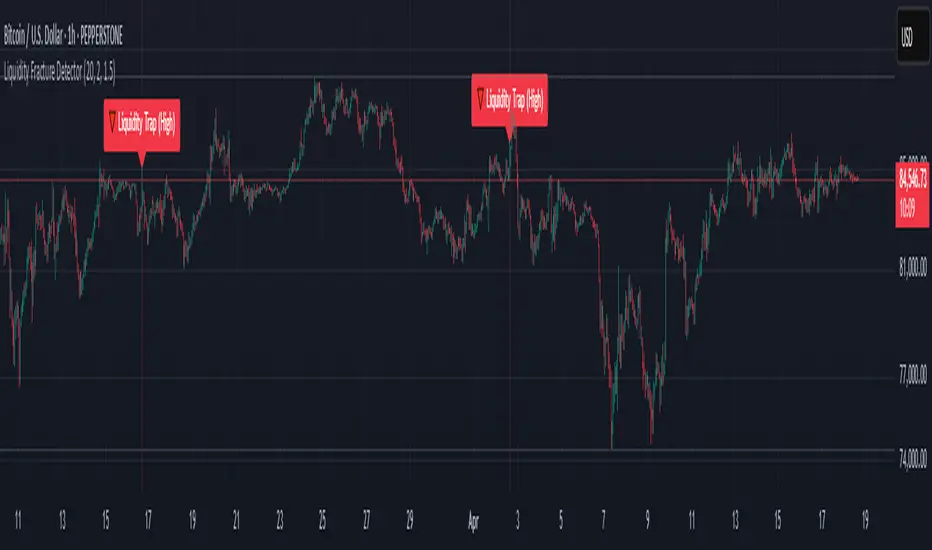
Liquidity Fracture DetectorThe Liquidity Fracture Detector is an advanced tool designed to identify micro-liquidity traps and structural fakeouts on intraday charts. These occur when the market appears to break out, only to quickly reverse — often triggered by stop hunts, inefficient fills, or manipulated order flow.
The script combines volume spikes, volatility anomalies, and price structure breaks to signal "fractures" — points where the market temporarily breaks its behavior, often followed by strong reversals or trend accelerations.
Detection logic in the script:
Volume spike greater than 2x the average (adjustable)
Volatility spike: candle range is > 1.5x the average
Extreme wicks: wick is larger than the candle body (a classic trap signal)
Structure break: price breaks previous high/low but closes back within the old range
Combine these elements → a “fracture” is marked
Visual representation:
Red background = potential bull trap (fake breakout to the upside)
Green background = potential bear trap (fake breakdown to the downside)
A label appears at each fracture: “Echo” with the number of previous hits
Ideal use cases:
Intraday trading (1m, 5m, 15m)
Crypto, indices, futures, and forex
Detecting reactive zones where the market takes a false direction
Confluence with S/R zones, order blocks, or liquidity pools
Fully customizable:
Volume and range sensitivity
Heatmap intensity
Toggle labels on/off
Note:
This script is intended to support discretionary analysis. It does not provide buy or sell signals and is not an automated strategy. Combine it with your own price action or order flow setup for optimal results.
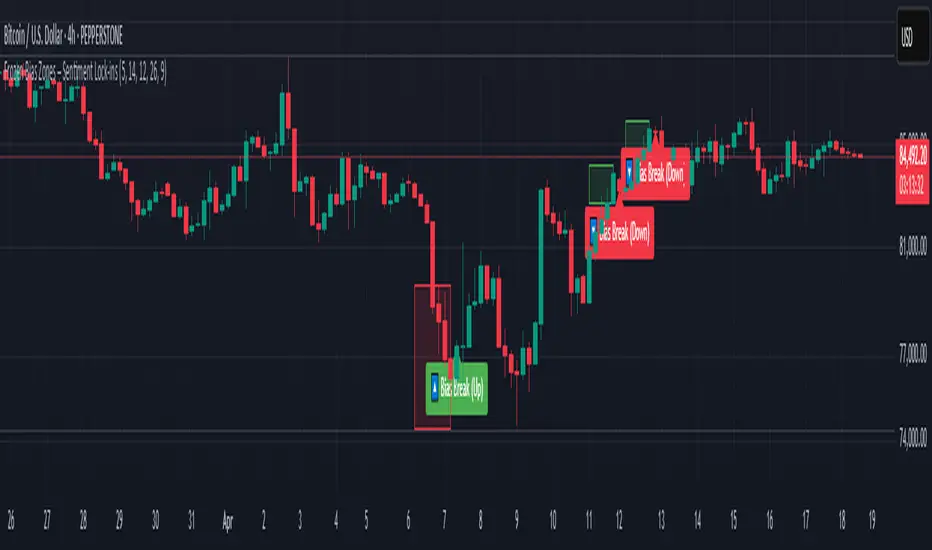
Frozen Bias Zones – Sentiment Lock-insOverview
The Frozen Bias Zones indicator visualizes market sentiment lock-ins using a combination of RSI, MACD, and OBV. It creates "bias zones" that indicate whether the market is in a sustained bullish or bearish phase. These zones are then highlighted on the chart, helping traders spot when the market is locked in a bias. The script also detects breakout events from these zones and marks them with clear labels for easier decision-making.
Features
Multi-Indicator Sentiment Analysis: Combines RSI, MACD, and OBV to detect synchronized bullish or bearish sentiment.
Frozen Bias Zones: Identifies and visually represents zones where the market has remained in a particular sentiment (bullish or bearish) for a defined period.
Breakout Alerts: Displays labels to indicate when the price breaks out of the established bias zone.
Customizable Inputs: Adjust the zone duration, RSI, MACD, and breakout label visibility.
Input Parameters
Bias Duration (biasLength)
The minimum number of candles the market must stay in a specific sentiment to consider it a "Frozen Bias Zone".
Default: 5 candles.
RSI Period (rsiPeriod)
Period for the Relative Strength Index (RSI) calculation.
Default: 14 periods.
MACD Settings
MACD Fast (macdFast): The fast-moving average period for the MACD calculation.
Default: 12.
MACD Slow (macdSlow): The slow-moving average period for the MACD calculation.
Default: 26.
MACD Signal (macdSig): The signal line period for MACD.
Default: 9.
Show Break Label (showBreakLabel)
Toggle to show labels when the price breaks out of the bias zone.
Default: True (shows label).
Bias Zone Colors
Bullish Bias Color (bullColor): The color for bullish zones (light green).
Bearish Bias Color (bearColor): The color for bearish zones (light red).
How It Works
This indicator analyzes three key market metrics to determine whether the market is in a bullish or bearish phase:
RSI (Relative Strength Index)
Measures the speed and change of price movements. RSI > 50 indicates a bullish phase, while RSI < 50 indicates a bearish phase.
MACD (Moving Average Convergence Divergence)
Measures the relationship between two moving averages of the price. A positive MACD histogram indicates bullish momentum, while a negative histogram indicates bearish momentum.
OBV (On-Balance Volume)
Uses volume flow to determine if a trend is likely to continue. A rising OBV indicates bullish accumulation, while a falling OBV indicates bearish distribution.
Bias Zone Detection
The market sentiment is considered bullish if all three indicators (RSI, MACD, and OBV) are bullish, and bearish if all three indicators are bearish.
Bullish Zone: A zone is created when the market sentiment remains bullish for the duration of the specified biasLength.
Bearish Zone: A zone is created when the market sentiment remains bearish for the duration of the specified biasLength.
These bias zones are visually represented on the chart as colored boxes (green for bullish, red for bearish).
Breakout Detection
The script automatically detects when the market exits a bias zone. If the price moves outside the bounds of the established zone (either up or down), the script will display one of the following labels:
Bias Break (Up): Indicates that the price has broken upwards out of the zone (with a green label).
Bias Break (Down): Indicates that the price has broken downwards out of the zone (with a red label).
These labels help traders easily identify potential breakout points.
Example Use Case
Bullish Market Conditions: If the RSI is above 50, the MACD histogram is positive, and OBV is increasing, the script will highlight a green bias zone. Traders can watch for potential bullish breakouts or trend continuation after the zone ends.
Bearish Market Conditions: If the RSI is below 50, the MACD histogram is negative, and OBV is decreasing, the script will highlight a red bias zone. Traders can look for potential bearish breakouts when the zone ends.
Conclusion
The Frozen Bias Zones indicator is a powerful tool for traders looking to visualize prolonged market sentiment, whether bullish or bearish. By combining RSI, MACD, and OBV, it helps traders spot when the market is "locked in" to a bias. The breakout labels make it easier to take action when the price moves outside of the established zone, potentially signaling the start of a new trend.
Instructions
To use this script:
Add the Frozen Bias Zones indicator to your TradingView chart.
Adjust the input parameters to suit your trading strategy.
Observe the colored bias zones on your chart, along with breakout labels, to make informed decisions on trend continuation or reversal.