Renko Momentum Wave (RMW)Renko Momentum Wave
The Renko Momentum Wave (RMW) is a custom momentum oscillator specifically designed for Renko-based price action analysis. Unlike traditional oscillators that rely on time-based data, the RMW focuses on the directional consistency of Renko bricks, measuring the strength of trend momentum purely based on price movement.
Индикаторы и стратегии

MACD_V1New Features:
Golden/Death Crossover Markers
Golden/Death Crossover Alerts
新增功能
1、金叉死叉标识
2、金叉死叉警报

VWAP + Wyckoff (Spring & UT)//@version=5
indicator("VWAP + Wyckoff (Spring & UT)", overlay=true)
// === INPUTS ===
dev1 = input.float(1.0, "Do lech chuan 1", group="VWAP Bands")
dev2 = input.float(2.0, "Do lech chuan 2", group="VWAP Bands")
volMultiplier = input.float(1.5, "Nguong volume cao bat thuong", group="Wyckoff Logic")
lookback = input.int(50, "So nen tim ho tro/khang cu", group="Wyckoff Logic")
// === VWAP ===
vwapVal = ta.vwap
var float cumVol = na
var float cumPV = na
var float cumPV2 = na
if (ta.change(time("D")) != 0)
cumVol := 0
cumPV := 0
cumPV2 := 0
cumVol += volume
cumPV += hlc3 * volume
cumPV2 += math.pow(hlc3, 2) * volume
mean = cumPV / cumVol
variance = cumPV2 / cumVol - math.pow(mean, 2)
stdev = math.sqrt(variance)
// Bands
upper1 = vwapVal + dev1 * stdev
lower1 = vwapVal - dev1 * stdev
upper2 = vwapVal + dev2 * stdev
lower2 = vwapVal - dev2 * stdev
// === PLOT ===
plot(vwapVal, color=color.orange, linewidth=2, title="VWAP")
pUpper1 = plot(upper1, color=color.green, title="Upper Band 1")
pLower1 = plot(lower1, color=color.green, title="Lower Band 1")
pUpper2 = plot(upper2, color=color.blue, title="Upper Band 2")
pLower2 = plot(lower2, color=color.blue, title="Lower Band 2")
fill(pUpper1, pLower1, color=color.new(color.green, 85), title="Fill Band 1")
fill(pUpper2, pLower2, color=color.new(color.blue, 90), title="Fill Band 2")
// === Wyckoff SPRING & UT Detection ===
support = ta.lowest(low, lookback)
resistance = ta.highest(high, lookback)
avgVol = ta.sma(volume, 20)
isSpring = low < support and close > support and volume > avgVol * volMultiplier
isUT = high > resistance and close < resistance and volume > avgVol * volMultiplier
plotshape(isSpring, title="Spring", location=location.belowbar, text="Spring", style=shape.labelup, size=size.small, color=color.lime, textcolor=color.white)
plotshape(isUT, title="UpThrust", location=location.abovebar, text="UT", style=shape.labeldown, size=size.small, color=color.red, textcolor=color.white)
// === Alerts ===
alertcondition(isSpring, title="🔔 Spring xuat hien", message="Tin hieu SPRING xuat hien!")
alertcondition(isUT, title="🔔 UpThrust xuat hien", message="Tin hieu UPTHRUST xuat hien!")

20 & 50 EMA + ATR, TR & DATRIndicator Name: 20 & 50 EMA + ATR, TR & DATR
This custom indicator combines trend and volatility analysis into a single tool, helping you make smarter trading decisions with fewer indicators on your chart.
---
1. 20 & 50 Exponential Moving Averages (EMAs)
EMA 20 (Blue Line): A short-term trend indicator that reacts quickly to price changes.
EMA 50 (Orange Line): A medium-term trend indicator that smooths out more of the noise.
How to Use:
Bullish signal: EMA 20 crosses above EMA 50
Bearish signal: EMA 20 crosses below EMA 50
Use crossovers or distance between EMAs to confirm trends or potential reversals
---
2. True Range (TR)
Definition: The greatest of the following:
High - Low
High - Previous Close
Previous Close - Low
Use: Shows how much the asset moved during the candle. Useful for understanding raw price movement.
---
3. Average True Range (ATR)
Definition: The average of the True Range over a 14-bar period
Line color: Red (shown in the status line above your chart)
How to Use:
High ATR = High volatility
Low ATR = Low volatility
Use ATR to help determine stop-loss and take-profit levels, or to avoid low-volatility periods
---
4. Daily ATR (DATR)
Definition: ATR calculated from the daily timeframe, regardless of the chart's current timeframe
Line color: Green (also shown in the status line)
How to Use:
Know how much the asset typically moves in a full day
Helps intraday traders set realistic targets or detect when the market is unusually quiet or active


Midnight (Daily) OpenMidnight (Daily) Open v1.0
Overview
Plots a real‑time horizontal line at the U.S. session “midnight” open (i.e. the daily candle’s open price) on any intraday chart. Optionally displays a label with the exact price, making it easy to see how price reacts to the session open.
Key Benefits
Immediate Context: See at a glance where today’s session began, helping identify support/resistance.
Consistent Reference: Works on any symbol or intraday timeframe.
Customizable Styling: Tweak colors, line thickness, and label appearance to match your chart theme.
Features
Retrieves the daily open via request.security() (Pine v6).
Draws or updates a single horizontal line that extends into the future.
Optional price label on the last bar, with user‑defined text and background colors.
Zero repainting—always shows the true daily open.

compare strength
---
Compare Strength – Multi-Timeframe Relative Strength Indicator
**Author:** @martin_alpha
**License:** Mozilla Public License 2.0
**Script version:** Pine Script™ v6
What does this indicator do?
This indicator is designed to **compare the relative strength of any asset against a chosen benchmark**. It provides traders and analysts with a clear visual representation of how one asset is performing compared to another over different time horizons.
Key Features:
- **Benchmark Comparison**: Compares the current asset’s price action against a user-defined symbol (default: `BTCUSDT` from Binance).
- **Relative Strength Ratio**: Calculates a scaled ratio of the asset’s price relative to the benchmark.
- **Multi-EMA Smoothing**: Applies three Exponential Moving Averages (EMAs) with user-defined lengths to smooth the strength ratio and highlight trends.
- **Customizable Inputs**: Allows traders to input their own benchmark symbol and EMA lengths for full flexibility.
How it works:
1. **Relative Ratio Calculation**:
```
ratio = (close / benchmark close) * 1000
```
This gives a scaled value showing how strong the current asset is relative to the benchmark.
2. **EMAs of the Ratio**:
- `ratio_ma1`: Fast smoothing (default length 10)
- `ratio_ma2`: Medium smoothing (default length 20)
- `ratio_ma3`: Long-term smoothing (default length 100)
3. **Plotting**:
- The raw ratio is plotted as a dynamic line.
- The smoothed ratios are plotted in **Red**, **Green**, and **Blue**, respectively.
How to Use:
- Choose any benchmark to compare strength — for example, `BINANCE:ETHUSDT` or a sector ETF like `SPY` if using on stocks.
- Observe **crossovers** between the ratio and its moving averages:
- When the ratio is above the moving averages, it indicates **relative outperformance**.
- When it is below, it may indicate **relative weakness**.
- Great for **pair trading**, **sector rotation**, or identifying **leading assets** in a trend.
Inputs:
- `length` (default 10): EMA length for short-term strength smoothing.
- `length2` (default 20): EMA length for medium-term strength.
- `length3` (default 100): EMA length for long-term trend view.
- `s01`: Symbol to use as a benchmark (default: `BINANCE:BTCUSDT`).
Notes:
- The benchmark is normalized by dividing by 100 to improve visual scaling.
- The final ratio is scaled by 1000 for better chart readability — this has no impact on actual strength interpretation.
- Best used on **higher timeframes** for macro trend comparison or on **shorter timeframes** for intra-day relative strength setups.
---

SPDR Sectors TableThis script generates an interactive and customizable SPDR Sectors Table designed to monitor and analyze the performance of the 11 main sectors of the S&P 500 via sector-specific ETFs. It offers a dynamic overview of daily or periodic sector movements, making it a valuable tool for traders, analysts, and investors implementing sector rotation strategies.
█ DEFINITIONS
SPDR Sectors ETFs are exchange-traded funds managed by State Street Global Advisors, which divide the S&P 500 into the following 11 sectors:
- Communication Services (XLC)
- Consumer Discretionary (XLY)
- Consumer Staples (XLP)
- Energy (XLE)
- Financials (XLF)
- Health Care (XLV)
- Industrials (XLI)
- Materials (XLB)
- Real Estate (XLRE)
- Technology (XLK)
- Utilities (XLU)
These ETFs aim to replicate the performance of their respective sectors as defined by the Global Industry Classification Standard (GICS). The funds are periodically rebalanced to match changes in the S&P 500 composition, offering an accurate snapshot of sectoral trends.
█ INDICATOR
The table displays each sector's ticker and full name, following official GICS terminology and SPDR color coding. It also shows percentage performance, calculated daily on intraday charts or based on the selected time frame.
Users can sort the table by either percentage performance or the relative weight of each ETF in the S&P 500. The default weight values reflect data updated as of 17 April 2025, and can be manually adjusted based on the most recent sector weightings available on the official SPDR website.

RNDR Reentry SystemStrategy for Render for daily trading
It helps getting in and out depending on volume, shape of the candles in the chart, uptrend, Overbought and oversold signals.

XAUUSD IST SessionsThe script is designed to highlight specific time zones on your chart based on Indian Standard Time (IST):
✅ Morning session: 5:30 AM to 7:30 AM IST
✅ Evening session: 7:00 PM to 9:00 PM IST
Since TradingView scripts work on UTC (Coordinated Universal Time), we convert IST to UTC first.
📦 Breakdown of the Code:
🟦 indicator("XAUUSD IST Sessions", overlay=true)
This line tells TradingView to create a custom indicator and draw it on the price chart (overlay=true).

CandlestickUtilitiesThis library provides essential functions for candlestick chart analysis and pattern recognition in Pine Script®.
It includes:
• Candle structure analysis (bodies, shadows, lengths)
• Trend detection using EMAs
• Common candlestick pattern recognition
This library is under construction.
Designed to support strategy development and improve signal accuracy for traders.
Created by @xprophetx — under MPL-2.0 license.

Tinchy- MTF Extreme RSI Flowershow extreme RSI flowers on K-line when RSI value > 70 or <30
RSI 60 == 1h
RSI 240 == 4h
RSI 1440 == 1d


centered_rsiLibrary "centered_rsi"
This script defines a custom "Centered RSI" indicator. It calculates the RSI based on the deviation of price from a selected moving average (SMA, EMA, HMA, or ALMA). The MA smooths the price, and the RSI is applied to the centered values (price minus MA), aiming to highlight momentum relative to trend. The indicator includes user inputs for MA type and lengths, and plots the RSI along with reference lines at 30, 50, and 70.
ma(source, length, ma_type, offset, sigma)
Parameters:
source (float)
length (simple int)
ma_type (string)
offset (simple float)
sigma (simple float)
centered_rsi(source, type_ma, length_ma, length_rsi)
Parameters:
source (float)
type_ma (string)
length_ma (simple int)
length_rsi (simple int)

Visionary Insights (200 EMA on 1H + 20 EMA on 15m)How to use this script?
Open the 15 min chart and u will see the 200 EMA from the 1 hour chart and the 20 EMA of the 15 min chart
Trend Filter (1H Timeframe):
Price must be above the 200 EMA for a bullish setup
Price must be below the 200 EMA for a bearish setup
Entry Conditions (15m Timeframe):
Bullish:
Pullback to 20 EMA (close is near or below EMA 20)
RSI > 50
Bullish engulfing pattern
Bearish:
Pullback to 20 EMA (close is near or above EMA 20)
RSI < 50
Bearish engulfing pattern

Anchored VWAP - RTH + ON + Previous VWAPCash Session Anchored VWAP, Overnight Anchored VWAP, and Prior Day VWAP as a price level

VWAP Bounce & Squeeze- VWAP
- 20/50 EMA
- 15 min Opening Range
- volume spike and candle body simulating Bookmap/DOM
- custom confluence detection for VWAP, EMA, candle structure
- signals for long and short opportunities
- automated risk/reward boxes
- automated trailing stop suggestions

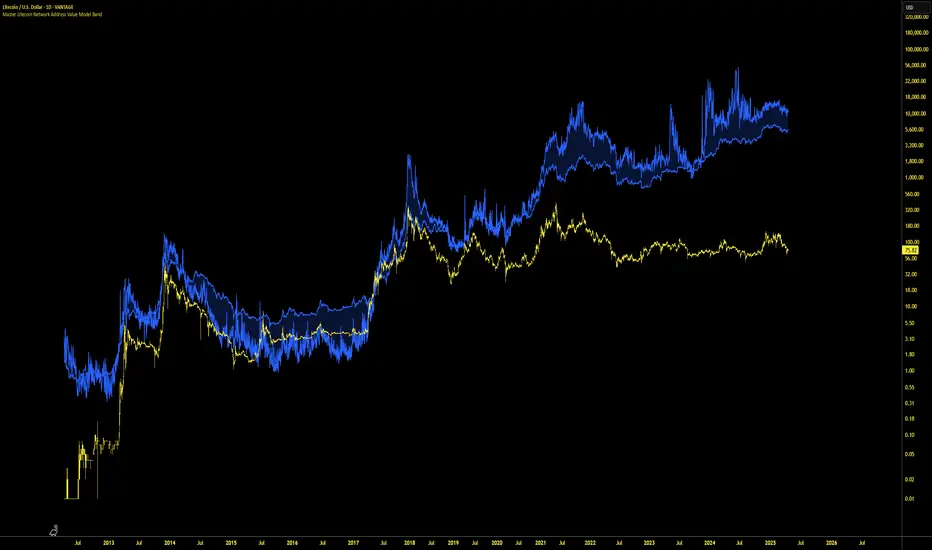
Master Litecoin Network Address Value Model BandThe Master Litecoin Network Address Value Model Band indicator compares Litecoin (LTC) and Bitcoin (BTC) network address activity to estimate LTC's value relative to BTC's price. It plots a band using new and total address ratios, adjusted by supply differences. Note: It excludes Litecoin's MWEB addresses, likely undervaluing the Litecoin network over time as MWEB adoption grows.
Master Litecoin Network Growth BandsThe "Master Litecoin Network Growth Bands" indicator (Pine Script v5) plots 26 horizontal bands on the Litecoin price chart (VANTAGE:LTCUSD) by dividing IntoTheBlock’s total Litecoin addresses by divisors (400 to 20,000,000). Each band (Band1 to Band26) is drawn with a white, thin line (linewidth=1), showing network growth relative to price to help identify support, resistance, or valuation levels. Note that this indicator does not include addresses on Litecoin’s MWEB (MimbleWimble Extension Blocks).

Master Litecoin Miner Sell PressureThe "Master Litecoin Miner Sell Pressure" indicator (Pine Script v5) tracks Litecoin miner selling pressure by comparing 14-day miner outflows to reserves, using IntoTheBlock data. It highlights high sell pressure with a blue background when the metric exceeds a 200-day Bollinger Band upper threshold, signaling potential bearish price pressure. Licensed under Mozilla Public License 2.0, adapted from © capriole_charles' Bitcoin indicator.

S5TW/S5FI/S5TH [SP500]This indicator plots three key S&P 500 breadth indices (S5TW, S5FI, S5TH), helping traders quickly identify market breadth conditions. Oversold (green background) and overbought (red background) conditions are highlighted based on customizable threshold levels, enhancing visual clarity for market timing.

Full‑Featured Multi‑Signal Strategy By Andi TanThis is my first strategy indicator, please try the backtest and use it, hopefully it will be useful

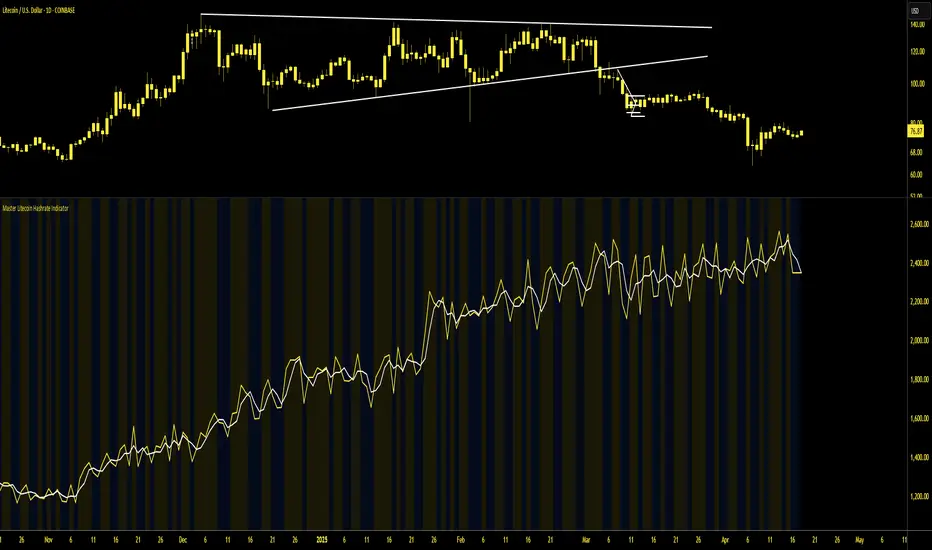
Master Litecoin Hashrate IndicatorThis script is a custom indicator called "Master Litecoin Hashrate Indicator," designed to track and visualize Litecoin's hashrate trends in the form of both a moving average and raw hashrate data. Here’s a breakdown of how it works:
Overview:
Indicator Type: It’s an overlay set to false, meaning it won’t be plotted directly on the price chart but on a separate pane beneath it.
Litecoin Hashrate: This tracks the computational power used to mine Litecoin, in PH/s (Peta Hashes per second).
Key Components:
Inputs:
ma_length: This is the length of the moving average, calculated as half of 7 (which equals 3.5), to smooth out the hashrate data.
Hashrate Data:
hashrate: The script pulls real-time Litecoin hashrate data using the INTOTHEBLOCK:LTC_HASHRATE security symbol from TradingView.
ma_hashrate: A simple moving average (SMA) is applied to the raw hashrate data over the defined period (ma_length), helping to smooth out short-term fluctuations.
Plotting:
hashrate: The raw hashrate is plotted in yellow with a linewidth of 2.
ma_hashrate: The moving average of the hashrate is plotted in white with a linewidth of 2.
Background Color:
The background color changes dynamically depending on the relationship between the raw hashrate and its moving average:
If the raw hashrate is greater than the moving average, the background turns a yellow color (with 90% transparency).
If the raw hashrate is less than the moving average, the background turns blue (with 90% transparency).
If they are equal, there is no background color change.
Purpose:
This indicator helps to visualize the current hashrate trends and compare them with the longer-term moving average. By doing so, it can highlight periods where the hashrate is either increasing or decreasing significantly, giving traders insights into network activity and mining strength.