HMA Crossover 1H with RSI, Stochastic RSI, and Trailing StopThe strategy script provided is a trading algorithm designed to help traders make informed buy and sell decisions based on certain technical indicators. Here’s a breakdown of what each part of the script does and how the strategy works:
Key Components:
Hull Moving Averages (HMA):
HMA 5: This is a Hull Moving Average calculated over 5 periods. HMAs are used to smooth out price data and identify trends more quickly than traditional moving averages.
HMA 20: This is another HMA but calculated over 20 periods, providing a broader view of the trend.
Relative Strength Index (RSI):
RSI 14: This is a momentum oscillator that measures the speed and change of price movements over a 14-period timeframe. It helps identify overbought or oversold conditions in the market.
Stochastic RSI:
%K: This is the main line of the Stochastic RSI, which combines the RSI and the Stochastic Oscillator to provide a more sensitive measure of overbought and oversold conditions. It is smoothed with a 3-period simple moving average.
Trading Signals:
Buy Signal:
Generated when the 5-period HMA crosses above the 20-period HMA, indicating a potential upward trend.
Additionally, the RSI must be below 45, suggesting that the market is not overbought.
The Stochastic RSI %K must also be below 39, confirming the oversold condition.
Sell Signal:
Generated when the 5-period HMA crosses below the 20-period HMA, indicating a potential downward trend.
The RSI must be above 60, suggesting that the market is not oversold.
The Stochastic RSI %K must also be above 63, confirming the overbought condition.
Trailing Stop Loss:
This feature helps protect profits by automatically selling the position if the price moves against the trade by 5%.
For sell positions, an additional trailing stop of 100 points is included.
Осцилляторы

Advanced Gold Scalping Strategy with RSI Divergence# Advanced Gold Scalping Strategy with RSI Divergence
## Overview
This Pine Script implements an advanced scalping strategy for gold (XAUUSD) trading, primarily designed for the 1-minute timeframe. The strategy utilizes the Relative Strength Index (RSI) indicator along with its moving average to identify potential trade setups based on divergences between price action and RSI movements.
## Key Components
### 1. RSI Calculation
- Uses a customizable RSI length (default: 60)
- Allows selection of the source for RSI calculation (default: close price)
### 2. Moving Average of RSI
- Supports multiple MA types: SMA, EMA, SMMA (RMA), WMA, VWMA, and Bollinger Bands
- Customizable MA length (default: 3)
- Option to display Bollinger Bands with adjustable standard deviation multiplier
### 3. Divergence Detection
- Implements both bullish and bearish divergence identification
- Uses pivot high and pivot low points to detect divergences
- Allows for customization of lookback periods and range for divergence detection
### 4. Entry Conditions
- Long Entry: Bullish divergence when RSI is below 40
- Short Entry: Bearish divergence when RSI is above 60
### 5. Trade Management
- Stop Loss: Customizable, default set to 11 pips
- Take Profit: Customizable, default set to 33 pips
### 6. Visualization
- Plots RSI line and its moving average
- Displays horizontal lines at 30, 50, and 70 RSI levels
- Shows Bollinger Bands when selected
- Highlights divergences with "Bull" and "Bear" labels on the chart
## Input Parameters
- RSI Length: Adjusts the period for RSI calculation
- RSI Source: Selects the price source for RSI (close, open, high, low, hl2, hlc3, ohlc4)
- MA Type: Chooses the type of moving average applied to RSI
- MA Length: Sets the period for the moving average
- BB StdDev: Adjusts the standard deviation multiplier for Bollinger Bands
- Show Divergence: Toggles the display of divergence labels
- Stop Loss: Sets the stop loss distance in pips
- Take Profit: Sets the take profit distance in pips
## Strategy Logic
1. **RSI Calculation**:
- Computes RSI using the specified length and source
- Calculates the chosen type of moving average on the RSI
2. **Divergence Detection**:
- Identifies pivot points in both price and RSI
- Checks for higher lows in RSI with lower lows in price (bullish divergence)
- Checks for lower highs in RSI with higher highs in price (bearish divergence)
3. **Trade Entry**:
- Enters a long position when a bullish divergence is detected and RSI is below 40
- Enters a short position when a bearish divergence is detected and RSI is above 60
4. **Position Management**:
- Places a stop loss order at the entry price ± stop loss pips (depending on the direction)
- Sets a take profit order at the entry price ± take profit pips (depending on the direction)
5. **Visualization**:
- Plots the RSI and its moving average
- Draws horizontal lines for overbought/oversold levels
- Displays Bollinger Bands if selected
- Shows divergence labels on the chart for identified setups
## Usage Instructions
1. Apply the script to a 1-minute XAUUSD (Gold) chart in TradingView
2. Adjust the input parameters as needed:
- Increase RSI Length for less frequent but potentially more reliable signals
- Modify MA Type and Length to change the sensitivity of the RSI moving average
- Adjust Stop Loss and Take Profit levels based on current market volatility
3. Monitor the chart for Bull (long) and Bear (short) labels indicating potential trade setups
4. Use in conjunction with other analysis and risk management techniques
## Considerations
- This strategy is designed for short-term scalping and may not be suitable for all market conditions
- Always backtest and forward test the strategy before using it with real capital
- The effectiveness of divergence-based strategies can vary depending on market trends and volatility
- Consider using additional confirmation signals or filters to improve the strategy's performance
Remember to adapt the strategy parameters to your risk tolerance and trading style, and always practice proper risk management.

Chande Momentum Oscillator (CMO) Buy Sell Strategy [TradeDots]The "Chande Momentum Oscillator (CMO) Buy Sell Strategy" leverages the CMO indicator to identify short-term buy and sell opportunities.
HOW DOES IT WORK
The standard CMO indicator measures the difference between recent gains and losses, divided by the total price movement over the same period. However, this version of the CMO has some limitations.
The primary disadvantage of the original CMO is its responsiveness to short-term volatility, making the signals less smooth and more erratic, especially in fluctuating markets. This instability can lead to misleading buy or sell signals.
To address this, we integrated the concept from the Moving Average Convergence Divergence (MACD) indicator. By applying a 9-period exponential moving average (EMA) to the CMO line, we obtained a smoothed signal line. This line acts as a filter, identifying confirmed overbought or oversold states, thereby reducing the number of false signals.
Similar to the MACD histogram, we generate columns representing the difference between the CMO and its signal line, reflecting market momentum. We use this momentum indicator as a criterion for entry and exit points. Trades are executed when there's a convergence of CMO and signal lines during an oversold state, and they are closed when the CMO line diverges from the signal line, indicating increased selling pressure.
APPLICATION
Since the 9-period EMA smooths the CMO line, it's less susceptible to extreme price fluctuations. However, this smoothing also makes it more challenging to breach the original +50 and -50 benchmarks.
To increase trading opportunities, we've tightened the boundary ranges. Users can customize the target benchmark lines in the settings to adjust for the volatility of the underlying asset.
The 'cool down period' is essentially the number of bars that await before the next signal generation. This feature is employed to dodge the occurrence of multiple signals in a short period.
DEFAULT SETUP
Commission: 0.01%
Initial Capital: $10,000
Equity per Trade: 80%
Signal Cool Down Period: 5
RISK DISCLAIMER
Trading entails substantial risk, and most day traders incur losses. All content, tools, scripts, articles, and education provided by TradeDots serve purely informational and educational purposes. Past performances are not definitive predictors of future results.
Custom Signal Oscillator StrategyThe CSO is made to help traders easily test their theories by subtracting the difference between two customizable plots(indicators) without having to search for strategies. The general purpose is to provide a tool to users without coding knowledge.
How to use :
Apply the indicator(s) to test
Go to the CSO strategy input settings and select the desired plots from the added indicators. (The back test will enter long or short depending on the fast signal crosses on the slow signal)
Pull up the strategy tester
Adjust the input settings on the selected indicator(s) to back test
For example, the published strategy is using the basis lines from two Donchian channels with varying length. This can be utilized with multiple overlays on the chart and oscillators that are operating on the same scale with each other. Since chart glows aren't extremely common, a glow option is included to stand out on the chart as the chain operator. A long only option for is also included for versatility.

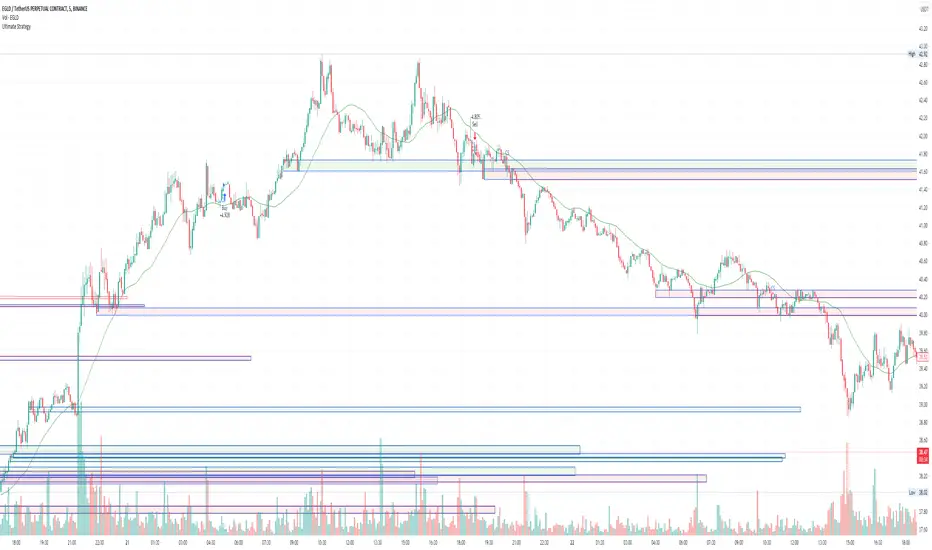
Ultimate Trading StrategyDescription:
In this TradingView Pine Script publication, we introduce a powerful tool designed to enhance your trading strategies by combining the Exponential Moving Average (EMA) and the Relative Strength Index (RSI). This strategy is specifically tailored for the EGLD/USDT.P pair on Binance, using a 5-minute interval to capture timely trading opportunities in a volatile market.
Key Features:
Combining EMA and RSI for Robust Signals
This script combines the EMA, which helps identify the overall trend direction, with the RSI, which measures the speed and change of price movements to identify overbought and oversold conditions.
The combination ensures that you get high-probability signals by leveraging both trend-following and momentum-based indicators.
Multiple Timeframe Analysis
Analyze the EMA and RSI across different timeframes to gain a comprehensive view of market conditions and make more informed trading decisions.
Reversing and Extending Signals
Reverse signals generated by indicators to adapt to various market conditions.
Extend signals by specifying conditions such as "RSI cross AND EMA cross WITHIN 2 bars" to capture more nuanced trading opportunities.
Backtesting and Risk Management
Evaluate the performance of your strategies by feeding the results into a backtesting engine.
The strategy risks a maximum of 10% of the account on a single trade to maintain sustainable risk levels.
Available Indicators:
EMA (Exponential Moving Average)
Helps identify the overall trend direction.
Signals:
Long Entry: When the price closes above the EMA.
Short Entry: When the price closes below the EMA.
RSI (Relative Strength Index)
Measures the speed and change of price movements.
Signals:
Long Entry: When RSI is below the oversold level (30).
Short Entry: When RSI is above the overbought level (70).
How It Works:
Long Entry: A buy signal is generated when the price closes above the EMA and the RSI is below the oversold level (30). This indicates that the price is in an upward trend and temporarily oversold, presenting a potential buying opportunity.
Short Entry: A sell signal is generated when the price closes below the EMA and the RSI is above the overbought level (70). This indicates that the price is in a downward trend and temporarily overbought, presenting a potential selling opportunity.
Close Long Position: The script closes long positions when the conditions for a short entry are met.
Close Short Position: The script closes short positions when the conditions for a long entry are met.
Parameters:
EMA Length: 20 (default)
RSI Length: 14 (default)
RSI Overbought Level: 70 (default)
RSI Oversold Level: 30 (default)
Initial Capital: 10,000 USDT (default) – Realistic starting capital for an average trader.
Commission: 0.1% (default) – Reflects typical trading commissions.
Slippage: 0.5 ticks (default) – Accounts for market conditions and potential price slippage during order execution.
Backtesting:
Trading Range: – Ensure that the dataset used covers a significant period to generate a sufficient number of trades.
Dataset Limitation: Due to TradingView Premium's limitation of backtesting only 20,000 candles, it may not be possible to generate more than 100 trades. This limitation affects the statistical relevance of the backtesting results, but the strategy has been tested to provide meaningful insights within these constraints.
Use Case:
This strategy combines the EMA and RSI to identify potential trading opportunities by detecting trend direction and overbought/oversold conditions. It is particularly effective in volatile markets where quick trend reversals are common.
How to Use:
Set the parameters according to your preference or use the default values.
Run the script on the EGLD/USDT.P pair with a 5-minute interval.
Monitor the signals and adjust your trades accordingly.
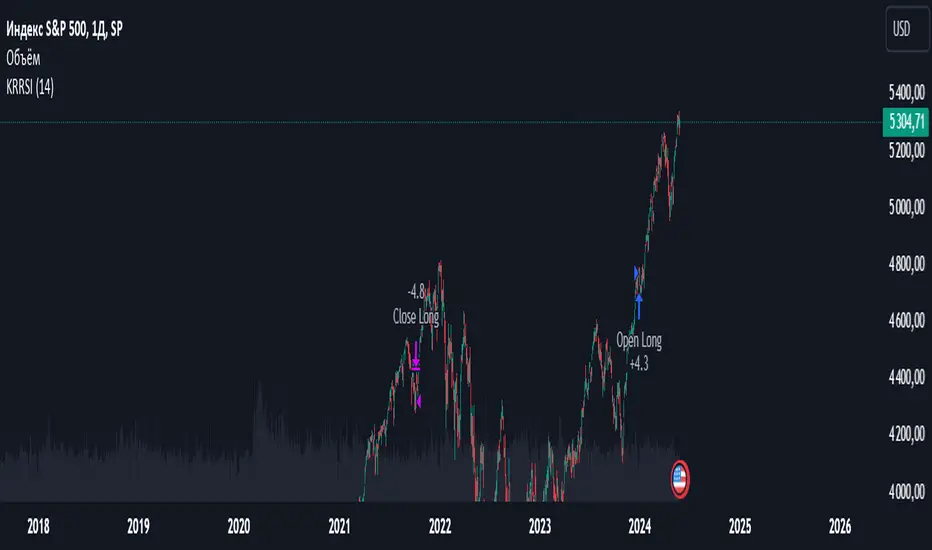
Korneev Reverse RSIRethinking the Legendary Relative Strength Index by John Welles Wilder
The essence of the new approach lies in the reverse use of the so-called "overbought" and "oversold" zones. In his 1978 book, "New Concepts in Technical Trading Systems," where the RSI mechanism was thoroughly described, Wilder writes that one way to use the oscillator is to open a long position when the RSI drops into oversold territory (below 30) and to open a short position when the RSI rises to overbought levels (above 70). However, backtesting this strategy with such inputs yields rather mediocre results.
Based on the calculation formula, the RSI calculates the rate of price change over a certain period. Therefore, overbought and oversold zones will have relative significance (relative to the set calculation period). It is no coincidence that the word "relative" was added to the name of the oscillator. It is worth accepting as an axiom the assertion that the price of an asset is fair at every moment in time.
Essentially, the RSI calculates the strength of a trend. If the oscillator value is above 70, it is highly likely that an upward movement is occurring in the market. Therefore, in the current strategy, a long position is opened precisely at the moment of greatest buyer strength (when RSI > 80), i.e., in the direction of the trend, since counter-trend trading with the RSI has proven to be ineffective. The position is closed after the buyers lose their advantage and the RSI drops to 40.
The strategy is recommended to be used only with long positions, as short positions show negative results. The strategy uses a moving average for the RSI with a period of 14 to smooth the oscillator data.
--------------------------------------------------------------------------------------------
Переосмысление легендарного осциллятора Relative strength index Джона Уэллса Уайлдера
Суть нового подхода заключается в реверсивном использовании так называемых зон "перекупленности" и "перепроданности". В своей книге от 1978 года "New concepts in tecnical trading systems", в которой был подробно описан механизм работы RSI, Уайлдер пишет, что один из способов использования осциллятора - открытие длинной позиции при снижении RSI в перепроданность (ниже 30) и открытие короткой позиции при повышении RSI до перекупленности (выше 70). Однако бэктест стратегии с такими вводными дает весьма посредственные результаты.
Исходя из формулы расчета, RSI рассчитывает скорость изменения цены за определенный период. Поэтому зоны перекупленности и перепроданности будут иметь относительное значение (относительно установленного периода расчета). Не зря ведь в названии осциллятора было добавлено слово "относительной". Стоит принять за аксиому утверждение, что цена актива справедлива в каждый момент времени.
По сути, RSI рассчитывает силу тренда. Если значение осциллятора выше 70, то на рынке с высокой долей вероятности происходит восходящее движение. Поэтому в текущей стратегии открытие лонга происходит именно в момент наибольшей силы покупателей (когда RSI > 80), то есть в сторону тренда, поскольку контртрендовая торговля по RSI показала свою несостоятельность. Закрытие позиции происходит после того, как покупатели теряют преимущество и RSI снижается до 40.
Стратегию рекомендуется использовать только с длинными позициями, поскольку короткие позиции показывают отрицательный результат. В стратегии используется скользящая средняя для RSI с периодом 14 для сглаживания данных осциллятора.
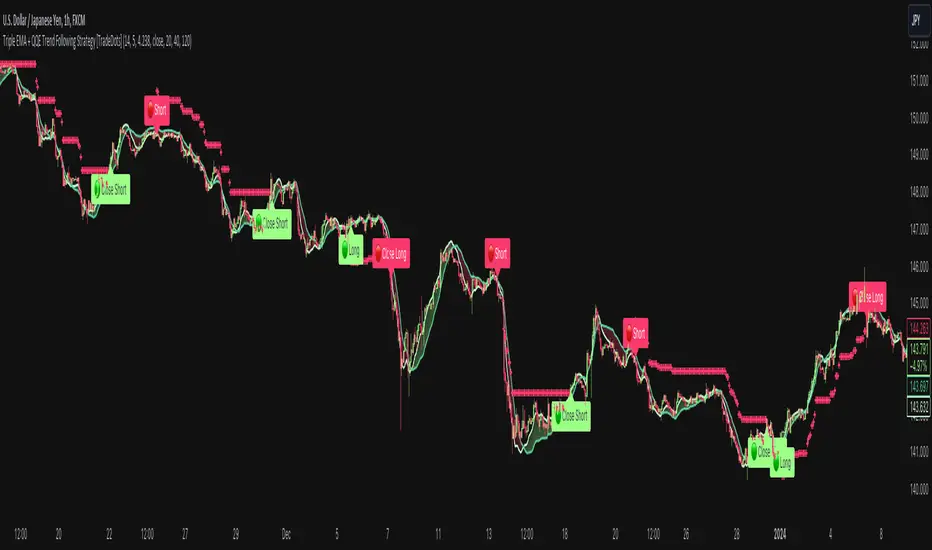
Triple EMA + QQE Trend Following Strategy [TradeDots]The "Triple EMA + QQE Trend Following Strategy" harnesses the power of two sophisticated technical indicators, the Triple Exponential Moving Average (TEMA) and the Qualitative Quantitative Estimation (QQE), to generate precise buy and sell signals. This strategy excels in capturing shifts in trends by identifying short-term price momentum and dynamic overbought or oversold conditions.
HOW IT WORKS
This strategy integrates two pivotal indicators:
Triple Exponential Moving Average (TEMA): TEMA enhances traditional moving averages by reducing lag and smoothing the data more effectively. It achieves this by applying the EMA formula three times onto the price, as follows:
tema(src, length) =>
ema1 = ta.ema(src, length)
ema2 = ta.ema(ema1, length)
ema3 = ta.ema(ema2, length)
tema = 3*ema1 - 3*ema2 + ema3
This computation helps to sharpen the sensitivity to price movements.
Qualitative Quantitative Estimation (QQE): The QQE indicator improves upon the standard RSI by incorporating a smoothing mechanism. It starts with the standard RSI, overlays a 5-period EMA on this RSI, and then enhances the result using a double application of a 27-period EMA. A slow trailing line is then derived by multiplying the result with a factor number. This approach establishes a more refined and less jittery trend-following signal, complementing the TEMA to enhance overall market timing during fluctuating conditions.
APPLICATION
Referenced from insights on "Trading Tact," the strategy implementation follows:
First of all, we utilize two TEMA lines: one set at a 20-period and the other at a 40-period. Then following the rules below:
40-period TEMA is rising
20-period TEMA is above 40-period TEMA
Price closes above 20-period TEMA
Today is not Monday
RSI MA crosses the Slow trailing line
This strategy does not employ an active take profit mechanism; instead, it utilizes a trailing stop loss to allow the price to reach the stop loss naturally, thereby maximizing potential profit margins.
DEFAULT SETUP
Commission: 0.01%
Initial Capital: $10,000
Equity per Trade: 80%
Users are advised to adjust and personalize this trading strategy to better match their individual trading preferences and style.
RISK DISCLAIMER
Trading entails substantial risk, and most day traders incur losses. All content, tools, scripts, articles, and education provided by TradeDots serve purely informational and educational purposes. Past performances are not definitive predictors of future results.
Reference:
Trading Tact. What Is the QQE Indicator? Retrieved from: tradingtact.com
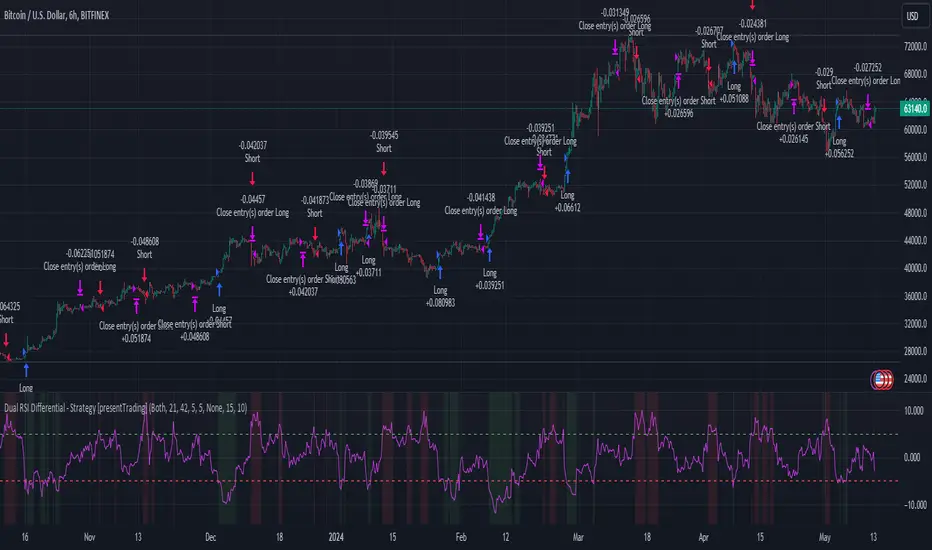
Dual RSI Differential - Strategy [presentTrading]█ Introduction and How it is Different
The Dual RSI Differential Strategy introduces a nuanced approach to market analysis and trading decisions by utilizing two Relative Strength Index (RSI) indicators calculated over different time periods. Unlike traditional strategies that employ a single RSI and may signal premature or delayed entries, this method leverages the differential between a shorter and a longer RSI. This approach pinpoints more precise entry and exit points, providing a refined tool for traders to exploit market conditions effectively, particularly in overbought and oversold scenarios.
Most important: it is a good eductional code for swing trading.
For beginners, this Pine Script provides a complete function that includes crucial elements such as holding days and the option to configure take profit/stop loss settings:
- Hold Days: This feature ensures that trades are not exited too hastily, helping traders to ride out short-term market volatility. It's particularly valuable for swing trading where maintaining positions slightly longer can lead to capturing significant trends.
- TPSL Condition (None by default): This setting allows traders to focus solely on the strategy's robust entry and exit signals without being constrained by preset profit or loss limits. This flexibility is crucial for learning to adjust strategy settings based on personal risk tolerance and market observations.
BTCUSD 6h LS Performance
█ Strategy, How It Works: Detailed Explanation
🔶 RSI Calculation:
The RSI is a momentum oscillator that measures the speed and change of price movements. It is calculated using the formula:
RSI = 100 - (100 / (1 + RS))
Where RS (Relative Strength) = Average Gain of up periods / Average Loss of down periods.
🔶 Dual RSI Setup:
This strategy involves two RSI indicators:
RSI_Short (RSI_21): Calculated over a short period (21 days).
RSI_Long (RSI_42): Calculated over a longer period (42 days).
Differential Calculation:
The strategy focuses on the differential between these two RSIs:
RSI Differential = RSI_Long - RSI_Short
This differential helps to identify when the shorter-term sentiment diverges from longer-term trends, signaling potential trading opportunities.
BTCUSD Local picuture
🔶 Signal Triggers:
Entry Signal: A buy (long) signal is triggered when the RSI Differential exceeds -5, suggesting strengthening short-term momentum. Conversely, a sell (short) signal occurs when the RSI Differential falls below +5, indicating weakening short-term momentum.
Exit Signal: Trades are generally exited when the RSI Differential reverses past these thresholds, indicating a potential momentum shift.
█ Trade Direction
This strategy accommodates various trading preferences by allowing selections among long, short, or both directions, thus enabling traders to capitalize on diverse market movements and volatility.
█ Usage
The Dual RSI Differential Strategy is particularly suited for:
Traders who prefer a systematic approach to capture market trends.
Those who seek to minimize risks associated with rapid and unexpected market movements.
Traders who value strategies that can be finely tuned to different market conditions.
█ Default Settings
- Trading Direction: Both — allows capturing of upward and downward market movements.
- Short RSI Period: 21 days — balances sensitivity to market movements.
- Long RSI Period: 42 days — smoothens out longer-term fluctuations to provide a clearer market trend.
- RSI Difference Level: 5 — minimizes false signals by setting a moderate threshold for action.
Use Hold Days: True — introduces a temporal element to trading strategy, holding positions to potentially enhance outcomes.
- Hold Days: 5 — ensures that trades are not exited too hastily, helping to ride out short-term volatility.
- TPSL Condition: None — enables traders to focus solely on the strategy's entry and exit signals without preset profit or loss limits.
- Take Profit Percentage: 15% — aims for significant market moves to lock in profits.
- Stop Loss Percentage: 10% — safeguards against large losses, essential for long-term capital preservation.
Multi Timeframe RSI Buy Sell Strategy [TradeDots]The "Multi Timeframe RSI Buy/Sell Strategy" is a trading strategy that utilizes Relative Strength Index (RSI) indicators from multiple timeframes to provide buy and sell signals.
This strategy allows for extensive customization, supporting up to three distinct RSIs, each configurable with its own timeframe, length, and data source.
HOW DOES IT WORK
This strategy integrates up to three RSIs, each selectable from different timeframes and customizable in terms of length and source. Users have the flexibility to define the number of active RSIs. These selections visualize as plotted lines on the chart, enhancing interpretability.
Users can also manage the moving average of the selected RSI lines. When multiple RSIs are active, the moving average is calculated based on these active lines' average value.
The color intensity of the moving average line changes as it approaches predefined buying or selling thresholds, alerting users to potential signal generation.
A buy or sell signal is generated when all active RSI lines simultaneously cross their respective threshold lines. Concurrently, a label will appear on the chart to signify the order placement.
For those preferring not to display order information or activate the strategy, an "Enable backtest" option is provided in the settings for toggling activation.
APPLICATION
The strategy leverages multiple RSIs to detect extreme market conditions across various timeframes without the need for manual timeframe switching.
This feature is invaluable for identifying divergences across timeframes, such as detecting potential short-term reversals within broader trends, thereby aiding traders in making better trading decisions and potentially avoiding losses.
DEFAULT SETUP
Commission: 0.01%
Initial Capital: $10,000
Equity per Trade: 60%
RISK DISCLAIMER
Trading entails substantial risk, and most day traders incur losses. All content, tools, scripts, articles, and education provided by TradeDots serve purely informational and educational purposes. Past performances are not definitive predictors of future results.
TradeDots Stochastic Z-Score

Stochastic Z-Score Oscillator Strategy [TradeDots]The "Stochastic Z-Score Oscillator Strategy" represents an enhanced approach to the original "Buy Sell Strategy With Z-Score" trading strategy. Our upgraded Stochastic model incorporates an additional Stochastic Oscillator layer on top of the Z-Score statistical metrics, which bolsters the affirmation of potential price reversals.
We also revised our exit strategy to when the Z-Score revert to a level of zero. This amendment gives a much smaller drawdown, resulting in a better win-rate compared to the original version.
HOW DOES IT WORK
The strategy operates by calculating the Z-Score of the closing price for each candlestick. This allows us to evaluate how significantly the current price deviates from its typical volatility level.
The strategy first takes the scope of a rolling window, adjusted to the user's preference. This window is used to compute both the standard deviation and mean value. With these values, the strategic model finalizes the Z-Score. This determination is accomplished by subtracting the mean from the closing price and dividing the resulting value by the standard deviation.
Following this, the Stochastic Oscillator is utilized to affirm the Z-Score overbought and oversold indicators. This indicator operates within a 0 to 100 range, so a base adjustment to match the Z-Score scale is required. Post Stochastic Oscillator calculation, we recalibrate the figure to lie within the -4 to 4 range.
Finally, we compute the average of both the Stochastic Oscillator and Z-Score, signaling overpriced or underpriced conditions when the set threshold of positive or negative is breached.
APPLICATION
Firstly, it is better to identify a stable trading pair for this technique, such as two stocks with considerable correlation. This is to ensure conformance with the statistical model's assumption of a normal Gaussian distribution model. The ideal performance is theoretically situated within a sideways market devoid of skewness.
Following pair selection, the user should refine the span of the rolling window. A broader window smoothens the mean, more accurately capturing long-term market trends, while potentially enhancing volatility. This refinement results in fewer, yet precise trading signals.
Finally, the user must settle on an optimal Z-Score threshold, which essentially dictates the timing for buy/sell actions when the Z-Score exceeds with thresholds. A positive threshold signifies the price veering away from its mean, triggering a sell signal. Conversely, a negative threshold denotes the price falling below its mean, illustrating an underpriced condition that prompts a buy signal.
Within a normal distribution, a Z-Score of 1 records about 68% of occurrences centered at the mean, while a Z-Score of 2 captures approximately 95% of occurrences.
The 'cool down period' is essentially the number of bars that await before the next signal generation. This feature is employed to dodge the occurrence of multiple signals in a short period.
DEFAULT SETUP
The following is the default setup on EURAUD 1h timeframe
Rolling Window: 80
Z-Score Threshold: 2.8
Signal Cool Down Period: 5
Stochastic Length: 14
Stochastic Smooth Period: 7
Commission: 0.01%
Initial Capital: $10,000
Equity per Trade: 40%
FURTHER IMPLICATION
The Stochastic Oscillator imparts minimal impact on the current strategy. As such, it may be beneficial to adjust the weightings between the Z-Score and Stochastic Oscillator values or the scale of Stochastic Oscillator to test different performance outcomes.
Alternative momentum indicators such as Keltner Channels or RSI could also serve as robust confirmations of overbought and oversold signals when used for verification.
RISK DISCLAIMER
Trading entails substantial risk, and most day traders incur losses. All content, tools, scripts, articles, and education provided by TradeDots serve purely informational and educational purposes. Past performances are not definitive predictors of future results.

GM-8 and ADX Strategy with Second EMADescription:
This TradingView script implements a trading strategy based on the Moving Average (GM-8), the Average Directional Index (ADX), and the second Exponential Moving Average (EMA). The strategy utilizes these indicators to identify potential buy and sell signals on the chart.
Indicators:
GM-8 (Moving Average 8): This indicator calculates the average price of the last 8 periods and is used to identify trends.
ADX (Average Directional Index): The ADX measures the strength of a trend and is used to determine whether the market is moving in a particular direction or not.
Second EMA (Exponential Moving Average): This is an additional EMA line with a period of 59, which is used to provide additional confirmation signals for the trend.
Trading Conditions:
Buy Condition: A buy signal is generated when the closing price is above the GM-8 and the second EMA, and the ADX value is above the specified threshold.
Sell Condition: A sell signal is generated when the closing price is below the GM-8 and the second EMA, and the ADX value is above the specified threshold.
Trading Logic:
If a buy condition is met, a long position is opened with a user-defined lot size.
If a sell condition is met, a short position is opened with the same user-defined lot size.
Positions are closed when the opposite conditions are met.
User Parameters:
Users can adjust the periods for the GM-8, the second EMA, and the ADX, as well as the threshold for the ADX and the lot size according to their preferences.
Note:
This script has been developed for use on a $100,000 account with FTMO, therefore the account size is set to $100,000. Please ensure that the strategy parameters and settings meet the requirements of your trading strategy and carefully review the results before committing real capital.
--------------------------------------------------------------------------------------------------------------
Beschreibung:
Dieses TradingView-Skript implementiert eine Handelsstrategie, die auf dem gleitenden Mittelwert (GM-8), dem Average Directional Index (ADX) und der zweiten exponentiellen gleitenden Durchschnittslinie (EMA) basiert. Die Strategie verwendet diese Indikatoren, um potenzielle Kauf- und Verkaufssignale auf dem Chart zu identifizieren.
Indikatoren:
GM-8 (Gleitender Mittelwert 8): Dieser Indikator berechnet den Durchschnittspreis der letzten 8 Perioden und wird verwendet, um Trends zu identifizieren.
ADX (Average Directional Index): Der ADX misst die Stärke eines Trends und wird verwendet, um festzustellen, ob sich der Markt in eine bestimmte Richtung bewegt oder nicht.
Zweite EMA (Exponential Moving Average): Dies ist eine zusätzliche EMA-Linie mit einer Periode von 59, die verwendet wird, um zusätzliche Bestätigungssignale für den Trend zu liefern.
Handelsbedingungen:
Kaufbedingung: Es wird ein Kaufsignal generiert, wenn der Schlusskurs über dem GM-8 und der zweiten EMA liegt und der ADX-Wert über dem angegebenen Schwellenwert liegt.
Verkaufsbedingung: Es wird ein Verkaufssignal generiert, wenn der Schlusskurs unter dem GM-8 und der zweiten EMA liegt und der ADX-Wert über dem angegebenen Schwellenwert liegt.
Handelslogik:
Wenn eine Kaufbedingung erfüllt ist, wird eine Long-Position mit einer benutzerdefinierten Losgröße eröffnet.
Wenn eine Verkaufsbedingung erfüllt ist, wird eine Short-Position mit derselben benutzerdefinierten Losgröße eröffnet.
Positionen werden geschlossen, wenn die Gegenbedingungen erfüllt sind.
Benutzerparameter:
Benutzer können die Perioden für den GM-8, die zweite EMA und den ADX sowie den Schwellenwert für den ADX und die Losgröße nach ihren eigenen Präferenzen anpassen.
Hinweis:
Dieses Skript wurde für die Verwendung auf einem $100.000-Konto bei FTMO entwickelt, daher ist die Kontogröße auf $100.000 festgelegt. Bitte stellen Sie sicher, dass die Strategieparameter und -einstellungen den Anforderungen Ihrer Handelsstrategie entsprechen und dass Sie die Ergebnisse sorgfältig überprüfen, bevor Sie echtes Kapital einsetzen.

Fine-tune Inputs: Fourier Smoothed Volume zone oscillator WFSVZ0Use this Strategy to Fine-tune inputs for the (W&)FSVZ0 Indicator.
Strategy allows you to fine-tune the indicator for 1 TimeFrame at a time; cross Timeframe Input fine-tuning is done manually after exporting the chart data.
I suggest using "Close all" input False when fine-tuning Inputs for 1 TimeFrame. When you export data to Excel/Numbers/GSheets I suggest using "Close all" input as True, except for the lowest TimeFrame.
MEANINGFUL DESCRIPTION:
The Volume Zone oscillator breaks up volume activity into positive and negative categories. It is positive when the current closing price is greater than the prior closing price and negative when it's lower than the prior closing price. The resulting curve plots through relative percentage levels that yield a series of buy and sell signals, depending on level and indicator direction.
The Wavelet & Fourier Smoothed Volume Zone Oscillator (W&)FSVZO is a refined version of the Volume Zone Oscillator, enhanced by the implementation of the Discrete Fourier Transform . Its primary function is to streamline price data and diminish market noise, thus offering a clearer and more precise reflection of price trends.
By combining the Wavalet and Fourier aproximation with Ehler's white noise histogram, users gain a comprehensive perspective on volume-related market conditions.
HOW TO USE THE INDICATOR:
The default period is 2 but can be adjusted after backtesting. (I suggest 5 VZO length and NoiceR max length 8 as-well)
The VZO points to a positive trend when it is rising above the 0% level, and a negative trend when it is falling below the 0% level. 0% level can be adjusted in setting by adjusting VzoDifference. Oscillations rising below 0% level or falling above 0% level result in a natural trend.
HOW TO USE THE STRATEGY:
Here you fine-tune the inputs until you find a combination that works well on all Timeframes you will use when creating your Automated Trade Algorithmic Strategy. I suggest 4h, 12h, 1D, 2D, 3D, 4D, 5D, 6D, W and M.
When I ndicator/Strategy returns 0 or natural trend , Strategy Closes All it's positions.
ORIGINALITY & USFULLNESS:
Personal combination of Fourier and Wavalet aproximation of a price which results in less noise Volume Zone Oscillator.
The Wavelet Transform is a powerful mathematical tool for signal analysis, particularly effective in analyzing signals with varying frequency or non-stationary characteristics. It dissects a signal into wavelets, small waves with varying frequency and limited duration, providing a multi-resolution analysis. This approach captures both frequency and location information, making it especially useful for detecting changes or anomalies in complex signals.
The Discrete Fourier Transform (DFT) is a mathematical technique that transforms discrete data from the time domain into its corresponding representation in the frequency domain. This process involves breaking down a signal into its individual frequency components, thereby exposing the amplitude and phase characteristics inherent in each frequency element.
This indicator utilizes the concept of Ehler's Universal Oscillator and displays a histogram, offering critical insights into the prevailing levels of market noise. The Ehler's Universal Oscillator is grounded in a statistical model that captures the erratic and unpredictable nature of market movements. Through the application of this principle, the histogram aids traders in pinpointing times when market volatility is either rising or subsiding.
DETAILED DESCRIPTION:
My detailed description of the indicator and use cases which I find very valuable.
What is oscillator?
Oscillators are chart indicators that can assist a trader in determining overbought or oversold conditions in ranging (non-trending) markets.
What is volume zone oscillator?
Price Zone Oscillator measures if the most recent closing price is above or below the preceding closing price.
Volume Zone Oscillator is Volume multiplied by the 1 or -1 depending on the difference of the preceding 2 close prices and smoothed with Exponential moving Average.
What does this mean?
If the VZO is above 0 and VZO is rising. We have a bullish trend. Most likely.
If the VZO is below 0 and VZO is falling. We have a bearish trend. Most likely.
Rising means that VZO on close is higher than the previous day.
Falling means that VZO on close is lower than the previous day.
What if VZO is falling above 0 line?
It means we have a high probability of a bearish trend.
Thus the indicator returns 0 and Strategy closes all it's positions when falling above 0 (or rising bellow 0) and we combine higher and lower timeframes to gauge the trend.
In the next Image you can see that trend is negative on 4h, negative on 12h and positive on 1D. That means trend is negative.
I am sorry, the chart is a bit messy. The idea is to use the indicator over more than 1 Timeframe.
What is approximation and smoothing?
They are mathematical concepts for making a discrete set of numbers a
continuous curved line.
Fourier and Wavelet approximation of a close price are taken from aprox library.
Key Features:
You can tailor the Indicator/Strategy to your preferences with adjustable parameters such as VZO length, noise reduction settings, and smoothing length.
Volume Zone Oscillator (VZO) shows market sentiment with the VZO, enhanced with Exponential Moving Average (EMA) smoothing for clearer trend identification.
Noise Reduction leverages Euler's White noise capabilities for effective noise reduction in the VZO, providing a cleaner and more accurate representation of market dynamics.
Choose between the traditional Fast Fourier Transform (FFT) , the innovative Double Discrete Fourier Transform (DTF32) and Wavelet soothed Fourier soothed price series to suit your analytical needs.
Image of Wavelet transform with FAST settings, Double Fourier transform with FAST settings. Improved noice reduction with SLOW settings, and standard FSVZO with SLOW settings:
Fast setting are setting by default:
VZO length = 2
NoiceR max Length = 2
Slow settings are:
VZO length = 5 or 7
NoiceR max Length = 8
As you can see fast setting are more volatile. I suggest averaging fast setting on 4h 12h 1d 2d 3d 4d W and M Timeframe to get a clear view on market trend.
What if I want long only when VZO is rising and above 15 not 0?
You have set Setting VzoDifference to 15. That reduces the number of trend changes.
Example of W&FSVZO with VzoDifference 15 than 0:
VZO crossed 0 line but not 15 line and that's why Indicator returns 0 in one case an 1 in another.
What is Smooth length setting?
A way of calculating Bullish or Bearish (W&)FSVZO .
If smooth length is 2 the trend is rising if:
rising = VZO > ta.ema(VZO, 2)
Meaning that we check if VZO is higher that exponential average of the last 2 elements.
If smooth length is 1 the trend is rising if:
rising = VZO_ > VZO_
Use this Strategy to fine-tune inputs for the (W&)FSVZO Indicator.
(Strategy allows you to fine-tune the indicator for 1 TimeFrame at a time; cross Timeframe Input fine-tuning is done manually after exporting the chart data)
I suggest using " Close all " input False when fine-tuning Inputs for 1 TimeFrame . When you export data to Excel/Numbers/GSheets I suggest using " Close all " input as True , except for the lowest TimeFrame . I suggest using 100% equity as your default quantity for fine-tune purposes. I have to mention that 100% equity may lead to unrealistic backtesting results. Be avare. When backtesting for trading purposes use Contracts or USDT.

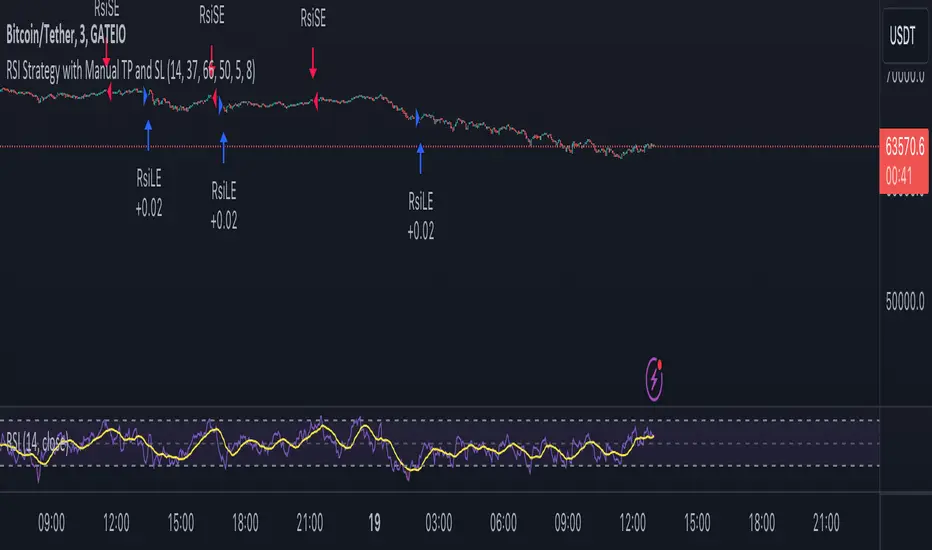
RSI Strategy with Manual TP and SL 19/03/2024This TradingView script implements a simple RSI (Relative Strength Index) strategy with manual take profit (TP) and stop-loss (SL) levels. Let's break down the script and analyze its components:
RSI Calculation: The script calculates the RSI using the specified length parameter. RSI is a momentum oscillator that measures the speed and change of price movements. It ranges from 0 to 100 and typically values above 70 indicate overbought conditions while values below 30 indicate oversold conditions.
Strategy Parameters:
length: Length of the RSI period.
overSold: Threshold for oversold condition.
overBought: Threshold for overbought condition.
trail_profit_pct: Percentage for trailing profit.
Entry Conditions:
For a long position: RSI crosses above 30 and the daily close is above 70% of the highest close in the last 50 bars.
For a short position: RSI crosses below 70 and the daily close is below 130% of the lowest close in the last 50 bars.
Entry Signals:
Long entry is signaled when both conditions for a long position are met.
Short entry is signaled when both conditions for a short position are met.
Manual TP and SL:
Take profit and stop-loss levels are calculated based on the entry price and the specified percentage.
For long positions, the take profit level is set above the entry price and the stop-loss level is set below the entry price.
For short positions, the take profit level is set below the entry price and the stop-loss level is set above the entry price.
Strategy Exits:
Exit conditions are defined for both long and short positions using the calculated take profit and stop-loss levels.
Chart Analysis:
This strategy aims to capitalize on short-term momentum shifts indicated by RSI crossings combined with daily price movements.
It utilizes manual TP and SL levels, providing traders with flexibility in managing their positions.
The strategy may perform well in ranging or oscillating markets where RSI signals are more reliable.
However, it may encounter challenges in trending markets where RSI can remain overbought or oversold for extended periods.
Traders should backtest this strategy thoroughly on historical data and consider optimizing parameters to suit different market conditions.
Risk management is crucial, so traders should carefully adjust TP and SL percentages based on their risk tolerance and market volatility.
Overall, this strategy provides a structured approach to trading based on RSI signals while allowing traders to customize their risk management. However, like any trading strategy, it should be used judiciously and in conjunction with other forms of analysis and risk management techniques.
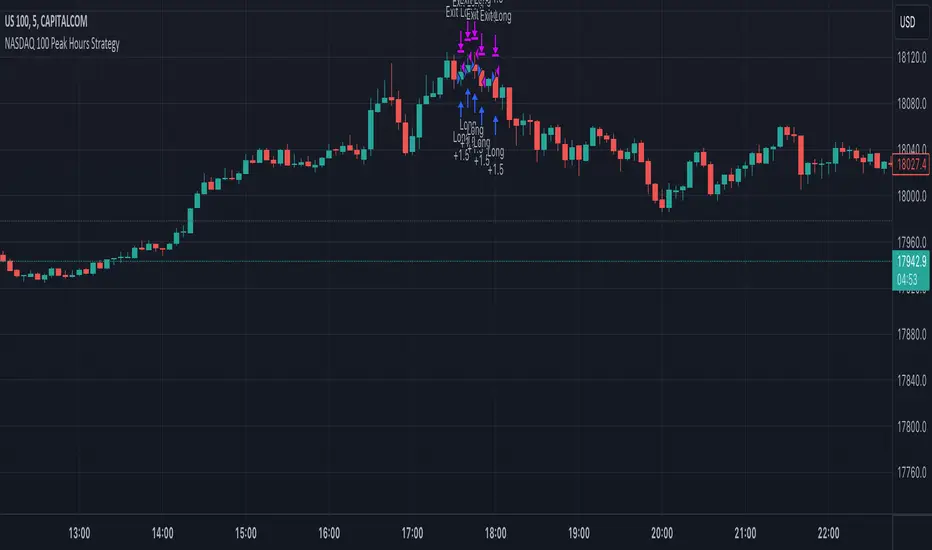
NASDAQ 100 Peak Hours StrategyNASDAQ 100 Peak Hours Trading Strategy
Description
Our NASDAQ 100 Peak Hours Trading Strategy leverages a carefully designed algorithm to trade within specific hours of high market activity, particularly focusing on the first two hours of the trading session from 09:30 AM to 11:30 AM GMT-5. This period is identified for its increased volatility and liquidity, offering numerous trading opportunities.
The strategy incorporates a blend of technical indicators to identify entry and exit points for both long and short positions. These indicators include:
Exponential Moving Averages (EMAs) : A short-term 9-period EMA and a longer-term 21-period EMA to determine the market trend and momentum.
Relative Strength Index (RSI) : A 14-period RSI to gauge the market's momentum.
Average True Range (ATR) : A 14-period ATR to assess market volatility and to set dynamic stop losses and trailing stops.
Volume Weighted Average Price (VWAP) : To identify the market's average price weighted by volume, serving as a benchmark for the trading day.
Our strategy uniquely applies a volatility filter using the ATR, ensuring trades are only executed in conditions that favor our setup. Additionally, we consider the direction of the EMAs to confirm the market's trend before entering trades.
Originality and Usefulness
This strategy stands out by combining these indicators within the NASDAQ 100's peak hours, exploiting the specific market conditions that prevail during these times. The inclusion of a volatility filter and dynamic stop-loss mechanisms based on the ATR provides a robust method for managing risk.
By focusing on the early trading hours, the strategy aims to capture the initial market movements driven by overnight news and the opening rush, often characterized by higher volatility. This approach is particularly useful for traders looking to maximize gains from short-term fluctuations while limiting exposure to longer-term market uncertainty.
Strategy Results
To ensure the strategy's effectiveness and reliability, it has undergone rigorous backtesting over a significant dataset to produce a sample size of more than 100 trades. This testing phase helps in identifying the strategy's potential in various market conditions, its consistency, and its risk-to-reward ratio.
Our backtesting adheres to realistic trading conditions, accounting for slippage and commission to reflect actual trading scenarios accurately. The strategy is designed with a conservative approach to risk management, advising not to risk more than 5-10% of equity on a single trade. The default settings in the script align with these principles, ensuring that users can replicate our tested conditions.
Using the Strategy
The strategy is designed for simplicity and ease of use:
Trade Hours : Focuses on 09:30 AM to 11:30 AM GMT-5, during the NASDAQ 100's peak activity hours.
Entry Conditions : Trades are initiated based on the alignment of EMAs, RSI, VWAP, and the ATR's volatility filter within the designated time frame.
Exit Conditions : Includes dynamic trailing stops based on ATR, a predefined time exit strategy, and a trend reversal exit condition for risk management.
This script is a powerful tool for traders looking to leverage the NASDAQ 100's peak hours, providing a structured approach to navigating the early market hours with a robust set of criteria for making informed trading decisions.
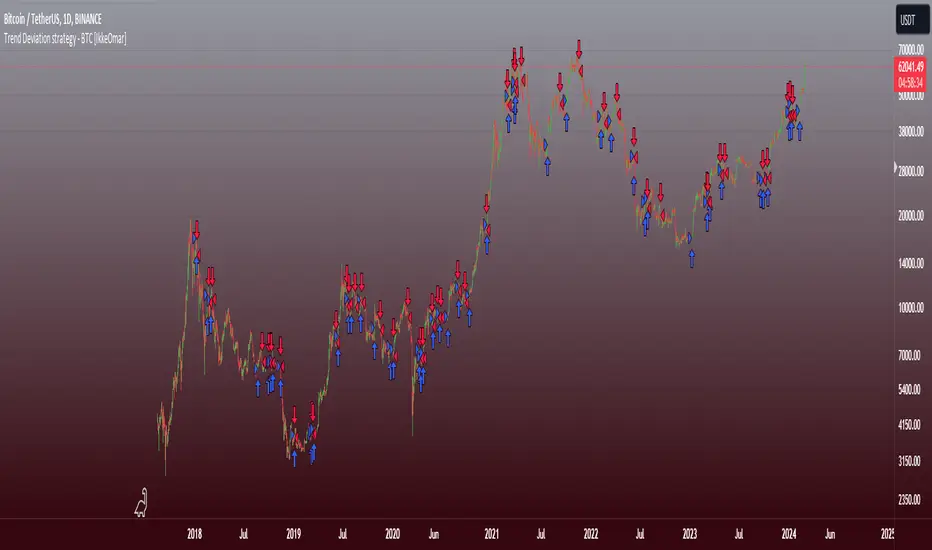
Trend Deviation strategy - BTC [IkkeOmar]Intro:
This is an example if anyone needs a push to get started with making strategies in pine script. This is an example on BTC, obviously it isn't a good strategy, and I wouldn't share my own good strategies because of alpha decay.
This strategy integrates several technical indicators to determine market trends and potential trade setups. These indicators include:
Directional Movement Index (DMI)
Bollinger Bands (BB)
Schaff Trend Cycle (STC)
Moving Average Convergence Divergence (MACD)
Momentum Indicator
Aroon Indicator
Supertrend Indicator
Relative Strength Index (RSI)
Exponential Moving Average (EMA)
Volume Weighted Average Price (VWAP)
It's crucial for you guys to understand the strengths and weaknesses of each indicator and identify synergies between them to improve the strategy's effectiveness.
Indicator Settings:
DMI (Directional Movement Index):
Length: This parameter determines the number of bars used in calculating the DMI. A higher length may provide smoother results but might lag behind the actual price action.
Bollinger Bands:
Length: This parameter specifies the number of bars used to calculate the moving average for the Bollinger Bands. A longer length results in a smoother average but might lag behind the price action.
Multiplier: The multiplier determines the width of the Bollinger Bands. It scales the standard deviation of the price data. A higher multiplier leads to wider bands, indicating increased volatility, while a lower multiplier results in narrower bands, suggesting decreased volatility.
Schaff Trend Cycle (STC):
Length: This parameter defines the length of the STC calculation. A longer length may result in smoother but slower-moving signals.
Fast Length: Specifies the length of the fast moving average component in the STC calculation.
Slow Length: Specifies the length of the slow moving average component in the STC calculation.
MACD (Moving Average Convergence Divergence):
Fast Length: Determines the number of bars used to calculate the fast EMA (Exponential Moving Average) in the MACD.
Slow Length: Specifies the number of bars used to calculate the slow EMA in the MACD.
Signal Length: Defines the number of bars used to calculate the signal line, which is typically an EMA of the MACD line.
Momentum Indicator:
Length: This parameter sets the number of bars over which momentum is calculated. A longer length may provide smoother momentum readings but might lag behind significant price changes.
Aroon Indicator:
Length: Specifies the number of bars over which the Aroon indicator calculates its values. A longer length may result in smoother Aroon readings but might lag behind significant market movements.
Supertrend Indicator:
Trendline Length: Determines the length of the period used in the Supertrend calculation. A longer length results in a smoother trendline but might lag behind recent price changes.
Trendline Factor: Specifies the multiplier used in calculating the trendline. It affects the sensitivity of the indicator to price changes.
RSI (Relative Strength Index):
Length: This parameter sets the number of bars over which RSI calculates its values. A longer length may result in smoother RSI readings but might lag behind significant price changes.
EMA (Exponential Moving Average):
Fast EMA: Specifies the number of bars used to calculate the fast EMA. A shorter period results in a more responsive EMA to recent price changes.
Slow EMA: Determines the number of bars used to calculate the slow EMA. A longer period results in a smoother EMA but might lag behind recent price changes.
VWAP (Volume Weighted Average Price):
Default settings are typically used for VWAP calculations, which consider the volume traded at each price level over a specific period. This indicator provides insights into the average price weighted by trading volume.
backtest range and rules:
You can specify the start date for backtesting purposes.
You can can select the desired trade direction: Long, Short, or Both.
Entry and Exit Conditions:
LONG:
DMI Cross Up: The Directional Movement Index (DMI) indicates a bullish trend when the positive directional movement (+DI) crosses above the negative directional movement (-DI).
Bollinger Bands (BB): The price is below the upper Bollinger Band, indicating a potential reversal from the upper band.
Momentum Indicator: Momentum is positive, suggesting increasing buying pressure.
MACD (Moving Average Convergence Divergence): The MACD line is above the signal line, indicating bullish momentum.
Supertrend Indicator: The Supertrend indicator signals an uptrend.
Schaff Trend Cycle (STC): The STC indicates a bullish trend.
Aroon Indicator: The Aroon indicator signals a bullish trend or crossover.
When all these conditions are met simultaneously, the strategy considers it a favorable opportunity to enter a long trade.
SHORT:
DMI Cross Down: The Directional Movement Index (DMI) indicates a bearish trend when the negative directional movement (-DI) crosses above the positive directional movement (+DI).
Bollinger Bands (BB): The price is above the lower Bollinger Band, suggesting a potential reversal from the lower band.
Momentum Indicator: Momentum is negative, indicating increasing selling pressure.
MACD (Moving Average Convergence Divergence): The MACD line is below the signal line, signaling bearish momentum.
Supertrend Indicator: The Supertrend indicator signals a downtrend.
Schaff Trend Cycle (STC): The STC indicates a bearish trend.
Aroon Indicator: The Aroon indicator signals a bearish trend or crossover.
When all these conditions align, the strategy considers it an opportune moment to enter a short trade.
Disclaimer:
THIS ISN'T AN OPTIMAL STRATEGY AT ALL! It was just an old project from when I started learning pine script!
The backtest doesn't promise the same results in the future, always do both in-sample and out-of-sample testing when backtesting a strategy. And make sure you forward test it as well before implementing it!
Furthermore this strategy uses both trend and mean-reversion systems, that is usually a no-go if you want to build robust trend systems .
Don't hesitate to comment if you have any questions or if you have some good notes for a beginner.
How to force strategies fire exit alerts not reversalsPineScript has gone a long way, from very simple and little-capable scripting language to a robust coding platform with reliable execution endpoints. However, this one small intuitivity glitch is still there and is likely to stay, because it is traditionally justified and quite intuitive for significant group of traders. I'm sharing this workaround in response to frequent inquiries about it.
What's the glitch? When setting alerts on strategies to be synchronized with TradingView's Strategy Tester events, using simple alert messages such as "buy" or "sell" based on entry direction seems straightforward by inserting {{strategy.order.action}} into the Create Alert's "Message" field. Because "buy" or "sell" are exactly the strings produced by {{strategy.order.action}} placeholder. However, complications arise when attempting to EXIT positions without reversing, whether triggered by price levels like Stop Loss or Take Profit, or logical conditions to close trades. Those bricks fall apart, because on such events {{strategy.order.action}} sends the same "sell" for exiting buy positions and "buy" for exiting sell positions, instead of something more differentiating like "closebuy" or "closesell". As a result reversal trades are opened, instead of simply closing the open ones.
This convention harkens back to traditional stock market practices, where traders either bought shares to enter positions or sold them to exit. However, modern trading encompasses diverse instruments like CFDs, indices, and Forex, alongside advanced features such as Stop Loss, reshaping the landscape. Despite these advancements, the traditional nomenclature persists.
And is poised to stay on TradingView as well, so we need a workaround to get a simple strategy going. Luckily it is here and is called alert_message . It is a parameter, which needs to be added into each strategy.entry() / strategy.exit() / strategy.close() function call - each call, which causes Strategy Tester to produce entry or exit orders. As in this example script:
line 12: strategy.entry(... alert_message ="buy")
line 14: strategy.entry(... alert_message ="sell")
line 19: strategy.exit(... alert_message ="closebuy")
line 20: strategy.exit(... alert_message ="closesell")
line 24: strategy.close(... alert_message ="closebuy")
line 26: strategy.close(... alert_message ="closesell")
These alert messages are compatible with the Alerts Syntax of TradingConnector - a tool facilitating auto-execution of TradingView alerts in MetaTrader 4 or 5. Yes, simple alert messages like "buy" / "sell" / "closebuy" / "closesell" suffice to carry the execution of simple strategy, without complex JSON files with multiple ids and such. Other parameters can be added (actually plenty), but they are only option and that's not a part of this story :)
Last thing left to do is to replace "Message" in Create Alert popup with {{strategy.order.alert_message}} . This placeholder transmits the string defined in the PineScript alert_message= parameter, as outlined in this publication. With this workaround, executing closing alerts becomes seamless within PineScript strategies on TradingView.
Disclaimer: this content is purely educational, especially please don't pay attention to backtest results on any timeframe/ticker.

[strategy][1H] SPY slow stochastics
SPY slow stochastics
Overview
The "SPY Auto RSI Stochastics" strategy is designed to leverage a combination of Relative Strength Index (RSI) and Stochastic indicators to identify potential entry and exit points in trading the SPY $SP:SPX.
The technicals:
A simple yet effective strategy for identifying (reversal) trends on SPY (or any asset).
The logic is as follows:
1. Slow stochastics are effective at predicting momentum. They can also be used to effectively identify reversals.
2. A combination of slow and fast RSI (along with an SMA for the fast RSI) can be used to see potential changes in the directional trend of the underlying asset.
3. In order to reduce noise, a band in the middle of RSI values is ignored; think of this as the price converging and potential explosions (sometimes fake) on either side.
4. Outside this noise band, a crossover of fast RSI on slow RSI indicates an upward trend incoming.
5. A crossunder of fast RSI on slow RSI indicates a downward trend incoming.
Strategy Specific Notes -
1. Load this strategy on SPREADEX:SPX on an hourly chart for the best results.
2. This is a generic strategy, use it on anything - index, stocks, etc. You will need to adjust the parameters for the best results.
3. The RSI Upper defines the cutoff for two things -- threshold for entering a long AND exit signal for short. Likewise for RSI Lower.
4. To have alerts on the strategy, add this to your chart, be content with the backtesting results, select "strategy tester", the alert icon, replace the message body with "{{strategy.order.alert_message}}" without the ".
5. In my experience, the strategy won't be immediately profitable upon a signal but it does get there in the backtested results. Intuitively, this makes sense. Reversals take some time to kick in completely.
Inputs
- **slowRSILength**: Length parameter for the slow RSI calculation.
- **fastRSILength**: Length parameter for the fast RSI calculation.
- **smaRSILength**: Length parameter for the Simple Moving Average (SMA) of the fast RSI.
- **RSIUpperThreshold**: Upper threshold for the RSI, used in exit conditions.
- **RSILowerThreshold**: Lower threshold for the RSI, used in exit conditions.
- **RSIUpperDeadzone**: Upper deadzone threshold for the RSI.
- **RSILowerDeadzone**: Lower deadzone threshold for the RSI.
Strategy Logic
- **RSI Calculation**: The script calculates both slow and fast RSI values based on the provided lengths.
- **Entry Condition**: Entry conditions for long and short positions are based on the crossing of fast RSI over slow RSI and SMA RSI, respectively, along with avoidance of RSI deadzones and validation of trade time.
- **Exit Condition**: Exit conditions for both long and short positions are based on crossing RSI thresholds or opposite entry conditions.
Trade Management
- **Position Entry**: Long and short positions are entered based on predefined entry conditions.
- **Position Exit**: Positions are exited based on predefined exit conditions.
- **Alerts**: The script provides alert messages for entry and exit points.
Plotting
- **Slow RSI**: Plots the slow RSI on the chart.
- **SMA RSI**: Plots the Simple Moving Average of fast RSI on the chart.
Example Usage
The defaults work well for SPY on a 1H timeframe.
If you apply this to anything else DAX, EUSTX50, FTSE, CAC (these are what i have); tweak the input parameters.
Plotting
plot(slowRSI, "Slow RSI", color=color.green) //or fastRSI
plot(smaRSI, "SMA RSI", color=color.white)
Conclusion
The "SPY Auto RSI Stochastics" strategy combines RSI and Stochastic indicators to provide potential trade signals for the SPY ETF. Traders can use this strategy with proper risk management and analysis to enhance their trading decisions.

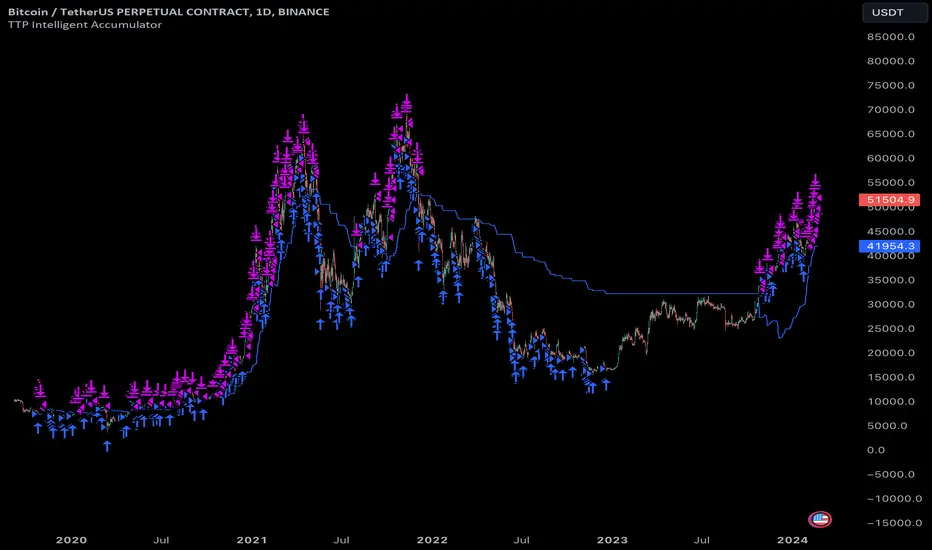
TTP Intelligent AccumulatorThe intelligent accumulator is a proof of concept strategy. A hybrid between a recurring buy and TA-based entries and exits.
Distribute the amount of equity and add to your position as long as the TA condition is valid.
Use the exit TA condition to define your exit strategy.
Decide between adding only into losing positions to average down or take a riskier approach by allowing to add into a winning position as well.
Take full profit or distribute your exit into multiple take profit exists of the same size.
You can also decide if you allow your exit conditions to close your position in a loss or require a minimum take profit %.
The strategy includes a default built-in TA conditions just for showcasing the idea but the final intent of this script is to delegate the TA entries and exists to external sources.
The internal conditions use RSI length 7 crossing below the BB with std 1 for entries and above for exits.
To control the number of orders use the properties from settings:
- adjust the pyramiding
- adjust the percentage of equity
- make sure that pyramiding * % equity equals 100 to prevent over use of equity (unless using leverage)
The script is designed as an alternative to daily or weekly recurring buys but depending on the accuracy of your TA conditions it might prove profitable also in lower timeframes.
The reason the script is named Intelligent is because recurring buy is most commonly used without any decision making: buy no matter what with certain frequency. This strategy seeks to still perform recurring buys but filtering out some of the potential bad entries that can delay unnecessarily seeing the position in profits. The second reason is also securing an exit strategy from the beginning which no recurring buy option offers out-of-the-box.
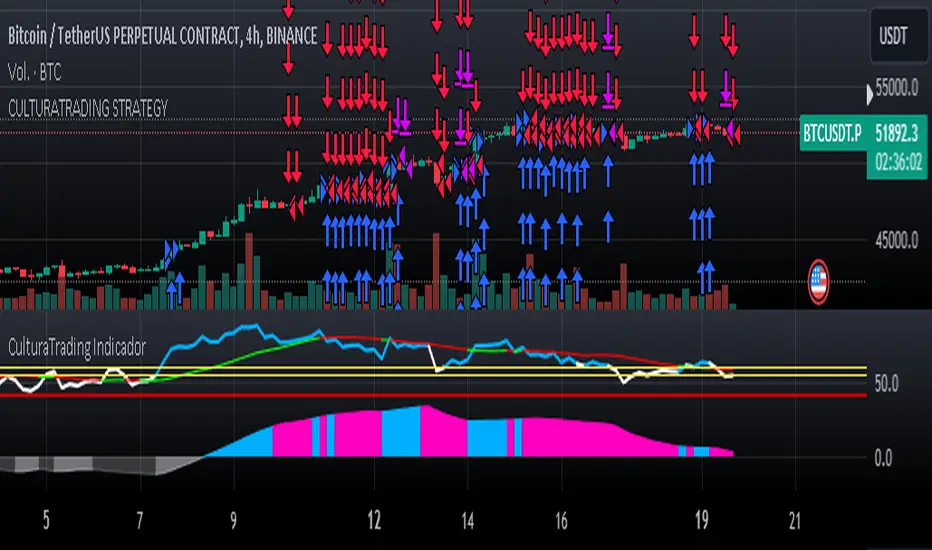
CULTURATRADING STRATEGYThe "CULTURATRADING STRATEGY" is designed to capitalize on market trends by incorporating a combination of technical indicators that signal potential entry and exit points for trades on various assets. This strategy is not just a mere collection of indicators but a well-thought-out approach that synergizes different market signals to optimize trade decisions.
The script uses the MACD (Moving Average Convergence Divergence) to gauge momentum and trend direction, with the slope of the MACD line serving as a trigger for market entries. A positive slope suggests an upward trend and potential long entry, while a negative slope indicates a downward trend and a possible short entry.
In tandem with the MACD, the ADX (Average Directional Index) is utilized to measure the strength of the trend. An ADX value above 25 signifies a strong trend, which, when aligned with MACD signals, can validate the trade entries.
The RSI (Relative Strength Index) is another critical component, identifying overbought and oversold conditions. This strategy looks for crossovers above and below key levels (60 for overbought, 40 for oversold) to determine high-probability turning points in the market. The inclusion of a 20-period SMA (Simple Moving Average) of the RSI adds a layer to filter the signals further, allowing for the refinement of entry and exit points.
The script employs a dynamic stop-loss system, set at the lowest low of the past 20 bars for long positions and the highest high for shorts, to manage risk effectively. The strategy is configured for a $10,000 account, risking a reasonable portion of capital per trade, with a pyramid effect to allow for diversified entries from various signals. The backtesting results are based on a 5% capital allocation per trade and include a 0.08% commission. To ensure accurate backtesting, the script includes an additional percentage to account for slippage within the commission.
To provide a comprehensive understanding, the script also outputs a "volatility histogram" based on the ADX, offering insights into market volatility and helping to time the trades better.
This strategy has been backtested across different timeframes and assets, showing resilience in various market conditions. It is essential to check the 'recalculate after order filled' option due to the dynamic nature of stop-loss orders.
This script is paired with the "CULTURATRADING INDICATOR" for enhanced signal clarity, providing a holistic view of the strategy's performance. Please note that this script is for educational purposes and should not be taken as financial advice.
The "CULTURATRADING INDICATOR" is an essential tool that works in conjunction with the "CULTURATRADING STRATEGY" to provide traders with a clear visualization of the market's conditions. It enhances the strategy by offering visual cues that help interpret complex market data more intuitively.
The indicator displays key RSI levels, such as 60 for overbought conditions and 40 for oversold conditions, with a mid-level at 55 to indicate when a trend may be weakening. The colors on the RSI line change to reflect these conditions, offering a quick reference for traders: a blue color signifies an RSI above 60, indicating overbought conditions; a red color shows an RSI below 40, pointing to oversold conditions; and white represents values in between, suggesting a neutral state.
Moreover, the volatility histogram, which is part of the "CULTURATRADING INDICATOR," provides a visual representation of market volatility. The histogram changes colors based on the ADX value and the slope of the MACD line. For instance, a green histogram suggests a positive MACD slope during a strong trend, indicating potential bullish momentum. Conversely, a red histogram implies a negative MACD slope during strong trends, hinting at bearish momentum. A grey color might be used to represent periods when the trend is weak or the market is less volatile.
Together, these visual elements of the "CULTURATRADING INDICATOR" complement the strategy's signals, providing traders with an at-a-glance summary of the current market scenario, which can be particularly useful when managing multiple trades or assessing opportunities quickly.
Please remember, this script and its associated indicator are designed to serve as educational tools to assist in understanding market dynamics and are not intended as financial advice. Always conduct your own research and consider consulting a financial advisor for personalized guidance.
Bollinger and Stochastic with Trailing Stop - D.M.P.This trading strategy combines Bollinger Bands and the Stochastic indicator to identify entry opportunities in oversold and overbought conditions in the market. The aim is to capitalize on price rebounds from the extremes defined by the Bollinger Bands, with the confirmation of the Stochastic to maximize the probability of success of the operations.
Indicators Used
- Bollinger Bands Used to measure volatility and define oversold and overbought levels. When the price touches or breaks through the lower band, it indicates a possible oversold condition. Similarly, when it touches or breaks through the upper band, it indicates a possible overbought condition.
- Stochastic: A momentum oscillator that compares the closing price of an asset with its price range over a certain period. Values below 20 indicate oversold, while values above 80 indicate overbought.
Strategy Logic
- Long Entry (Buy): A purchase operation is executed when the price closes below the lower Bollinger band (indicating oversold) and the Stochastic is also in the oversold zone.
- Short Entry (Sell): A sell operation is executed when the price closes above the upper Bollinger band (indicating overbought) and the Stochastic is in the overbought zone.

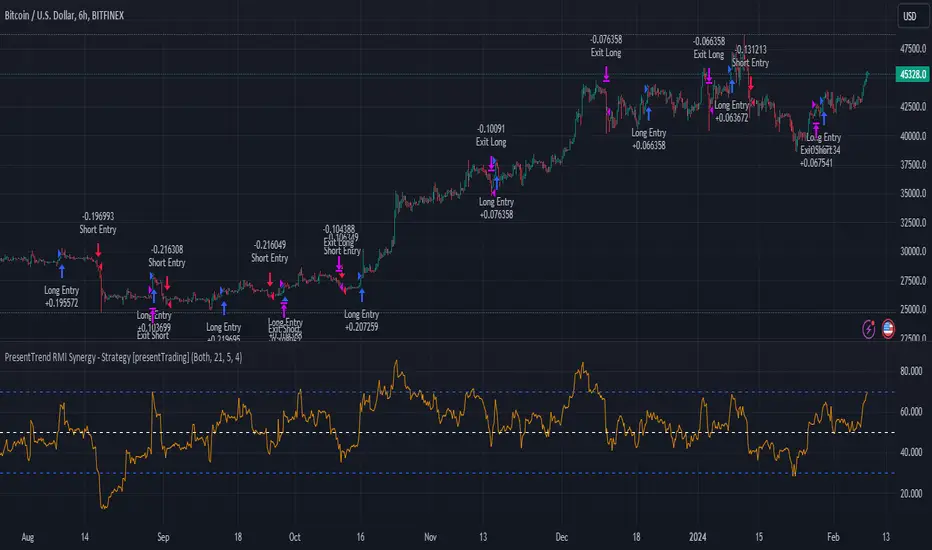
PresentTrend RMI Synergy - Strategy [presentTrading] █ Introduction and How it is Different
The "PresentTrend RMI Synergy Strategy" is the combined power of the Relative Momentum Index (RMI) and a custom presentTrend indicator. This strategy introduces a multifaceted approach, integrating momentum analysis with trend direction to offer traders a more nuanced and responsive trading mechanism.
BTCUSD 6h L/S Performance
Local
█ Strategy, How It Works: Detailed Explanation
The "PresentTrend RMI Synergy Strategy" intricately combines the Relative Momentum Index (RMI) and a custom SuperTrend indicator to create a powerful tool for traders.
🔶 Relative Momentum Index (RMI)
The RMI is a variation of the Relative Strength Index (RSI), but instead of using price closes against itself, it measures the momentum of up and down movements in price relative to previous prices over a given period. The RMI for a period length `N` is calculated as follows:
RMI = 100 - 100/ (1 + U/D)
where:
- `U` is the average upward price change over `N` periods,
- `D` is the average downward price change over `N` periods.
The RMI oscillates between 0 and 100, with higher values indicating stronger upward momentum and lower values suggesting stronger downward momentum.
RMI = 21
RMI = 42
For more information - RMI Trend Sync - Strategy :
🔶 presentTrend Indicator
The presentTrend indicator combines the Average True Range (ATR) with a moving average to determine trend direction and dynamic support or resistance levels. The presentTrend for a period length `M` and a multiplier `F` is defined as:
- Upper Band: MA + (ATR x F)
- Lower Band: MA - (ATR x F)
where:
- `MA` is the moving average of the close price over `M` periods,
- `ATR` is the Average True Range over the same period,
- `F` is the multiplier to adjust the sensitivity.
The trend direction switches when the price crosses the presentTrend bands, signaling potential entry or exit points.
presentTrend length = 3
presentTrend length = 10
For more information - PresentTrend - Strategy :
🔶 Strategy Logic
Entry Conditions:
- Long Entry: Triggered when the RMI exceeds a threshold, say 60, indicating a strong bullish momentum, and when the price is above the presentTrend, confirming an uptrend.
- Short Entry: Occurs when the RMI drops below a threshold, say 40, showing strong bearish momentum, and the price is below the present trend, indicating a downtrend.
Exit Conditions with Dynamic Trailing Stop:
- Long Exit: Initiated when the price crosses below the lower presentTrend band or when the RMI falls back towards a neutral level, suggesting a weakening of the bullish momentum.
- Short Exit: Executed when the price crosses above the upper presentTrend band or when the RMI rises towards a neutral level, indicating a reduction in bearish momentum.
Equations for Dynamic Trailing Stop:
- For Long Positions: The exit price is set at the lower SuperTrend band once the entry condition is met.
- For Short Positions: The exit price is determined by the upper SuperTrend band post-entry.
These dynamic trailing stops adjust as the market moves, providing a method to lock in profits while allowing room for the position to grow.
This strategy's strength lies in its dual analysis approach, leveraging RMI for momentum insights and presentTrend for trend direction and dynamic stops. This combination offers traders a robust framework to navigate various market conditions, aiming to capture trends early and exit positions strategically to maximize gains and minimize losses.
█ Trade Direction
The strategy provides flexibility in trade direction selection, offering "Long," "Short," or "Both" options to cater to different market conditions and trader preferences. This adaptability ensures that traders can align the strategy with their market outlook, risk tolerance, and trading goals.
█ Usage
To utilize the "PresentTrend RMI Synergy Strategy," traders should input their preferred settings in the Pine Script™ and apply the strategy to their charts. Monitoring RMI for momentum shifts and adjusting positions based on SuperTrend signals can optimize entry and exit points, enhancing potential returns while managing risk.
█ Default Settings
1. RMI Length: 21
The 21-period RMI length strikes a balance between capturing momentum and filtering out market noise, offering a medium-term outlook on market trends.
2. Super Trend Length: 7
A SuperTrend length of 7 periods is chosen for its responsiveness to price movements, providing a dynamic framework for trend identification without excessive sensitivity.
3. Super Trend Multiplier: 4.0
The multiplier of 4.0 for the SuperTrend indicator widens the trend bands, focusing on significant market moves and reducing the impact of minor fluctuations.
---
The "PresentTrend RMI Synergy Strategy" represents a significant step forward in trading strategy development, blending momentum and trend analysis in a unique way. By providing a detailed framework for understanding market dynamics, this strategy empowers traders to make more informed decisions.
EMA Crossover Strategy with RSI Filter BIGTIME 5mThis script essentially creates a trading strategy that goes long when there is an EMA crossover, but only if the RSI is below a certain overbought level. It goes short when there is an EMA crossunder, but only if the RSI is above a certain oversold level. The moving averages are plotted on the chart for visual reference.
SCALPING 5m
Pairs: BIGTIME/USDT--- API3/USDT---BAKE/USDT--- ZIL/USDT

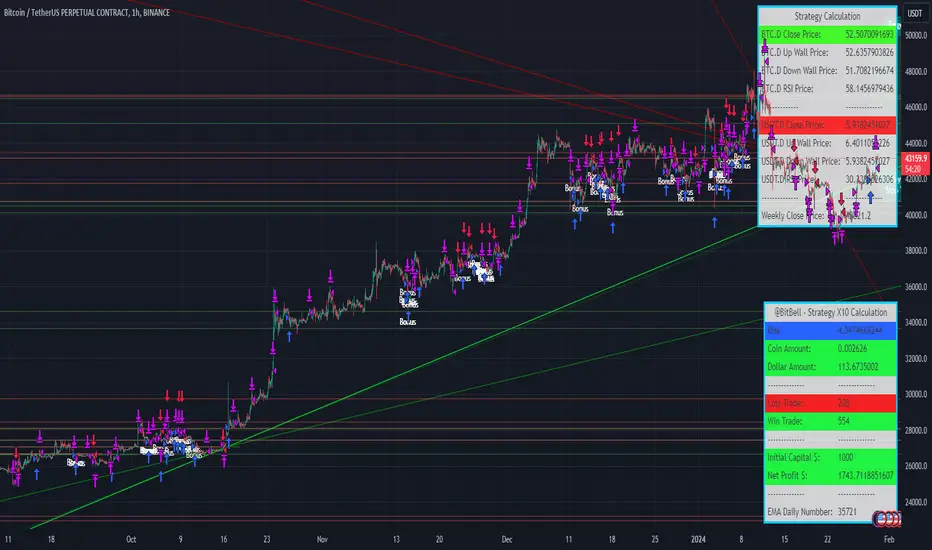
BitBell - EMA PullBack RSI EXO
🔵 Introduction
Version 1.1
This is a Pine 5 trend following strategy. It has a four strategy with several alerts and signals. The design intent is to produce a commercial grade signal generator that can be adapted to any symbol in cryptocurrency and only 1H Chart. Ideally, the script is reliable enough to be the basis of an automated trading system web-hooked to a server with API access to crypto brokerages. The strategy can be run in three different modes: long, short and bidirectional.
As a trend following strategy, the behavior of the script is to buy on strength and sell on weakness. As such the trade orders maintain its directional bias according to price pressure. What you will see on the chart is long positions on the left side of the mountain and short on the right. Long and short positions are not intermingled as long as there exists a detectable trend. This is extremely beneficial feature in long running bull or bear markets. The script uses multiple setups to avoid the situation where you got in on the trend, took a small profit but couldn’t get back in because the logic is waiting for a pullback or some other intricate condition.
Deep draw-downs are a characteristic of trend following systems and this system is no different. However, this script makes use of the TradingView pyramid feature with three NPUs to find better place and even you can change drop percentage in settings for another trigger, accessible from the properties tab.
When trend market break it will stop the trade and usually it takes 2-4 percent loss but don't worry it has prefect money management and you can use it for Futures market and even Spot market.
🔵 Design
This script uses twelve indicators on two time frames. The chart (primary) interval and one higher time frame which is based on the primary. The higher time frame identifies the trend for which the primary will trade. I’ve tried to keep the higher time frame around five times greater than the primary. The original trading algorithms are a port from a much larger program on another trading platform. I’ve converted some of the statistical functions to use standard indicators available on TradingView. The setups make heavy use of the Hull Moving Average in conjunction with EMAs that form the Bill Williams Alligator as described in his book “New Trading Dimensions” Chapter 3. Lag between the Hull and the EMAs form the basis of the entry and exit points. The alligator itself is used to identify the trend main body.
The entire script is around 740 lines of Pine code which is the maximum incidental size given the TradingView limits: local scopes, run-time duration and compile time. I’ve been working on this script for over a year and have tested it on various instruments stock crypto. It performs well on higher liquidity markets that have at least a year of historical data. Though it can be configured to work on any interval between 15 minutes and 4 hour, trend trading is generally a longer term paradigm. For day trading the 10 to 15 minute interval will allow you to catch momentum breakouts. For intraweek trades 30 minutes to 1 hour should give you a trade every other a day.
Inputs to the script use cone centric measurements in effort to avoid exposing adjustments to the various internal indicators. The goal was to keep the inputs relevant to the actual trade entry and exit locations as opposed to a series of MA input values and the like. As a result the strategy exposes over 12 inputs grouped into long or short sections. Inputs are available for the usual minimum profit and stop-loss as well as trade, modes, presets, reports and lots of calibrations. The inputs are numerous, I’m aware. Unfortunately, at this time, TradingView does not offer any other method to get data in the script. The usual initialization files such as cnf, cfg, ini, json and xml files are currently unsupported.
Example configurations for various instruments along with a detailed PDF user manual is available.
it has no repaint i guaranty this, and you can have 10 days free with comment and check it by yourself
One issue that comes up when comparing the strategy with the study is that the strategy trades show on the chart one bar later than the study. This problem is due to the fact that “strategy.entry()” and “strategy_close()” do not execute on the same bar called. The study, on the other hand, has no such limitation since there are no position routines. However, alerts that are subsequently fired off when triggered in the study are dispatched from the TradingView servers one bar later from the study plot. Therefore the alert you actually receive on your cell phone matches the strategy plot but is one bar later than the study plot.
Please be aware that the data source matters. Cryptocurrency has no central tick repository so each exchange supplies TradingView its feed. Even though it is the same symbol the quality of the data and subsequently the bars that are supplied to the chart varies with the exchange. This script will absolutely produce different results on different data feeds of the same symbol. Be sure to backtest this script on the same data you intend to receive alerts for. Any example settings I share with you will always have the exchange name used to generate the test results.
🟡 Usage
It sends long and short signals with pyramid orders of up to 3, meaning that the strategy can trigger up to 3 orders in the same direction. Good risk and money management.
It's important to note that the strategy combines 2 systems working together (Long and LongX). Let’s describe the specific features of this strategy.
🔵 If Findes Supports And Ressitances And Trend Lines As Best As It Can, And You Can See:
🟢 Frist Simple Long Condition = It Look At The Trend Wait For RSI Cross 30 Number Then Ckeck Risk To Reward, check something else such as divergence:
🟢 Another Long Example:
🔴 Frist Simple Short Condition = It Look At The Trend Wait For RSI Cross 70 Number Then Ckeck Risk To Reward, check something else such as divergence:
🔴 Another Short Example:
The following steps provide a very brief set of instructions that will get you started but will most certainly not produce the best backtest. A trading system that you are willing to risk your hard earned capital will require a well crafted configuration that involves time, expertise and clearly defined goals. As previously mentioned, I have several example configs that I use for my own trading that I can share with you along with a PDF which describes each input in detail. To get hands on experience in setting up your own symbol from scratch please follow the steps below.
The input dialog box contains over 12 inputs, There are four options must to be configured: Choose Target, side, Choose Settings, Money Management,and settings that apply to both. The following steps address these four main options only.
Money Management System For Leverage 10:
Bot Finds Last Lower Low And Calculate Distance From Entry Price, Then Cross It To Initial Capitan And Cross Leverage =>
Position_Size = (((1.64) * (initial Capital)) * (leverage))
And Check Dominances Too For Getting Best Money Management Result
🔵 Settings
* Side, You Can Set Long Or Short Or Both.
* Choose Target, You Can Set One Target Or All Targets.
* Money Management, You Can ON Or OFF It, With OFF You Can USE It For SPOT Trades.
* Choose Settings, In This Field You Can Set Mathematical Optimization, Ddepends On Which Pair You USE.
* Clear With Daily PullBack?, With This Check Box You Can Clear Signals With Daily PullBack.
* Long X, You Can Set Long Leverage.
* Short X, You Can Set Short Leverage.
* Second Order X, You Can Set Pyramiding Leverage.
* Target Long, You Can Set Percent For Long Target.
* Target Short, You Can Set Percent For Short Target.
* Short Martin Percent, You Can Set Short Martingale Percent.
* Long Martin Percent, You Can Set Long Martingale Percent.
🟡 Pyraming 3
🟡 Commission Is 0.065 %
🟡 Slippage Is 10 ticks
🔴Only Use For 1 Hour Chart
🔴 CONCLUSION
We believe that success lies in the association of the user with the indicator, opposed to many traders who have the perspective that the indicator itself can make them become profitable. The reality is much more complicated than that.
The aim is to provide an indicator comprehensive, customizable, and intuitive enough that any trader can be led to understand this truth and develop an actionable perspective of technical indicators as support tools for decision making.
🔴 RISK DISCLAIMER
Trading is risky & most day traders lose money. All content, tools, scripts, articles, & education provided by BitBell are purely for informational & educational purposes only. Past performance does not guarantee future results.