RSI-WMA + EMA Trend Filter | SL/TP DynamicA Simple Edge in Trending Markets
Base on RSI & WMA (RSI) Cross with EMA for trend filter.
Осцилляторы

Express Generator StrategyExpress Generator Strategy
Pine Script™ v6
The Express Generator Strategy is an algorithmic trading system that harnesses confluence from multiple technical indicators to optimize trade entries and dynamic risk management. Developed in Pine Script v6, it is designed to operate within a user-defined backtesting period—ensuring that trades are executed only during chosen historical windows for targeted analysis.
How It Works:
- Entry Conditions:
The strategy relies on a dual confirmation approach:- A moving average crossover system where a fast (default 9-period SMA) crossing above or below a slower (default 21-period SMA) average signals a potential trend reversal.
- MACD confirmation; trades are only initiated when the MACD line crosses its signal line in the direction of the moving average signal.
- An RSI filter refines these signals by preventing entries when the market might be overextended—ensuring that long entries only occur when the RSI is below an overbought level (default 70) and short entries when above an oversold level (default 30).
- Risk Management & Dynamic Position Sizing:
The strategy takes a calculated approach to risk by enabling the adjustment of position sizes using:- A pre-defined percentage of equity risk per trade (default 1%, adjustable between 0.5% to 3%).
- A stop-loss set in pips (default 100 pips, with customizable ranges), which is then adjusted by market volatility measured through the ATR.
- Trailing stops (default 50 pips) to help protect profits as the market moves favorably.
This combination of volatility-adjusted risk and equity-based position sizing aims to harmonize trade exposure with prevailing market conditions.
- Backtest Period Flexibility:
Users can define the start and end dates for backtesting (e.g., January 1, 2020 to December 31, 2025). This ensures that the strategy only opens trades within the intended analysis window. Moreover, if the strategy is still holding a position outside this period, it automatically closes all trades to prevent unwanted exposure.
- Visual Insights:
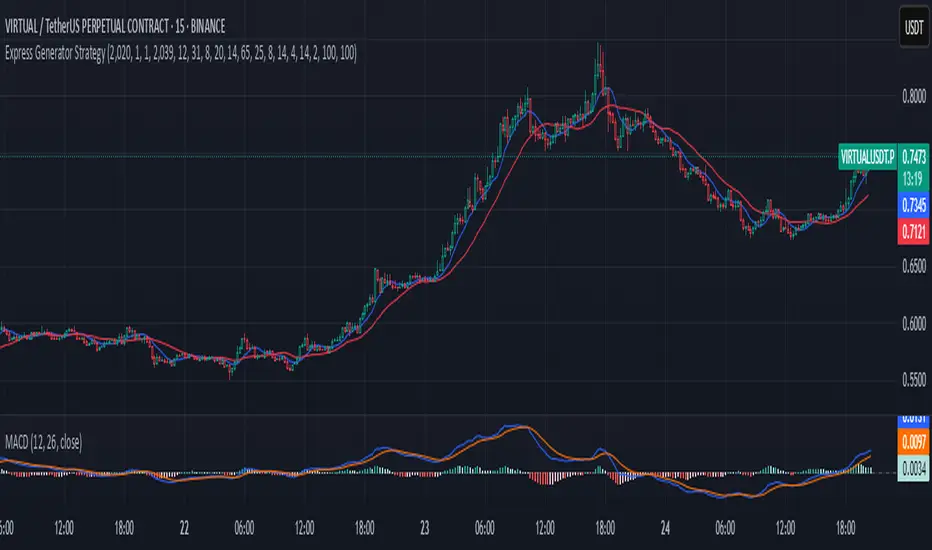
For clarity, the strategy plots the fast (blue) and slow (red) moving averages directly on the chart, allowing for visual confirmation of crossovers and trend shifts.
By integrating multiple technical indicators with robust risk management and adaptable position sizing, the Express Generator Strategy provides a comprehensive framework for capturing trending moves while prudently managing downside risk. It’s ideally suited for traders looking to combine systematic entries with a disciplined and dynamic risk approach.
Arena trend strategyMulti-Timeframe Trend-Following System with Adaptive RSI, Dynamic EMAs & Visual Volatility-Based Signals
This Invite-Only strategy combines classic technical indicators with a modern, adaptive approach. Designed to react in real time to market shifts, it delivers intuitive, visual signals ideal for both intraday and swing trading.
Key Features
Multi-Timeframe RSI:
Two RSI indicators from different timeframes help align short-term momentum with the broader market trend. The higher timeframe filters out noise, while the lower one offers precise entry timing.
Adaptive EMAs:
Two EMAs that dynamically adjust based on volatility (ATR), trend strength (ADX), and volume. Instead of fixed periods, they adapt to the current state of the market in real time.
🌊 ARTEMA Trendline:
A uniquely smoothed, ATR-based trendline that uses color changes and icons to signal the strength and quality of the trend.
🚀 = Strong Bullish Trend | 🐦 = Weakening / Consolidating Trend
Multi-Factor Weighting System:
EMA and trend smoothing are influenced by a customizable blend of factors:
ATR: reflects volatility
ADX: measures trend strength
Volume: indicates market activity
Visual Support:
Trend transitions and EMA zones change color or use gradient shading to signal shifts in direction or strength—making reversals and momentum bursts easier to spot.
How It Works – Signal Logic
Long Entry Criteria:
Both RSIs above their respective moving averages
EMA1 > EMA2
Supertrend flips green
Short Entry Criteria:
Both RSIs below their respective moving averages
EMA1 < EMA2
Supertrend flips red
Trade Management:
Automated entries based on signal conditions
SL and TP adjustable as percentages
Optional visual cues: 🚀 / 🐦 for high-confidence entries or early reversals
Fully Customizable Settings
RSI length and timeframe (independent for both RSIs)
EMA weighting factors (individually adjustable for ATR, ADX, and Volume)
ARTEMA line smoothing and visibility
EMA trend display: color-shifting or gradient mode
Supertrend length and multiplier
Long-only / short-only trade filtering
SL/TP precision adjustable in 0.1% increments
All visual components can be toggled and recolored
What Makes It Unique?
This isn't just another RSI–EMA–Supertrend combo. It's a sophisticated, adaptive system that evolves with the market and provides visually rich, actionable insights.
With multi-timeframe filtering, real-time weighted EMAs, the distinctive ARTEMA line, and intuitive entry icons—all working together—this tool gives trend-followers a powerful edge.

Auto Trading con ActivTradesSMA crossover strategy with automatic Take Profit and Stop Loss, designed for live account execution via ActivTrades directly from TradingView.

🧬 Fractal Trap Hunter v2.2 – Wyckoff x Fib Precision// This is still a WIP and any feedback is very welcome.
🧬 Fractal Trap Hunter v2.2
Wyckoff x Fibonacci Precision Reversal Strategy
📈 Version: 2.2
🔁 Smart Money Filters • Fib Zones • Momentum Precision
💡 Designed for traders who demand accuracy, structure, and smart filtering.
🚀 Summary
Fractal Trap Hunter v2.2 isn’t just a strategy — it’s a framework.
It adapts to the market’s structure and filters out the noise using real logic used by institutions.
🎯 Strategy Overview
Fractal Trap Hunter v2.2 is a reversal-based strategy that fuses:
📐 Fibonacci retracements/extensions
📊 Wyckoff-style impulse logic (BOS/Spring)
🔍 Optional Smart Money filters
⚡ Precision entries at 61.8%–78.6% with TP1 & TP2 via 1.272/1.618 extensions
✅ Modular filters (RSI, EMA, DPO, SMI, Volume)
🛠 How It Works
Detects a directional impulse (fakeout/BOS/spring)
Waits for price to retrace into a golden zone (Fib 61.8–78.6%)
Enters only if filtered by momentum + confluence signals
Takes partial TP1, moves SL to BE, lets TP2 run
Visual zones and labels make execution easy and clean
⚙️ Key Inputs
Input Purpose Default
Fib Entry Min -- Lowest fib zone for entry -- 0.618
Fib Entry Max -- Highest fib zone for entry -- 0.786
TP1 Extension -- First take profit (extension of impulse) -- 1.272
TP2 Extension -- Final target -- 1.618
Min Impulse % --Required size for the setup -- 0.8%
🧠 Optional Filters
Filter Use Case
EMA Filter -- Only trade with 50 EMA trend
EMA Crossover -- Confirms short-term momentum direction
RSI -- Filter out overextended entries
DPO -- Avoid flat/no-trend zones
SMI -- Precision momentum confirmation
Volume Spike -- Ensures trades trigger with liquidity & intent
📍 Where & When to Use
✅ Best Markets
Forex majors: EUR/USD, GBP/USD, USD/JPY, AUD/USD
Indices: NAS100, SPX500, GER40
Gold: XAU/USD — thrives on fakeouts
Crypto: BTC/USD (H1+ only — volatile), SOL/EUR (H8 had some amazing results)
✅ Best Timeframes
M15 to H1: Optimal balance of signals and quality
H4 - H8 for structure context
D1 for bias filter (optional)
🕐 Best Time of Day
London Open (7–10am UTC) – breakout traps + volume
NY Open (13–15 UTC) – BOS + FVG setups
Avoid low-liquidity hours unless volume filter is ON
📊 How to Backtest
Select timeframe (e.g., M30)
Open Strategy Tester → Overview
Toggle filters & Fib zones to optimize for asset
🔥 Pro Tips to Maximize Edge
📌 Start with only EMA + OB filters, optimize first
⚠️ Avoid choppy price action — look for clear liquidity sweeps
🎯 Use HTF BOS or Wyckoff structures to frame LTF entries
🧬 Look for confluence: OB + Fib + Volume spike = sniper
🔄 Run optimization for each asset and session
⚠️ Risk Disclaimer
Trading involves risk. Use proper position sizing. Past performance does not guarantee future results.

RSI Divergence Strategy - AliferCryptoStrategy Overview
The RSI Divergence Strategy is designed to identify potential reversals by detecting regular bullish and bearish divergences between price action and the Relative Strength Index (RSI). It automatically enters positions when a divergence is confirmed and manages risk with configurable stop-loss and take-profit levels.
Key Features
Automatic Divergence Detection: Scans for RSI pivot lows/highs vs. price pivots using user-defined lookback windows and bar ranges.
Dual SL/TP Methods:
- Swing-based: Stops placed a configurable percentage beyond the most recent swing high/low.
- ATR-based: Stops placed at a multiple of Average True Range, with a separate risk/reward multiplier.
Long and Short Entries: Buys on bullish divergences; sells short on bearish divergences.
Fully Customizable: Input groups for RSI, divergence, swing, ATR, and general SL/TP settings.
Visual Plotting: Marks divergences on chart and plots stop-loss (red) and take-profit (green) lines for active trades.
Alerts: Built-in alert conditions for both bullish and bearish RSI divergences.
Detailed Logic
RSI Calculation: Computes RSI of chosen source over a specified period.
Pivot Detection:
- Identifies RSI pivot lows/highs by scanning a lookback window to the left and right.
- Uses ta.barssince to ensure pivots are separated by a minimum/maximum number of bars.
Divergence Confirmation:
- Bullish: Price makes a lower low while RSI makes a higher low.
- Bearish: Price makes a higher high while RSI makes a lower high.
Entry:
- Opens a Long position when bullish divergence is true.
- Opens a Short position when bearish divergence is true.
Stop-Loss & Take-Profit:
- Swing Method: Computes the recent swing high/low then adjusts by a percentage margin.
- ATR Method: Uses the current ATR × multiplier applied to the entry price.
- Take-Profit: Calculated as entry price ± (risk × R/R ratio).
Exit Orders: Uses strategy.exit to place bracket orders (stop + limit) for both long and short positions.
Inputs and Configuration
RSI Settings: Length & price source for the RSI.
Divergence Settings: Pivot lookback parameters and valid bar ranges.
SL/TP Settings: Choice between Swing or ATR method.
Swing Settings: Swing lookback length, margin (%), and risk/reward ratio.
ATR Settings: ATR length, stop multiplier, and risk/reward ratio.
Usage Notes
Adjust the Pivot Lookback and Range values to suit the volatility and timeframe of your market.
Use higher ATR multipliers for wider stops in choppy conditions, or tighten swing margins in trending markets.
Backtest different R/R ratios to find the balance between win rate and reward.
Disclaimer
This script is for educational purposes only and does not constitute financial advice. Trading carries significant risk and you may lose more than your initial investment. Always conduct your own research and consider consulting a professional before making any trading decisions.

📈 RX Swing This Pine Script strategy is designed for trading Nifty options on a 4-hour chart. Here’s a breakdown of how it works:
Timeframe Enforcement: The strategy is designed to only work on a 4-hour chart. If you try to run it on any other timeframe, it will throw an error.
Inputs:
RSI length: Determines the length for the Relative Strength Index (RSI) indicator.
RSI MA Length: Determines the moving average length for smoothing the RSI.
MA Type: Allows you to choose between SMA or EMA for the RSI moving average.
Stop Loss & Take Profit: These define the exit points in percentage terms.
Capital per Trade: Defines how much capital is allocated per trade.
Lot Size: Specifies the number of Nifty options contracts to trade.
Trailing Stop-Loss Points: Defines how many points the price has to move against the position before the trailing stop is triggered.
Trading Logic:
RSI & Moving Average: The strategy generates buy (call) and sell (put) signals based on the crossover and crossunder of RSI and its moving average.
Position Size: The position size is based on capital allocated and the current price of the Nifty.
Stop Loss/Take Profit: The strategy uses both percentage-based stop loss and take profit levels, as well as a trailing stop mechanism to lock profits.
Exit Conditions:
The strategy has several exit triggers:
Trailing Stop-Loss: When the price moves against the trade by a certain number of points, it exits.
Reversal Exit: The strategy will exit a position if the opposite signal (long vs. short or vice versa) occurs.
TP/SL Exit: The strategy will also exit the position when the target profit or stop loss levels are hit.
Loss Count: The strategy tracks the number of consecutive losing trades, and if the count exceeds two, no new trades are allowed until the count resets.
Reset Loss Count: The loss count resets every day at 9:15 AM.
Plotting:
Entry signals (long/short) are marked with green (buy call) and red (buy put) triangles.
Exit signals for TP, SL, Reversal, and Trailing SL are marked with respective shapes (crosses, circles, squares).
This strategy is designed to manage risk with a stop loss and take profit system, while also incorporating a trailing stop-loss mechanism to lock in profits. It ensures that the strategy works only on the 4-hour chart, and limits trading activity after consecutive losses to maintain discipline.

Scalping total strategy alertsUpdated version of the Scalping Total Strategy.
This version has updated debug plots.
All settings can be changed to your own liking, but as default they work on most timeframes.
If you like sharp buy/sell signals before any long/short, set cooldown to 1.
On smaller timeframes, like 15 min and under that, set the Ema1 to 5 and the Ema3 to 9, and just disable Ema2.
This Strategy gives buy/ sell signals, byt also gives potential entry calls for long/short entries, and alerts can be set for these calls.

QQE SHARPE MAX BOT v2 - Reversals + Trailing + VolumenThe **“QQE SHARPE MAX BOT v2”** strategy is based on detecting momentum shifts using the QQE Mod indicator, combined with a trend filter based on EMA and Heikin Ashi, as well as a volume filter that requires volume to be above its moving average to validate entries. It operates in both directions (long and short) with automatic reversals and manages risk through dynamic trailing stops based on ATR, allowing it to maximize profits during strong trends and avoid trading in low-interest market zones.

YASINKARACA EMA+BB+IchimokuSignalsHey everyone! I’m Yasin Karaca.
I’ve packed this strategy with some of the most powerful and profitable indicators — and I’m sharing it with you for free!
My goal? To help you crush the markets using Moving Averages, Bollinger Bands, and Ichimoku Clouds the right way.
Use it smart, stay consistent, and let the gains roll in!
Good luck and happy trading! 🚀📈

Scalping Strategy with DCA - V3# Enhanced Scalping Strategy with DCA - V3
## Strategy Overview
This strategy combines multiple technical indicators with a structured Dollar Cost Averaging (DCA) approach to create a comprehensive trading system for cryptocurrency markets. Unlike simple indicator mashups, this strategy integrates several confirmation layers for entries while implementing a sophisticated risk management system based on the 1-2-6 DCA ratio.
## What Makes This Strategy Unique
1. **Multi-Layered Entry Confirmation System**:
- Uses EMA crossover as the primary trigger
- Adds RSI momentum confirmation
- Integrates MACD for trend strength
- Includes RSI divergence for reversal potential
- Incorporates higher timeframe confirmation for trend alignment
2. **Structured Risk Management**:
- Implements a 1-2-6 DCA ratio to strategically average into positions
- Uses percentage-based stop losses that adapt based on DCA status
- Features a two-tiered take profit system (25% at TP1, 50% at TP2)
- Optional breakeven stop loss after second take profit target
- Initial risk limited to a small percentage of account (1-3%)
3. **Versatile Market Adaption**:
- Additional entry opportunities during oversold/overbought Bollinger Band touches
- Customizable filters that can be enabled/disabled based on market conditions
- Higher timeframe confirmation to ensure alignment with larger trends
## How The Components Work Together
### Entry System Components
1. **48 EMA** serves as the primary trend filter and entry trigger. Price crossing above/below this EMA signals a potential trend change.
2. **RSI (Relative Strength Index)** confirms momentum in the intended direction:
- For longs: RSI > 20 shows bullish momentum
- For shorts: RSI < 80 shows bearish momentum
3. **MACD (Moving Average Convergence Divergence)** filters out weak trends:
- For longs: MACD line crosses above signal line
- For shorts: MACD line crosses below signal line
4. **RSI Divergence Detection** identifies potential reversals where price makes a new high/low but RSI fails to confirm, suggesting momentum is weakening.
5. **Higher Timeframe Confirmation** ensures the trade aligns with the larger trend structure by checking EMA and RSI on a higher timeframe (default is daily).
6. **Bollinger Bands** provide additional entry triggers during strong oversold/overbought conditions:
- Long entry when price touches lower band with RSI < 20
- Short entry when price touches upper band with RSI > 80
### The DCA Mechanism
The strategy employs a 1-2-6 ratio for Dollar Cost Averaging:
- **Initial position**: 1 unit based on account risk percentage
- **First DCA level**: Adds 2 units when price moves against initial entry by the first DCA level percentage (default 1%)
- **Second DCA level**: Adds 6 units when price moves further against entry by the second DCA level percentage (default 2%)
This structured approach reduces average entry price during temporary adverse price movements, potentially converting losing trades into winners when the expected price movement eventually occurs.
### Exit Strategy
The strategy uses multiple exit mechanisms:
1. **Tiered Take Profits**:
- First TP at takeProfitPercent1 from entry (default 0.5%) - closes 25% of position
- Second TP at takeProfitPercent2 from entry (default 1.0%) - closes 50% of position
- Remaining 25% runs with trailing stop loss or until stopped out
2. **Stop Loss Management**:
- Initial SL set at stopLossPercent from entry (default 1.5%)
- After full DCA deployment, SL adjusts to fixedSLPercent from entry (default 1.3%)
- Optional breakeven SL after second take profit hits
## Backtesting Settings & Recommendations
For realistic backtesting, please configure the following in the strategy Properties panel:
- **Commission**: 0.075% (typical for major cryptocurrency exchanges)
- **Slippage**: 0.05% (accounts for execution delays and spread)
- **Initial Capital**: $10,000 (realistic starting capital for the average trader)
- **Date Range**: January 2024 to present (provides sufficient sample size)
These settings ensure backtesting results closely match real trading conditions. The strategy is designed to never risk more than 3% of account equity on any trade, with typical risk between 1-2%.
## Recommended Markets & Timeframes
This strategy performs best in:
1. **Markets**:
- Cryptocurrency markets with high liquidity
- Assets with market capitalization > $1 billion
- Coins with holder ratio > 7% (reducing manipulation risk)
2. **Timeframes**:
- Primary: 1-hour and 4-hour charts
- Secondary: 15-minute charts for faster execution
- Higher timeframe confirmation: Daily chart
## Parameter Customization Guide
The strategy offers multiple customization options to adapt to different trading styles and market conditions:
1. **Risk Settings**:
- initialRiskPercent: Adjust between 0.5-2% for conservative to moderate approaches
- stopLossPercent: 1-3% based on volatility of the asset
- takeProfitPercent1/2: Can be adjusted based on average volatility
2. **Entry Filters**:
- Enable/disable MACD filter for additional confirmation
- Enable/disable RSI divergence for reversal trading
- Enable/disable higher timeframe confirmation for trend alignment
3. **DCA Settings**:
- dcaLevel1/2: Adjust based on asset volatility (higher for more volatile assets)
- Change the 1-2-6 ratio by modifying the position size calculations
## Visual Outputs Explained
The strategy displays the following visual elements:
1. **Indicator plots**:
- 48 EMA (blue line): Main trend filter
- Bollinger Bands (upper: red, middle: yellow, lower: green): Volatility and overbought/oversold levels
2. **Trade management levels**:
- Stop Loss level (red circles): Current SL price
- Take Profit levels (green circles): TP1 and TP2 targets
3. **Information panel**:
- Displays strategy settings and current mode
- Shows active filters and risk parameters
- Reminds about market cap and holder ratio requirements
## Real-World Trading Tips
When implementing this strategy in real trading:
1. Start with conservative risk settings (0.5-1%)
2. Trade only in favorable market conditions initially
3. Consider reducing position size during high market uncertainty
4. Monitor higher timeframe trends before taking entries
5. Always check market cap and holder ratio before trading a coin
6. Set up proper alerts for EMA crosses with RSI confirmation
7. Regularly review and adjust parameters based on recent performance
## How to Use This Strategy
1. Add the strategy to your chart
2. Configure risk parameters appropriate for your account
3. Set commission and slippage in the Properties panel
4. Enable/disable the filters based on your trading style
5. Monitor higher timeframe for overall trend direction
6. Use the strategy's signals for entry and the recommended take profit/stop loss levels
7. Consider manual intervention during extreme market events
This strategy provides a systematic approach to scalping with proper risk management through DCA, making it suitable for both beginner and experienced traders in cryptocurrency markets.

Strategic Dip AccumulatorDon't run out of cash while accumulating – with this indicator you will not buy every dip. You will buy just a few at a higher price, but many others will be bought at a lower price. This approach helps you conserve capital while positioning yourself to benefit from deeper market corrections.
Overview
This indicator is designed to help traders manage their entry points in volatile markets. By combining technical signals with dynamic take-profit levels that adjust to market volatility, it ensures your buying power is used efficiently without overcommitting on every minor dip. The oversold and overbought levels are derived using a blend of momentum indicators and pivot-based price levels, giving you a reliable view of potential support and resistance zones.
How It Works
The tool blends several components:
Timing and Range: You can set a specific backtest period to focus on the market conditions that matter most to your strategy.
Overbought/Oversold: Overbought signals are marked on the chart with red downward‑pointing triangles, while oversold signals are highlighted with green upward‑pointing triangles—making it easy to spot when the market is overextended in either direction.
Signal Lines: Visual cues on the chart mark key zones. The indicator identifies oversold conditions when momentum signals and price pivots indicate the market has dipped too far, and overbought conditions when these metrics suggest a potential reversal. Blue lines indicate buying opportunities, and red lines denote selling zones.
Dynamic Take Profit Levels: Profit targets adjust based on market volatility. In calm conditions, wider targets can capture larger moves; in volatile periods, tighter targets help secure gains more quickly.
Risk Management: The system limits exposure by triggering safety orders only when specific conditions are met, ensuring you maintain sufficient cash reserves.
Trading Tips
I discovered that using the indicator on the 1-hour chart could be more profitable, as it offers more frequent and timely signals without the noise of lower timeframes. This allows for better fine-tuning of entries and exits in fast-moving markets.
For crypto pairs that have outperformed Bitcoin during backtests, I've found promising results with assets like CRYPTOCAP:ADA , CRYPTOCAP:DOT , CRYPTOCAP:PEPE , CRYPTOCAP:SUI , GETTEX:TAO , CRYPTOCAP:XRP , and $ZRX. These pairs often exhibit stronger trends or more robust recoveries, which can enhance the performance of a dip-buying strategy. Feel free to share any other pairs you discover that outperform Bitcoin—collective insights can help everyone refine their strategies.
Conclusion
The Strategic Dip Accumulator offers a disciplined method for buying dips without depleting your cash reserves. By combining dynamic profit targets, clear entry signals, and robust risk management, this tool empowers you to make strategic decisions even in volatile markets. Use it on the 1-hour chart for more responsive signals, and consider pairing it with cryptocurrencies that have demonstrated strong performance compared to Bitcoin in your backtests for a more robust trading strategy.


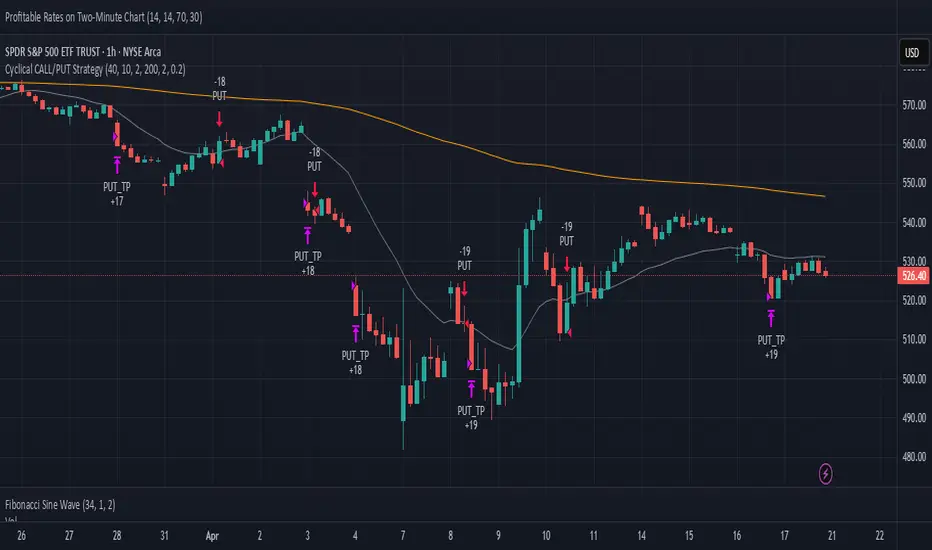
Cyclical CALL/PUT StrategyThis script identifies optimal CALL (long) and PUT (short) entries using a cyclical price wave modeled from a sine function and confirmed with trend direction via a 200 EMA.
Strategy Highlights:
Cycle-Based Signal: Detects market rhythm with a smoothed sinusoidal wave.
Trend Confirmation: Filters entries using a customizable EMA (default: 200).
Auto-Scaling: Wave height adjusts dynamically to price action volatility.
Risk Parameters:
Take Profit: Default 5% (customizable)
Stop Loss: Default 2% (customizable)
Signal Triggers:
CALL Entry: Price crosses above the scaled wave and in an uptrend
PUT Entry: Price crosses below the scaled wave and in a downtrend
Inputs:
Cycle Length
Smoothing
Wave Height
EMA Trend Length
Take Profit %
Stop Loss %
Visuals:
Gray line = Scaled Cycle Wave
Orange line = 200 EMA Trend Filter
Best For: Traders looking to make 1–2 high-probability trades per week on SPY or other highly liquid assets.
Timeframes: Works well on 2-min, 15-min, and daily charts.
Box with RSI Div(Dynamic Adjustment + MA)Script Description: Dynamic Box Range with RSI Divergence and MA Ribbon Strategy
This script is a comprehensive trading strategy combining RSI divergence, a box range breakout system, and a moving average ribbon strategy. It is designed to generate dynamic entries and exits for both long and short positions while enabling integration with OKX trading bots for automated signal execution. Below is a detailed breakdown of the script's components:
1. General Overview
Name: Box Range with RSI Divergence and Dynamic Adjustment + MA Ribbon Strategy
Purpose:
To identify trade opportunities using a combination of RSI divergence, price action within a box range, and moving average conditions.
To dynamically adjust position sizes and integrate with OKX trading bots for automated trade execution.
Features:
Dynamic position sizing for entries and exits.
Customizable parameters for box range length, RSI settings, and moving averages.
Alert generation for integration with OKX bots.
2. Key Components
A. Box Range Logic
Definition:
The box range is defined by the highest high and lowest low of the price over a customizable lookback period (boxLength).
Used to detect potential breakout or breakdown levels.
Components:
highestHigh: The highest high over the box range period.
lowestLow: The lowest low over the box range period.
Visualization:
The box range's upper and lower bounds are plotted on the chart with green (upper) and red (lower) lines.
B. RSI Divergence Detection
RSI Calculation:
The Relative Strength Index (RSI) is calculated using a customizable period (rsiLength).
Divergence Conditions:
Bullish Divergence:
Price forms lower lows, but RSI forms higher lows.
Bearish Divergence:
Price forms higher highs, but RSI forms lower highs.
Purpose:
Divergences indicate potential trend reversals and are used as trade entry signals.
C. Moving Average Ribbon Strategy
Moving Averages:
Includes 4 moving averages: MA20, MA50, MA100, and MA200.
Users can customize the type (SMA, EMA, etc.) and period of these moving averages.
The moving averages are calculated using a customizable timeframe (e.g., 4H).
Trend Conditions:
Uptrend:
MA20 > MA50 > MA100 > MA200, and price is above MA20.
Downtrend:
MA20 < MA50 < MA100 < MA200, and price is below MA20.
D. Dynamic Position Sizing
Dynamic Adjustment:
The script dynamically adjusts position size (entry and exit percentages) based on the difference between the current price and the average entry price (avgPrice).
Long Position:
Adds to the position if the price drops below the average price.
Reduces the position if the price rises significantly above the average price.
Short Position:
Closes part of the position if the price falls significantly below the average price.
Adds to the position if the price rises above the average price.
E. OKX Bot Integration
Signal Configuration:
The script generates alerts compatible with OKX trading bots.
Signals include parameters such as:
action: Indicates whether to enter or exit a position.
instrument: The trading pair (symbol).
orderType: Market or limit orders.
investmentType: Specifies how the trade size is calculated (e.g., percentage of balance or equity).
amount: The size of the trade.
Alerts are sent via alert() for automated trading.
3. Signal Logic
A. Long Signals
Conditions:
Price is at or below the lower box range (lowestLow).
A bullish RSI divergence is detected.
An uptrend is confirmed by the moving averages (MA20 > MA50 > MA100 > MA200).
Actions:
Enter a long position with dynamically calculated size.
Display a "BUY" label on the chart.
Trigger an alert for OKX integration.
B. Short Signals
Conditions:
Price is at or above the upper box range (highestHigh).
A bearish RSI divergence is detected.
A downtrend is confirmed by the moving averages (MA20 < MA50 < MA100 < MA200).
Actions:
Enter a short position with dynamically calculated size.
Display a "SELL" label on the chart.
Trigger an alert for OKX integration.
C. Position Adjustments
Long Adjustments:
Increase position size if the price drops below the average entry price.
Reduce position size if the price rises above the average entry price.
Short Adjustments:
Increase position size if the price rises above the average entry price.
Reduce position size if the price falls below the average entry price.
4. Visualization
Box Range:
Green line for the upper range (resistance).
Red line for the lower range (support).
Moving Averages:
MA20 (yellow), MA50 (orange), MA100 (red), MA200 (maroon).
Signal Labels:
"BUY" label for long signals (green).
"SELL" label for short signals (red).
Dynamic Position Info:
Displays entry/exit percentages and price levels.
5. Customizable Parameters
Box Range:
boxLength: The lookback period for the box range.
RSI:
rsiLength: The calculation period for RSI.
divergenceLookback: The number of bars to check for divergence.
Moving Averages:
Type (SMA, EMA, etc.).
Periods for MA20, MA50, MA100, and MA200.
Timeframe for moving average calculations (e.g., 4H).
Position Sizing:
Minimum and maximum percentage limits for entry and exit adjustments.
6. Alerts
Alerts are generated for:
Long entry signals.
Short entry signals.
Long and short position exits.
Alert messages are formatted for OKX bot compatibility, including all necessary parameters.
7. Use Cases
This script is ideal for:
Automated Trading:
Integrates easily with OKX bots for hands-free trading.
Trend and Range Trading:
Combines breakout strategies with trend confirmation.
Dynamic Risk Management:
Adjusts position sizes dynamically based on market conditions.
This script provides a powerful combination of indicators and logic, enabling traders to capitalize on both trend-following and counter-trend opportunities while dynamically managing positions.

Arena-Hub-DC-Strategy V3.1This script must be individually configured for each cryptocurrency. After monitoring several coins, I’ve realized that each one requires its own unique setup. There's no “one-size-fits-all” — and different timeframes require different configurations as well.
⚠️ Risk management is essential.
If you're not familiar with proper risk management, please do not use this script. Make sure to configure your commission and slippage settings appropriately, as these are critical for realistic backtesting results. The Stop Loss and Take Profit levels are not automated — they must be adjusted by the user.
This script is not a financial advisor. It won't make risk or profit-related decisions for you. It's a tool designed to help identify potential entries, trends, and exit opportunities — but all final decisions must be made by the trader.
The default settings are only examples. You’ll need to customize them for each crypto asset and timeframe to make the strategy truly work for your style and market conditions.
The script evaluates:
The positioning of two RSIs relative to each other
Their alignment with a customizable RSI-EMA
The values of EMAs and the ATR (volatility)
A custom weighting system using ADR and VOLUME, which strongly affects trade signals. The weights can be adjusted in 0.1 increments, and even small changes can have a big impact — so fine-tuning is important!
These indicators were chosen because they complement each other:
RSI and its EMA help identify momentum shifts
ATR gauges volatility to confirm market conditions
ADR and VOLUME help filter weak signals and fine-tune entries and exits
🔍 Important: Only use this script if you understand how RSI, EMA, ATR, ADR, and VOLUME indicators work, and are comfortable making your own trading decisions.
The backtest results are based on historical data — the script cannot see the future, not even guess it. Please use it responsibly.
This script is an advanced trend-following strategy that dynamically combines RSI, SMA, EMA, ATR, ADX, and volume indicators using a unique weighting and filtering mechanism. Instead of simply combining traditional indicators, it applies them in a unique way:
✅ Dual RSI Comparison: The strategy utilizes two RSI indicators, analyzing their relative movement to filter out false signals and provide more precise entry points.
✅ Custom Entry and Exit Rules: EMA crossovers alone do not generate signals; instead, they go through a dynamic RSI filter that takes market volatility into account using ATR and ADX.
✅ Intelligent Trend Identification: Instead of standard moving averages, a uniquely weighted SMA/EMA system is used to assess trend strength and stability.
✅ ATR, ADX & Volume-Based Weighting: The EMA length is dynamically adjusted based on ATR, ADX, and volume, allowing moving averages to react faster in strong trends while smoothing out in choppy markets.
Advanced Dynamic EMA Zone
This is not your typical EMA indicator. It's an enhanced, dynamically adaptive trend zone that:
✅ Applies gradient shading – The zone between EMAs is divided into four layers, highlighting trend strength through smooth color transitions.
✅ Visualizes trend intensity – The strongest trends appear in the darkest shades, while weaker moves fade into lighter tones.
✅ Brings moving averages to life – Instead of static lines, it creates a visually intuitive trend channel.
✅ Differentiates bullish & bearish phases – The cloud fades from dark green to light green during an uptrend and from dark red to light red in a downtrend.
✅ Filters out market noise – Weakening trends appear more transparent, instantly revealing when momentum starts to fade.
✅ Enhances decision-making – Crossovers alone are not trading signals, but the visual representation helps identify market conditions at a glance.
➡️ What makes it unique?
Traditional moving average indicators rely on basic lines, but this is a full-fledged trend visualization system, helping traders filter noise and better understand price momentum.
🔄 Improved Custom EMA Smoothing Control
We’ve enhanced the weighting factor input for better user control! Previously, the EMA smoothing factor (ema1_smooth_factor) had a fixed step size that limited precision. Now, users can fine-tune it in 0.1 increments for greater flexibility.
✅ What’s new?
More precise control over EMA smoothing with adjustable step size (step=0.1).
Better adaptability to different market conditions.
Smoother trend visualization for traders who prefer fine-tuned settings.
This update ensures our custom EMA visualization remains superior to standard indicators. 🎯🔥

Moving Average Shift WaveTrend StrategyMoving Average Shift WaveTrend Strategy
🧭 Overview
The Moving Average Shift WaveTrend Strategy is a trend-following and momentum-based trading system designed to be overlayed on TradingView charts. It executes trades based on the confluence of multiple technical conditions—volatility, session timing, trend direction, and oscillator momentum—to deliver logical and systematic trade entries and exits.
🎯 Strategy Objectives
Enter trades aligned with the prevailing long-term trend
Exit trades on confirmed momentum reversals
Avoid false signals using session timing and volatility filters
Apply structured risk management with automatic TP, SL, and trailing stops
⚙️ Key Features
Selectable MA types: SMA, EMA, SMMA (RMA), WMA, VWMA
Dual-filter logic using a custom oscillator and moving averages
Session and volatility filters to eliminate low-quality setups
Trailing stop, configurable Take Profit / Stop Loss logic
“In-wave flag” prevents overtrading within the same trend wave
Visual clarity with color-shifting candles and entry/exit markers
📈 Trading Rules
✅ Long Entry Conditions:
Price is above the selected MA
Oscillator is positive and rising
200-period EMA indicates an uptrend
ATR exceeds its median value (sufficient volatility)
Entry occurs between 09:00–17:00 (exchange time)
Not currently in an active wave
🔻 Short Entry Conditions:
Price is below the selected MA
Oscillator is negative and falling
200-period EMA indicates a downtrend
All other long-entry conditions are inverted
❌ Exit Conditions:
Take Profit or Stop Loss is hit
Opposing signals from oscillator and MA
Trailing stop is triggered
🛡️ Risk Management Parameters
Pair: ETH/USD
Timeframe: 4H
Starting Capital: $3,000
Commission: 0.02%
Slippage: 2 pips
Risk per Trade: 2% of account equity (adjustable)
Total Trades: 224
Backtest Period: May 24, 2016 — April 7, 2025
Note: Risk parameters are fully customizable to suit your trading style and broker conditions.
🔧 Trading Parameters & Filters
Time Filter: Trades allowed only between 09:00–17:00 (exchange time)
Volatility Filter: ATR must be above its median value
Trend Filter: Long-term 200-period EMA
📊 Technical Settings
Moving Average
Type: SMA
Length: 40
Source: hl2
Oscillator
Length: 15
Threshold: 0.5
Risk Management
Take Profit: 1.5%
Stop Loss: 1.0%
Trailing Stop: 1.0%
👁️ Visual Support
MA and oscillator color changes indicate directional bias
Clear chart markers show entry and exit points
Trailing stops and risk controls are transparently managed
🚀 Strategy Improvements & Uniqueness
In-wave flag avoids repeated entries within the same trend phase
Filtering based on time, volatility, and trend ensures higher-quality trades
Dynamic high/low tracking allows precise trailing stop placement
Fully rule-based execution reduces emotional decision-making
💡 Inspirations & Attribution
This strategy is inspired by the excellent concept from:
ChartPrime – “Moving Average Shift”
It expands on the original idea with advanced trade filters and trailing logic.
Source reference:
📌 Summary
The Moving Average Shift WaveTrend Strategy offers a rule-based, reliable approach to trend trading. By combining trend and momentum filters with robust risk controls, it provides a consistent framework suitable for various market conditions and trading styles.
⚠️ Disclaimer
This script is for educational purposes only. Trading involves risk. Always use proper backtesting and risk evaluation before applying in live markets.

TrendTwisterV1.5 (Forex Ready + Indicators)A Precision Trend-Following TradingView Strategy for Forex**
HullShiftFX is a Pine Script strategy for TradingView that combines the power of the **Hull Moving Average (HMA)** and a **shifted Exponential Moving Average (EMA)** with multi-layered momentum filters including **RSI** and **dual Stochastic Oscillators**.
It’s designed for traders looking to catch high-probability breakouts with tight risk management and visual clarity.
Chart settings:
1. Select "Auto - Fits data to screen"
2. Please Select "Scale Price Chart Only" (To make the chart not squished)
### ✅ Entry Conditions
**Long Position:**
- Price closes above the 12-period Hull Moving Average.
- Price closes above the 5-period EMA shifted forward by 2 bars.
- RSI is above 50.
- Stochastic Oscillator (12,3,3) %K is above 50.
- Stochastic Oscillator (5,3,3) %K is above 50.
- Hull MA crosses above the shifted EMA.
**Short Position:**
- Price closes below the 12-period Hull Moving Average.
- Price closes below the 5-period EMA shifted forward by 2 bars.
- RSI is below 50.
- Stochastic Oscillator (12,3,3) %K is below 50.
- Stochastic Oscillator (5,3,3) %K is below 50.
- Hull MA crosses below the shifted EMA.
---
## 📉 Risk Management
- **Stop Loss:** Set at the low (for long) or high (for short) of the previous 2 candles.
- **Take Profit:** Calculated at a risk/reward ratio of **1.65x** the stop loss distance.
---
## 📊 Indicators Used
- **Hull Moving Average (12)**
- **Exponential Moving Average (5) **
- **Relative Strength Index (14)**
- **Stochastic Oscillators:**
- %K (12,3,3)
- %K (5,3,3)

[SM-042] EMA 5-8-13 with ADX FilterWhat is the strategy?
The strategy combines three exponential moving averages (EMAs) — 5, 8, and 13 periods — with an optional ADX (Average Directional Index) filter. It is designed to enter long or short positions based on EMA crossovers and to exit positions when the price crosses a specific EMA. The ADX filter, if enabled, adds a condition that only allows trades when the ADX value is above a certain threshold, indicating trend strength.
Who is it for?
This strategy is for traders leveraging EMAs and trend strength indicators to make trade decisions. It can be used by anyone looking for a simple trend-following strategy, with the flexibility to adjust for trend strength using the ADX filter.
When is it used?
- **Long trades**: When the 5-period EMA crosses above the 8-period EMA, with an optional ADX condition (if enabled) that requires the ADX value to be above a specified threshold.
- **Short trades**: When the 5-period EMA crosses below the 8-period EMA, with the ADX filter again optional.
- **Exits**: The strategy exits a long position when the price falls below the 13-period EMA and exits a short position when the price rises above the 13-period EMA.
Where is it applied?
This strategy is applied on a chart with any asset on TradingView, with the EMAs and ADX plotted for visual reference. The strategy uses `strategy.entry` to open positions and `strategy.close` to close them based on the set conditions.
Why is it useful?
This strategy helps traders identify trending conditions and filter out potential false signals by using both EMAs (to capture short-term price movements) and the ADX (to confirm the strength of the trend). The ADX filter can be turned off if not desired, making the strategy flexible for both trending and range-bound markets.
How does it work?
- **EMA Crossover**: The strategy enters a long position when the 5-period EMA crosses above the 8-period EMA, and enters a short position when the 5-period EMA crosses below the 8-period EMA.
- **ADX Filter**: If enabled, the strategy checks whether the ADX value is above a set threshold (default is 20) before allowing a trade.
- **Exit Conditions**: Long positions are closed when the price falls below the 13-period EMA, and short positions are closed when the price rises above the 13-period EMA.
- **Plotting**: The strategy plots the three EMAs and the ADX value on the chart for visualization. It also displays a horizontal line at the ADX threshold.
This setup allows for clear decision-making based on the interaction between different time-frame EMAs and trend strength as indicated by ADX.

Trailing Monster StrategyTrailing Monster Strategy
This is an experimental trend-following strategy that incorporates a custom adaptive moving average (PKAMA), RSI-based momentum filtering, and dynamic trailing stop-loss logic. It is designed for educational and research purposes only, and may require further optimization or risk management considerations prior to live deployment.
Strategy Logic
The strategy attempts to participate in sustained price trends by combining:
- A Power Kaufman Adaptive Moving Average (PKAMA) for dynamic trend detection,
- RSI and Simple Moving Average (SMA) filters for market condition confirmation,
- A delayed trailing stop-loss to manage exits once a trade is in profit.
Entry Conditions
Long Entry:
- RSI exceeds the overbought threshold (default: 70),
- Price is trading above the 200-period SMA,
- PKAMA slope is positive (indicating upward momentum),
- A minimum number of bars have passed since the last entry.
Short Entry:
- RSI falls below the oversold threshold (default: 30),
- Price is trading below the 200-period SMA,
- PKAMA slope is negative (indicating downward momentum),
-A minimum number of bars have passed since the last entry.
Exit Conditions
- A trailing stop-loss is applied once the position has been open for a user-defined number of bars.
- The trailing distance is calculated as a fixed percentage of the average entry price.
Technical Notes
This script implements a custom version of the Power Kaufman Adaptive Moving Average (PKAMA), conceptually inspired by alexgrover’s public implementation on TradingView .
Unlike traditional moving averages, PKAMA dynamically adjusts its responsiveness based on recent market volatility, allowing it to better capture trend changes in fast-moving assets like altcoins.
Disclaimer
This strategy is provided for educational purposes only.
It is not financial advice, and no guarantee of profitability is implied.
Always conduct thorough backtesting and forward testing before using any strategy in a live environment.
Adjust inputs based on your individual risk tolerance, asset class, and trading style.
Feedback is encouraged. You are welcome to fork and modify this script to suit your own preferences and market approach.

Reversal Trading Bot Strategy[BullByte]Overview :
The indicator Reversal Trading Bot Strategy is crafted to capture potential market reversal points by combining momentum, volatility, and trend alignment filters. It uses a blend of technical indicators to identify both bullish and bearish reversal setups, ensuring that multiple market conditions are met before entering a trade.
Core Components :
Technical Indicators Used :
RSI (Relative Strength Index) :
Purpose : Detects divergence conditions by comparing recent lows/highs in price with the RSI.
Parameter : Length of 8.
Bollinger Bands (BB) :
Purpose : Measures volatility and identifies price levels that are statistically extreme.
Parameter : Length of 20 and a 2-standard deviation multiplier.
ADX (Average Directional Index) & DMI (Directional Movement Index) :
Purpose : Quantifies the strength of the trend. The ADX threshold is set at 20, and additional filters check for the alignment of the directional indicators (DI+ and DI–).
ATR (Average True Range) :
Purpose : Provides a volatility measure used to set stop levels and determine risk through trailing stops.
Volume SMA (Simple Moving Average of Volume ):
Purpose : Helps confirm strength by comparing the current volume against a 20-period average, with an optional filter to ensure volume is at least twice the SMA.
User-Defined Toggle Filters :
Volume Filter : Confirms that the volume is above average (or twice the SMA) before taking trades.
ADX Trend Alignment Filter : Checks that the ADX’s directional indicators support the trade direction.
BB Close Confirmation : Optionally refines the entry by requiring price to be beyond the upper or lower Bollinger Band rather than just above or below.
RSI Divergence Exit : Allows the script to close positions if RSI divergence is detected.
BB Mean Reversion Exit : Closes positions if the price reverts to the Bollinger Bands’ middle line.
Risk/Reward Filter : Ensures that the potential reward is at least twice the risk by comparing the distance to the Bollinger Band with the ATR.
Candle Movement Filter : Optional filter to require a minimum percentage move in the candle to confirm momentum.
ADX Trend Exit : Closes positions if the ADX falls below the threshold and the directional indicators reverse.
Entry Conditions :
Bullish Entry :
RSI Divergence : Checks if the current close is lower than a previous low while the RSI is above the previous low, suggesting bullish divergence.
Bollinger Confirmation : Requires that the price is above the lower (or upper if confirmation is toggled) Bollinger Band.
Volume & Trend Filters : Combines volume condition, ADX strength, and an optional candle momentum condition.
Risk/Reward Check : Validates that the trade meets a favorable risk-to-reward ratio.
Bearish Entry :
Uses a mirror logic of the bullish entry by checking for bearish divergence, ensuring the price is below the appropriate Bollinger level, and confirming volume, trend strength, candle pattern, and risk/reward criteria.
Trade Execution and Exit Strateg y:
Trade Execution :
Upon meeting the entry conditions, the strategy initiates a long or short position.
Stop Loss & Trailing Stops :
A stop-loss is dynamically set using the ATR value, and trailing stops are implemented as a percentage of the close price.
Exit Conditions :
Additional exit filters can trigger early closures based on RSI divergence, mean reversion (via the middle Bollinger Band), or a weakening trend as signaled by ADX falling below its threshold.
This multi-layered exit strategy is designed to lock in gains or minimize losses if the market begins to reverse unexpectedly.
How the Strategy Works in Different Market Conditions :
Trending Markets :
The ADX filter ensures that trades are only taken when the trend is strong. When the market is trending, the directional movement indicators help confirm the momentum, making the reversal signal more reliable.
Ranging Markets :
In choppy markets, the Bollinger Bands expand and contract, while the RSI divergence can highlight potential turning points. The optional filters can be adjusted to avoid false signals in low-volume or low-volatility conditions.
Volatility Management :
With ATR-based stop-losses and a risk/reward filter, the strategy adapts to current market volatility, ensuring that risk is managed consistently.
Recommendation on using this Strategy with a Trading Bot :
This strategy is well-suited for high-frequency trading (HFT) due to its ability to quickly identify reversal setups and execute trades dynamically with automated stop-loss and trailing exits. By integrating this script with a TradingView webhook-based bot or an API-driven execution system, traders can automate trade entries and exits in real-time, reducing manual execution delays and capitalizing on fast market movements.
Disclaimer :
This script is provided for educational and informational purposes only. It is not intended as investment advice. Trading involves significant risk, and you should always conduct your own research and analysis before making any trading decisions. The author is not responsible for any losses incurred while using this script.

Smart Grid Scalping (Pullback) Strategy[BullByte]The Smart Grid Scalping (Pullback) Strategy is a high-frequency trading strategy designed for short-term traders who seek to capitalize on market pullbacks. This strategy utilizes a dynamic ATR-based grid system to define optimal entry points, ensuring precise trade execution. It integrates volatility filtering and an RSI-based confirmation mechanism to enhance signal accuracy and reduce false entries.
This strategy is specifically optimized for scalping by dynamically adjusting trade levels based on current market conditions. The grid-based system helps capture retracement opportunities while maintaining strict trade management through predefined profit targets and trailing stop-loss mechanisms.
Key Features :
1. ATR-Based Grid System :
- Uses a 10-period ATR to dynamically calculate grid levels for entry points.
- Prevents chasing trades by ensuring price has reached key levels before executing entries.
2. No Trade Zone Protection :
- Avoids low-volatility zones where price action is indecisive.
- Ensures only high-momentum trades are executed to improve success rate.
3. RSI-Based Entry Confirmation :
- Long trades are triggered when RSI is below 30 (oversold) and price is in the lower grid zone.
- Short trades are triggered when RSI is above 70 (overbought) and price is in the upper grid zone.
4. Automated Trade Execution :
- Long Entry: Triggered when price drops below the first grid level with sufficient volatility.
- Short Entry: Triggered when price exceeds the highest grid level with sufficient volatility.
5. Take Profit & Trailing Stop :
- Profit target set at a customizable percentage (default 0.2%).
- Adaptive trailing stop mechanism using ATR to lock in profits while minimizing premature exits.
6. Visual Trade Annotations :
- Clearly labeled "LONG" and "SHORT" markers appear at trade entries for better visualization.
- Grid levels are plotted dynamically to aid decision-making.
Strategy Logic :
- The script first calculates the ATR-based grid levels and ensures price action has sufficient volatility before allowing trades.
- An additional RSI filter is used to ensure trades are taken at ideal market conditions.
- Once a trade is executed, the script implements a trailing stop and predefined take profit to maximize gains while reducing risks.
---
Disclaimer :
Risk Warning :
This strategy is provided for educational and informational purposes only. Trading involves significant risk, and past performance is not indicative of future results. Users are advised to conduct their own due diligence and risk management before using this strategy in live trading.
The developer and publisher of this script are not responsible for any financial losses incurred by the use of this strategy. Market conditions, slippage, and execution quality can affect real-world trading outcomes.
Use this script at your own discretion and always trade responsibly.

RSI Pro+ (Bear market, financial crisis and so on EditionIn markets defined by volatility, fear, and uncertainty – the battlegrounds of bear markets and financial crises – you need tools forged in resilience. Introducing RSI Pro+, a strategy built upon a legendary indicator born in 1978, yet engineered with modern visual clarity to remain devastatingly effective even in the chaotic financial landscapes of 3078.
This isn't about complex algorithms predicting the unpredictable. It's about harnessing the raw, time-tested power of the Relative Strength Index (RSI) to identify potential exhaustion points and capitalize on oversold conditions. RSI Pro+ cuts through the noise, providing clear, actionable signals when markets might be poised for a relief bounce or reversal.
Core Technology (The 1978 Engine):
RSI Crossover Entry: The strategy initiates a LONG position when the RSI (default period 11) crosses above a user-defined low threshold (default 30). This classic technique aims to enter when selling pressure may be waning, offering potential entry points during sharp downturns or periods of consolidation after a fall.
Modern Enhancements (The 3078 Cockpit):
RSI Pro+ isn't just about the signal; it's about providing a professional-grade visual experience directly on your chart:
Entry Bar Highlight: A subtle background flash on the chart signals the exact bar where the RSI crossover condition is met, alerting you to potential entry opportunities.
Trade Bar Coloring: Once a trade is active, the price bars are subtly colored, giving you immediate visual confirmation that the strategy is live in the market.
Entry Price Line: A clear, persistent line marks your exact average entry price for the duration of the trade, serving as a crucial visual anchor.
Take Profit Line: Your calculated Take Profit target is plotted as a distinct line, keeping your objective clearly in sight.
Custom Entry Marker: A precise shape (▲) appears below the bar where the trade entry was actually executed, pinpointing the start of the position.
On-Chart Info Table (HUD): A clean, customizable Heads-Up Display appears when a trade is active, showing vital information at a glance:
Entry Price: Your position's average cost basis.
TP Target: The calculated price level for your Take Profit exit.
Current PnL%: Real-time Profit/Loss percentage for the open trade.
Full Customization: Nearly every aspect is configurable via the settings menu:
RSI Period & Crossover Level
Take Profit Percentage
Toggle ALL visual enhancements on/off individually
Position the Info Table wherever you prefer on the chart.
How to Use RSI Pro+:
Add to Chart: Apply the "RSI Pro+ (Bear market...)" strategy to your TradingView chart. Ensure any previous versions are removed.
Access Settings: Click the cogwheel icon (⚙️) next to the strategy name on your chart.
Configure Inputs (Crucial Step):
RSI Crossover Level: This is key. The default (30) targets standard oversold conditions. In severe downturns, you might experiment with lower levels (e.g., 25, 20) or higher ones (e.g., 40) depending on the asset and timeframe. Observe where RSI(11) typically bottoms out on your chart.
Take Profit Percentage (%): Define your desired profit target per trade (e.g., enter 0.5 for 0.5%, 1.0 for 1%). The default is a very small 0.11%.
RSI Period: While default is 11, you can adjust this (e.g., the standard 14).
Visual Enhancements: Enable or disable the visual features (background highlights, bar coloring, lines, markers, table) according to your preference using the checkboxes. Adjust table position.
Observe & Backtest: Watch how the strategy behaves on your chosen asset and timeframe. Use TradingView's Strategy Tester to analyze historical performance based on your settings. No strategy works perfectly everywhere; testing is essential.
Important Considerations:
Risk Management: This specific script version focuses on a Take Profit exit. It does not include an explicit Stop Loss. You MUST manage risk through appropriate position sizing, potentially adding a Stop Loss manually, or by modifying the script.
Oversold ≠ Reversal: An RSI crossover is an indicator of potential exhaustion, not a guarantee of a price reversal.
Fixed TP: A fixed percentage TP ensures small wins but may exit before larger potential moves.
Backtesting Limitations: Past performance does not guarantee future results.
RSI Pro+ strips away complexity to focus on a robust, time-honored principle, enhanced with modern visuals for the discerning trader navigating today's (and tomorrow's) challenging markets