Dynamic Score PSAR [QuantAlgo]Dynamic Score PSAR 📈🧬
The Dynamic Score PSAR by QuantAlgo introduces an innovative approach to trend detection by utilizing a dynamic trend scoring technique in combination with the Parabolic SAR. This method goes beyond traditional trend-following indicators by evaluating market momentum through a scoring system that analyzes price behavior over a customizable window. By dynamically adjusting to evolving market conditions, this indicator provides clearer, more adaptive trend signals that help traders and investors anticipate market reversals and capitalize on momentum shifts with greater precision.
💫 Conceptual Foundation and Innovation
At the core of the Dynamic Score PSAR is the dynamic trend score system, which assesses price movements by comparing normalized PSAR values across a range of historical data points. This dynamic trend scoring technique offers a unique, probabilistic approach to trend analysis by evaluating how the current market compares to past price movements. Unlike traditional PSAR indicators that rely on static parameters, this scoring mechanism allows the indicator to adjust in real time to market fluctuations, offering traders and investors a more responsive and insightful view of trends. This innovation makes the Dynamic Score PSAR particularly effective in detecting shifts in momentum and potential reversals, even in volatile or complex market environments.
✨ Technical Composition and Calculation
The Dynamic Score PSAR is composed of several advanced components designed to provide a higher probability of detecting accurate trend shifts. The key innovation lies in the dynamic trend scoring technique, which iterates over historical PSAR values and evaluates price momentum through a dynamic scoring system. By comparing the current normalized PSAR value with previous data points over a user-defined window, the system generates a score that reflects the strength and direction of the trend. This allows for a more refined and responsive detection of trends compared to static, traditional indicators.
To enhance clarity, the PSAR values are normalized against an Exponential Moving Average (EMA), providing a standardized framework for comparison. This normalization ensures that the indicator adapts dynamically to market conditions, making it more effective in volatile markets. The smoothing process reduces noise, helping traders and investors focus on significant trend signals.
Additionally, users can adjust the length of the data window and the sensitivity thresholds for detecting uptrends and downtrends, providing flexibility for different trading and investing environments.
📈 Features and Practical Applications
Customizable Window Length: Adjust the window length to control the indicator’s sensitivity to recent price movements. This provides flexibility for short-term or long-term trend analysis.
Uptrend/Downtrend Thresholds: Set customizable thresholds for identifying uptrends and downtrends. These thresholds define when trend signals are triggered, offering adaptability to different market conditions.
Bar Coloring and Gradient Visualization: Visual cues, including color-coded bars and gradient fills, make it easier to interpret market trends and identify key moments for potential trend reversals.
Momentum Confirmation: The dynamic trend scoring system evaluates price action over time, providing a probabilistic measure of market momentum to confirm the strength and direction of a trend.
⚡️ How to Use
✅ Add the Indicator: Add the Dynamic Score PSAR to your favourites, then to your chart and adjust the PSAR settings, window length, and trend thresholds to match your preferences. Customize the sensitivity to price movements by tweaking the window length and thresholds for different market conditions.
👀 Monitor Trend Shifts: Watch for trend changes as the normalized PSAR values cross key thresholds, and use the dynamic score to confirm the strength and direction of trends. Bar coloring and background fills visually highlight key moments for trend shifts, making it easier to spot reversals.
🔔 Set Alerts: Configure alerts for significant trend crossovers and reversals, ensuring you can act on market movements promptly, even when you’re not actively monitoring the charts.
🌟 Summary and Usage Tips
The Dynamic Score PSAR by QuantAlgo is a powerful tool that combines traditional trend-following techniques with the flexibility of a dynamic trend scoring system. This innovative approach provides clearer, more adaptive trend signals, reducing the risk of false entries and exits while helping traders and investors capture significant market moves. The ability to adjust the indicator’s sensitivity and thresholds makes it versatile across different trading and investing environments, whether you’re focused on short-term pivots or long-term trend reversals. To maximize its effectiveness, fine-tune the sensitivity settings based on current market conditions and use the visual cues to confirm trend shifts.
Oscillaltor

RSI (Kernel Optimized) | Flux Charts💎 GENERAL OVERVIEW
Introducing our new KDE Optimized RSI Indicator! This indicator adds a new aspect to the well-known RSI indicator, with the help of the KDE (Kernel Density Estimation) algorithm, estimates the probability of a candlestick will be a pivot or not. For more information about the process, please check the "HOW DOES IT WORK ?" section.
Features of the new KDE Optimized RSI Indicator :
A New Approach To Pivot Detection
Customizable KDE Algorithm
Realtime RSI & KDE Dashboard
Alerts For Possible Pivots
Customizable Visuals
❓ HOW TO INTERPRET THE KDE %
The KDE % is a critical metric that reflects how closely the current RSI aligns with the KDE (Kernel Density Estimation) array. In simple terms, it represents the likelihood that the current candlestick is forming a pivot point based on historical data patterns. a low percentage suggests a lower probability of the current candlestick being a pivot point. In these cases, price action is less likely to reverse, and existing trends may continue. At moderate levels, the possibility of a pivot increases, indicating potential trend shifts or consolidations.Traders should start monitoring closely for confirmation signals. An even higher KDE % suggests a strong likelihood that the current candlestick could form a pivot point, which could lead to a reversal or significant price movement. These points often align with overbought or oversold conditions in traditional RSI analysis, making them key moments for potential trade entry or exit.
📌 HOW DOES IT WORK ?
The RSI (Relative Strength Index) is a widely used oscillator among traders. It outputs a value between 0 - 100 and gives a glimpse about the current momentum of the price action. This indicator then calculates the RSI for each candlesticks, and saves them into an array if the candlestick is a pivot. The low & high pivot RSIs' are inserted into two different arrays. Then the a KDE array is calculated for both of the low & high pivot RSI arrays. Explaining the KDE might be too much for this write-up, but for a brief explanation, here are the steps :
1. Define the necessary options for the KDE function. These are : Bandwidth & Nº Steps, Array Range (Array Max - Array Min)
2. After that, create a density range array. The array has (steps * 2 - 1) elements and they are calculated by (arrMin + i * stepCount), i being the index.
3. Then, define a kernel function. This indicator has 3 different kernel distribution modes : Uniform, Gaussian and Sigmoid
4. Then, define a temporary value for the current element of KDE array.
5. For each element E in the pivot RSI array, add "kernel(densityRange.get(i) - E, 1.0 / bandwidth)" to the temporary value.
6. Add 1.0 / arrSize * to the KDE array.
Then the prefix sum array of the KDE array is calculated. For each candlestick, the index closest to it's RSI value in the KDE array is found using binary search. Then for the low pivot KDE calculation, the sum of KDE values from found index to max index is calculated. For the high pivot KDE, the sum of 0 to found index is used. Then if high or low KDE value is greater than the activation threshold determined in the settings, a bearish or bullish arrow is plotted after bar confirmation respectively. The arrows are drawn as long as the KDE value of current candlestick is greater than the threshold. When the KDE value is out of the threshold, a less transparent arrow is drawn, indicating a possible pivot point.
🚩 UNIQUENESS
This indicator combines RSI & KDE Algorithm to get a foresight of possible pivot points. Pivot points are important entry, confirmation and exit points for traders. But to their nature, they can be only detected after more candlesticks are rendered after them. The purpose of this indicator is to alert the traders of possible pivot points using KDE algorithm right away when they are confirmed. The indicator also has a dashboard for realtime view of the current RSI & Bullish or Bearish KDE value. You can fully customize the KDE algorithm and set up alerts for pivot detection.
⚙️ SETTINGS
1. RSI Settings
RSI Length -> The amount of bars taken into account for RSI calculation.
Source -> The source value for RSI calculation.
2. Pivots
Pivot Lengths -> Pivot lengths for both high & low pivots. For example, if this value is set to 21; 21 bars before AND 21 bars after a candlestick must be higher for a candlestick to be a low pivot.
3. KDE
Activation Threshold -> This setting determines the amount of arrows shown. Higher options will result in more arrows being rendered.
Kernel -> The kernel function as explained in the upper section.
Bandwidth -> The bandwidth variable as explained in the upper section. The smoothness of the KDE function is tied to this setting.
Nº Bins -> The Nº Steps variable as explained in the upper section. It determines the precision of the KDE algorithm.

Inverse Fisher Oscillator [BigBeluga]The Inverse Fisher Oscillator is a powerful tool for identifying market trends and potential reversal points by applying the Inverse Fisher Transform to normalized price data. This indicator plots multiple smoothed oscillators, each color-coded to signify their relation to dynamic volatility bands. Additionally, the Butterworth filter is incorporated to further refine trend signals. The Inverse Fisher Oscillator offers traders a visually appealing and insightful approach to trend analysis and market direction detection.
🔵 KEY FEATURES
● Inverse Fisher Oscillator Visualization
Multiple Oscillators : The indicator calculates and plots six different Inverse Fisher Oscillators, each smoothed at increasing levels to provide a layered view of price momentum.
Color-Coded Signals : The oscillator lines are color-coded based on their relation to the volatility bands—green for bullish momentum, red for bearish momentum, and yellow for neutral movements.
● Butterworth Filter Integration
Filtering : The Butterworth filter is applied to mid-line Bands to reduce noise, allowing for clearer trend detection.
// Calculate constants for the Butterworth filter
float piPrd = math.pi / mid_len
float g = math.sqrt(2)
float a1 = math.exp(-g * piPrd)
float b1 = 2 * a1 * math.cos(g * piPrd)
float coef2 = b1
float coef3 = -a1 * a1
float coef1 = (1 - b1 + a1 * a1) / 4
// Source data for the Butterworth filter
float source = ifish // The first inverse Fisher Oscillator is used as the source
// Previous source and butter filter values
var float butter = na // Initialize the 'butter' variable
// Handle null values using the nz function
float prevB1 = nz(butter , source) // Use 'source' as a fallback if butter is null
float prevB2 = nz(butter , source) // Use 'source' as a fallback if butter is null
// Calculate the Butterworth filter value
butter := coef1 * (source + (2 * source ) + source ) + (coef2 * prevB1) + (coef3 * prevB2)
● Numbered Signal Marks
Signal Markers : The indicator plots numbered signals on the chart when an oscillator crosses above the upper volatility band or below the lower volatility band.
Numbered Lines : Numbers correspond to the different oscillators (1-6), helping traders easily identify which smoothing level generated the signal.
Visual Cues : The signals are color-coded—green for bullish crossovers and red for bearish crossunders—providing clear visual cues for trend accumulation phases.
Mid-Line Option : Traders can choose between plotting the Butterworth filter as a dynamic mid-line or simply displaying it as part of the bands.
Volatility Bands : Dynamic volatility bands provide additional context for interpreting the strength and sustainability of trends.
● Dashboard Display
Real-Time Market Trend Overview : The dashboard in the bottom-right corner of the chart displays the market trend based on the Inverse Fisher Oscillator for six different smoothing levels, providing a clear visual summary of market direction.
Direction Symbols : Directional symbols (up, down, or neutral) are displayed in the dashboard, color-coded to represent bullish, bearish, or neutral momentum.
Current Price Display : The dashboard also shows the current price and highlights whether it is above or below the opening price.
🔵 HOW TO USE
● Identifying Trend Reversals
Bullish Reversals : When the oscillators short period lines start to cross above the upper volatility band (green), it indicates potential bullish momentum.
Bearish Reversals : When the oscillator crosses below the lower volatility band (red), it signals potential bearish momentum.
Neutral Signals : When the oscillator remains within the bands (yellow), it suggests that the market is in a neutral or consolidating state. Traders may choose to wait for a clearer trend signal.
● Using the Dashboard for Trend Overview
Market Trend Summary : The dashboard provides a quick overview of market direction across six different smoothing levels. Green arrows indicate bullish momentum, red arrows indicate bearish momentum, and wavy lines suggest neutrality.
Price Context : The dashboard also displays the current price, helping traders quickly assess whether the price is moving in the expected direction relative to their trend analysis.
● Volatility Band Interpretation
Volatility-Based Signals : Pay attention to how the oscillators interact with the volatility bands. Strong trends will often result in oscillators staying above or below the bands, while weaker trends or consolidations will see oscillators hovering within the bands.
🔵 CUSTOMIZATION
Length and Smoothing : Adjust the length and smoothing parameters to fit different market conditions and timeframes.
Bands Multiplier : Customize the multiplier for the volatility bands to make them more or less sensitive to price changes.
Mid-Line Type : Choose whether to display the Butterworth filter as a mid-line or incorporate it into the volatility bands.
Signal Markers : Toggle on or off the number markers for signal crossovers, making it easier to identify key entry and exit points.
🔵 CONCLUSION
The Inverse Fisher Oscillator combines the power of the Inverse Fisher Transform and the Butterworth filter to provide a sophisticated approach to trend and reversal detection. By leveraging volatility-based analysis and visually intuitive signals, this indicator helps traders spot potential entry and exit points with greater clarity. The customizable dashboard display adds further value, offering a real-time summary of market conditions to enhance decision-making. Use this tool in conjunction with other technical analysis methods to develop a well-rounded trading strategy.

GannLSVZO Indicator [Algo Alert]The Volume Zone oscillator breaks up volume activity into positive and negative categories. It is positive when the current closing price is greater than the prior closing price and negative when it's lower than the prior closing price. The resulting curve plots through relative percentage levels that yield a series of buy and sell signals, depending on level and indicator direction.
The Gann Laplace Smoothed Volume Zone Oscillator GannLSVZO is a refined version of the Volume Zone Oscillator, enhanced by the implementation of the upgraded Discrete Fourier Transform, the Laplace Stieltjes Transform. Its primary function is to streamline price data and diminish market noise, thus offering a clearer and more precise reflection of price trends.
By combining the Laplace with Gann Swing Entries and Exits (orange X) and with Ehler's white noise histogram, users gain a comprehensive perspective on volume-related market conditions.
HOW TO USE THE INDICATOR:
The default period is 2 but can be adjusted after backtesting. (I suggest 5 VZO length and NoiceR max length 8 as-well)
The VZO points to a positive trend when it is rising above the 0% level, and a negative trend when it is falling below the 0% level. 0% level can be adjusted in setting by adjusting VzoDifference. Oscillations rising below 0% level or falling above 0% level result in a natural trend.
ORIGINALITY & USFULLNESS:
Personal combination of Gann swings and Laplace Stieltjes Transform of a price which results in less noise Volume Zone Oscillator.
The Laplace Stieltjes Transform is a mathematical technique that transforms discrete data from the time domain into its corresponding representation in the frequency domain. This process involves breaking down a signal into its individual frequency components, thereby exposing the amplitude and phase characteristics inherent in each frequency element.
This indicator utilizes the concept of Ehler's Universal Oscillator and displays a histogram, offering critical insights into the prevailing levels of market noise. The Ehler's Universal Oscillator is grounded in a statistical model that captures the erratic and unpredictable nature of market movements. Through the application of this principle, the histogram aids traders in pinpointing times when market volatility is either rising or subsiding.
The Gann swings and the Gan swing strategy is developed by meomeo105, this Gann high and low algorithm forms the basis of the EMA modification.
DETAILED DESCRIPTION:
My detailed description of the indicator and use cases which I find very valuable.
What is oscillator?
Oscillators are chart indicators that can assist a trader in determining overbought or oversold conditions in ranging (non-trending) markets.
What is volume zone oscillator?
Price Zone Oscillator measures if the most recent closing price is above or below the preceding closing price.
Volume Zone Oscillator is Volume multiplied by the 1 or -1 depending on the difference of the preceding 2 close prices and smoothed with Exponential moving Average.
What does this mean?
If the VZO is above 0 and VZO is rising. We have a bullish trend. Most likely.
If the VZO is below 0 and VZO is falling. We have a bearish trend. Most likely.
Rising means that VZO on close is higher than the previous day.
Falling means that VZO on close is lower than the previous day.
What if VZO is falling above 0 line?
It means we have a high probability of a bearish trend.
Thus the indicator returns 0 and Strategy closes all it's positions when falling above 0 (or rising bellow 0) and we combine higher and lower timeframes to gauge the trend.
What is approximation and smoothing?
They are mathematical concepts for making a discrete set of numbers a
continuous curved line.
Laplace Stieltjes Transform approximation of a close price are taken from aprox library.
Key Features:
You can tailor the Indicator/Strategy to your preferences with adjustable parameters such as VZO length, noise reduction settings, and smoothing length.
Volume Zone Oscillator (VZO) shows market sentiment with the VZO, enhanced with Exponential Moving Average (EMA) smoothing for clearer trend identification.
Noise Reduction leverages Euler's White noise capabilities for effective noise reduction in the VZO, providing a cleaner and more accurate representation of market dynamics.
Choose between the traditional Fast Laplace Stieltjes Transform (FLT) and the innovative Double Discrete Fourier Transform (DTF32) soothed price series to suit your analytical needs.
Use dynamic calculation of Laplace coefficient or the static one. You may modify those inputs and Strategy entries with Gann swings.
I suggest using "Close all" input False when fine-tuning Inputs for 1 TimeFrame. When you export data to Excel/Numbers/GSheets I suggest using "Close all" input as True, except for the lowest TimeFrame. I suggest using 100% equity as your default quantity for fine-tune purposes. I have to mention that 100% equity may lead to unrealistic backtesting results. Be avare. When backtesting for trading purposes use Contracts or USDT.

DSL Oscillator [BigBeluga]DSL Oscillator BigBeluga
The DSL (Discontinued Signal Lines) Oscillator is an advanced technical analysis tool that combines elements of the Relative Strength Index (RSI), Discontinued Signal Lines, and Zero-Lag Exponential Moving Average (ZLEMA). This versatile indicator is designed to help traders identify trend direction, momentum, and potential reversal points in the market.
What are Discontinued Signal Lines (DSL)?
Discontinued Signal Lines are an extension of the traditional signal line concept used in many indicators. While a standard signal line compares an indicator's value to its smoothed (slightly lagging) state, DSL takes this idea further by using multiple adaptive lines that respond to the indicator's current value. This approach provides a more nuanced view of the indicator's state and momentum, making it easier to determine trends and desired states of the indicator.
🔵 KEY FEATURES
● Discontinued Signal Lines (DSL)
Uses multiple adaptive lines that respond to the indicator's value
Provides a more nuanced view of the indicator's state and momentum
Helps determine trends and desired states of the indicator more effectively
Available in "Fast" and "Slow" modes for different responsiveness
Acts as dynamic support and resistance levels for the oscillator
● DSL Oscillator
Based on a combination of RSI and Discontinued Signal Lines
// Discontinued Signal Lines
dsl_lines(src, length)=>
UP = 0.
DN = 0.
UP := (src > ta.sma(src, length)) ? nz(UP ) + dsl_mode / length * (src - nz(UP )) : nz(UP )
DN := (src < ta.sma(src, length)) ? nz(DN ) + dsl_mode / length * (src - nz(DN )) : nz(DN )
Smoothed using Zero-Lag Exponential Moving Average for reduced lag
// Zero-Lag Exponential Moving Average function
zlema(src, length) =>
lag = math.floor((length - 1) / 2)
ema_data = 2 * src - src
ema2 = ta.ema(ema_data, length)
ema2
Oscillates between 0 and 100
Color-coded for easy interpretation of market conditions
● Signal Generation
Generates buy signals when the oscillator crosses above the lower DSL line below 50
Generates sell signals when the oscillator crosses below the upper DSL line above 50
Signals are visualized on both the oscillator and the main chart
● Visual Cues
Background color changes on signal occurrences for easy identification
Candles on the main chart are colored based on the latest signal
Oscillator line color changes based on its position relative to the DSL lines
🔵 HOW TO USE
● Trend Identification
Use the color and position of the DSL Oscillator relative to its Discontinued Signal Lines to determine the overall market trend
● Entry Signals
Look for buy signals (green circles) when the oscillator crosses above the lower DSL line
Look for sell signals (blue circles) when the oscillator crosses below the upper DSL line
Confirm signals with the triangles on the main chart and background color changes
● Exit Signals
Consider exiting long positions on exit signals and short positions on Entery signals
Watch for the oscillator crossing back between the DSL lines as a potential early exit signal
● Momentum Analysis
Strong momentum is indicated when the oscillator moves rapidly towards extremes and away from the DSL lines
Weakening momentum can be spotted when the oscillator struggles to reach new highs or lows, or starts converging with the DSL lines
The space between the DSL lines can indicate potential momentum strength - wider gaps suggest stronger trends
● Confirmation
Use the DSL lines as dynamic support/resistance levels for the oscillator
Look for convergence between oscillator signals and price action on the main chart
Combine signals with other technical indicators or chart patterns for stronger confirmation
🔵 CUSTOMIZATION
The DSL Oscillator offers several customization options:
Adjust the main calculation length for the DSL lines
Choose between "Fast" and "Slow" modes for the DSL lines calculation
By fine-tuning these settings, traders can adapt the DSL Oscillator to various market conditions and personal trading strategies.
The DSL Oscillator provides a multi-faceted approach to market analysis, combining trend identification, momentum assessment, and signal generation in one comprehensive tool. Its dynamic nature and visual cues make it suitable for both novice and experienced traders across various timeframes and markets. The integration of RSI, Discontinued Signal Lines, and ZLEMA offers traders a sophisticated yet intuitive tool to inform their trading decisions.
The use of Discontinued Signal Lines sets this oscillator apart from traditional indicators by providing a more adaptive and nuanced view of market conditions. This can potentially lead to more accurate trend identification and signal generation, especially in markets with varying volatility.
Traders can use the DSL Oscillator to identify trends, spot potential reversals, and gauge market momentum. The combination of the oscillator, dynamic signal lines, and clear visual signals provides a holistic view of market conditions. As with all technical indicators, it's recommended to use the DSL Oscillator in conjunction with other forms of analysis and within the context of a well-defined trading strategy.

S&P Short-Range Oscillator**SHOULD BE USED ON THE S&P 500 ONLY**
The S&P Short-Range Oscillator (SRO), inspired by the principles of Jim Cramer's oscillator, is a technical analysis tool designed to help traders identify potential buy and sell signals in the stock market, specifically for the S&P 500 index. The SRO combines several market indicators to provide a normalized measure of market sentiment, assisting traders in making informed decisions.
The SRO utilizes two simple moving averages (SMAs) of different lengths: a 5-day SMA and a 10-day SMA. It also incorporates the daily price change and market breadth (the net change of closing prices). The 5-day and 10-day SMAs are calculated based on the closing prices. The daily price change is determined by subtracting the opening price from the closing price. Market breadth is calculated as the difference between the current closing price and the previous closing price.
The raw value of the oscillator, referred to as SRO Raw, is the sum of the daily price change, the 5-day SMA, the 10-day SMA, and the market breadth. This raw value is then normalized using its mean and standard deviation over a 20-day period, ensuring that the oscillator is centered and maintains a consistent scale. Finally, the normalized value is scaled to fit within the range of -15 to 15.
When interpreting the SRO, a value below -5 indicates that the market is potentially oversold, suggesting it might be a good time to start buying stocks as the market could be poised for a rebound. Conversely, a value above 5 suggests that the market is potentially overbought. In this situation, it may be prudent to hold on to existing positions or consider selling if you have substantial gains.
The SRO is visually represented as a blue line on a chart, making it easy to track its movements. Red and green horizontal lines mark the overbought (5) and oversold (-5) levels, respectively. Additionally, the background color changes to light red when the oscillator is overbought and light green when it is oversold, providing a clear visual cue.
By incorporating the S&P Short-Range Oscillator into your trading strategy, you can gain valuable insights into market conditions and make more informed decisions about when to buy, sell, or hold your stocks. However, always consider other market factors and perform your own analysis before making any trading decisions.
The S&P Short-Range Oscillator is a powerful tool for traders looking to gain insights into market sentiment. It provides clear buy and sell signals through its combination of multiple indicators and normalization process. However, traders should be aware of its lagging nature and potential complexity, and use it in conjunction with other analysis methods for the best results.
Disclaimer
The S&P Short-Range Oscillator is for informational purposes only and should not be considered financial advice. Trading involves risk, and you should conduct your own research or consult a financial advisor before making investment decisions. The author is not responsible for any losses incurred from using this indicator. Use at your own risk.
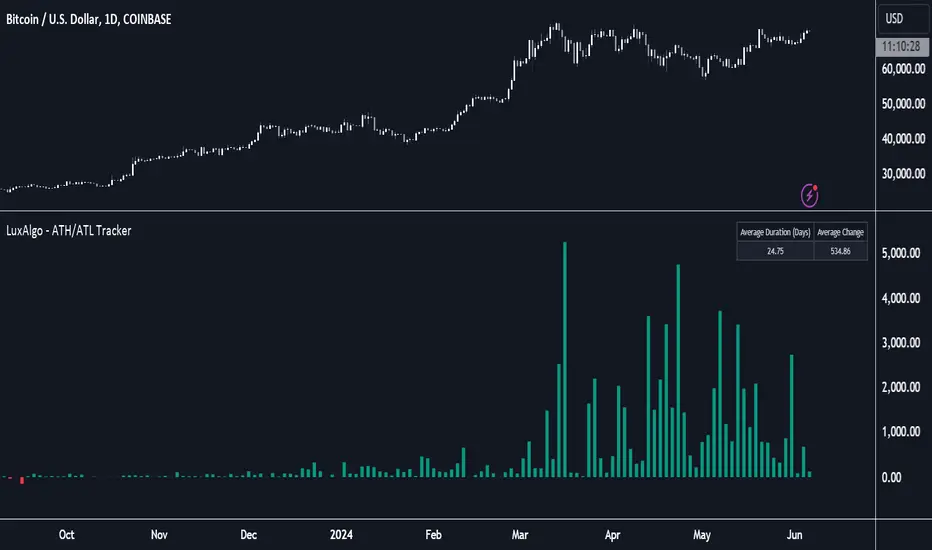
ATH/ATL Tracker [LuxAlgo]The ATH/ATL Tracker effectively displays changes made between new All-Time Highs (ATH)/All-Time Lows (ATL) and their previous respective values, over the entire history of available data.
The indicator shows a histogram of the change between a new ATH/ATL and its respective preceding ATH/ATL. A tooltip showing the price made during a new ATH/ATL alongside its date is included.
🔶 USAGE
By tracking the change between new ATHs/ATLs and older ATHs/ATLs, traders can gain insight into market sentiment, breadth, and rotation.
If many stocks are consistently setting new ATHs and the number of new ATHs is increasing relative to old ATHs, it could indicate broad market participation in a rally. If only a few stocks are reaching new ATHs or the number is declining, it might signal that the market's upward momentum is decreasing.
A significant increase in new ATHs suggests optimism and willingness among investors to buy at higher prices, which could be considered a positive sentiment. On the other hand, a decrease or lack of new ATHs might indicate caution or pessimism.
By observing the sectors where stocks are consistently setting new ATHs, users can identify which sectors are leading the market. Sectors with few or no new ATHs may be losing momentum and could be identified as lagging behind the overall market sentiment.
🔶 DETAILS
The indicator's main display is a histogram-style readout that displays the change in price from older ATH/ATLs to Newer/Current ATH/ATLs. This change is determined by the distance that the current values have overtaken the previous values, resulting in the displayed data.
The largest changes in ATH/ATLs from the ticker's history will appear as the largest bars in the display.
The most recent bars (depending on the selected display setting) will always represent the current ATH or ATL values.
When determining ATH & ATL values, it is important to filter out insignificant highs and lows that may happen constantly when exploring higher and lower prices. To combat this, the indicator looks to a higher timeframe than your chart's timeframe in order to determine these more significant ATHs & ATLs.
For Example: If a user was on a 1-minute chart and 5 highs-new highs occur across 5 adjacent bars, this has the potential to show up as 5 new ATHs. When looking at a higher timeframe, 5 minutes, only the highest of the 5 bars will indicate a new ATH. To assist with this, the indicator will display warnings in the dashboard when a suboptimal timeframe is selected as input.
🔹 Dashboard
The dashboard displays averages from the ATH/ATL data to aid in the anticipation and expectations for new ATH/ATLs.
The average duration is an average of the time between each new ATH/ATL, in this indicator it is calculated in "Days" to provide a more comprehensive understanding.
The average change is the average of all change data displayed in the histogram.
🔶 SETTINGS
Duration: The designated higher timeframe to use for filtering out insignificant ATHs & ATLs.
Order: The display order for the ATH/ATL Bars, Options are to display in chronological (oldest to newest) or reverse chronological order (newest to oldest).
Bar Width: Sets the width for each ATH/ATL bar.
Bar Spacing: Sets the # of empty bars in between each ATH/ATL bar.
Dashboard Settings: Parameters for the dashboard's size and location on the chart.
Cosine Kernel Regressions [QuantraSystems]Cosine Kernel Regressions
Introduction
The Cosine Kernel Regressions indicator (CKR) uses mathematical concepts to offer a unique approach to market analysis. This indicator employs Kernel Regressions using bespoke tunable Cosine functions in order to smoothly interpret a variety of market data, providing traders with incredibly clean insights into market trends.
The CKR is particularly useful for traders looking to understand underlying trends without the 'noise' typical in raw price movements. It can serve as a standalone trend analysis tool or be combined with other indicators for more robust trading strategies.
Legend
Fast Trend Signal Line - This is the foreground oscillator, it is colored upon the earliest confirmation of a change in trend direction.
Slow Trend Signal Line - This oscillator is calculated in a similar manner. However, it utilizes a lower frequency within the cosine tuning function, allowing it to capture longer and broader trends in one signal. This allows for tactical trading; the user can trade smaller moves without losing sight of the broader trend.
Case Study
In this case study, the CKR was used alongside the Triple Confirmation Kernel Regression Oscillator (KRO)
Initially, the KRO indicated an oversold condition, which could be interpreted as a signal to enter a long position in anticipation of a price rebound. However, the CKR’s fast trend signal line had not yet confirmed a positive trend direction - suggesting that entering a trade too early and without confirmation could be a mistake.
Waiting for a confirmed positive trend from the CKR proved beneficial for this trade. A few candles after the oversold signal, the CKR's fast trend signal line shifted upwards, indicating a strong upward momentum. This was the optimal entry point suggested by the CKR, occurring after the confirmation of the trend change, which significantly reduced the likelihood of entering during a false recovery or continuation of the downtrend.
This is one of the many uses of the CKR - by timing entries using the fast signal line , traders could avoid unnecessary losses by preventing premature entries.
Methodology
The methodology behind CKR is a multi-layered approach and utilizes many ‘base’ indicators.
Relative Strength Index
Stochastic Oscillator
Bollinger Band Percent
Chande Momentum Oscillator
Commodity Channel Index
Fisher Transform
Volume Zone Oscillator
The calculated output from each indicator is standardized and scaled before being averaged. This prevents any single indicator from overpowering the resulting signal.
// ╔════════════════════════════════╗ //
// ║ Scaling/Range Adjustment ║ //
// ╚════════════════════════════════╝ //
RSI_ReScale (_res ) => ( _res - 50 ) * 2.8
STOCH_ReScale (_stoch ) => ( _stoch - 50 ) * 2
BBPCT_ReScale (_bbpct ) => ( _bbpct - 0.5 ) * 120
CMO_ReScale (_chandeMO ) => ( _chandeMO * 1.15 )
CCI_ReScale (_cci ) => ( _cci / 2 )
FISH_ReScale (_fish1 ) => ( _fish1 * 30 )
VZO_ReScale (_VP, _TV ) => (_VP / _TV) * 110
These outputs are then fed into a customized cosine kernel regression function, which smooths the data, and combines all inputs into a single coherent output.
// ╔════════════════════════════════╗ //
// ║ COSINE KERNEL REGRESSIONS ║ //
// ╚════════════════════════════════╝ //
// Define a function to compute the cosine of an input scaled by a frequency tuner
cosine(x, z) =>
// Where x = source input
// y = function output
// z = frequency tuner
var y = 0.
y := math.cos(z * x)
Y
// Define a kernel that utilizes the cosine function
kernel(x, z) =>
var y = 0.
y := cosine(x, z)
math.abs(x) <= math.pi/(2 * z) ? math.abs(y) : 0. // cos(zx) = 0
// The above restricts the wave to positive values // when x = π / 2z
The tuning of the regression is adjustable, allowing users to fine-tune the sensitivity and responsiveness of the indicator to match specific trading strategies or market conditions. This robust methodology ensures that CKR provides a reliable and adaptable tool for market analysis.

Relative Momentum Index with Laguerre FilterThe Relative Momentum Index
The Relative Momentum Index (RMI) is an oscillator that is a variation of the Relative Strength Index (RSI), but incorporates momentum over a variable lookback period rather than just consecutive price changes, which can help identify reversals and filter out noise.
It measures the momentum of price changes over a specified period, rather than just the magnitude of price changes like the RSI does.
It counts up and down days from the current closing price relative to the closing price a certain number of days ago (e.g. 5 days ago), instead of just comparing consecutive daily closes like the RSI
It is calculated by taking the ratio of the average upward price changes to the average downward price changes over a given period, where each change is measured from the close X days ago (X is the “momentum” period)
Like the RSI, the RMI oscillates between 0 and 100, with readings above 70 considered overbought and below 30 oversold.
In trending markets, the RMI tends to remain in overbought or oversold territory for extended periods. In trading ranges, it oscillates more predictably between the overbought and oversold levels.
The RMI is generally considered better than the RSI at identifying potential reversal points, as it incorporates a momentum factor rather than just strength.
It can be used in a similar way to the RSI for trade signals, such as buying when it rises above 30 from below, or selling when it falls below 70 from above
The Laguerre filter
A Laguerre filter is a type of infinite impulse response (IIR) filter used for smoothing signals or data. The Laguerre filter provides a way to apply variable smoothing to a signal by adjusting its pole position, allowing you to control the balance between smoothness and lag based on your preferences. It is an alternative to simple moving averages that can better preserve the shape of the original signal.
IV Rank Oscillator by dinvestorqShort Title: IVR OscSlg
Description:
The IV Rank Oscillator is a custom indicator designed to measure and visualize the Implied Volatility (IV) Rank using Historical Volatility (HV) as a proxy. This indicator helps traders determine whether the current volatility level is relatively high or low compared to its historical levels over a specified period.
Key Features :
Historical Volatility (HV) Calculation: Computes the historical volatility based on the standard deviation of logarithmic returns over a user-defined period.
IV Rank Calculation: Normalizes the current HV within the range of the highest and lowest HV values over the past 252 periods (approximately one year) to generate the IV Rank.
IV Rank Visualization: Plots the IV Rank, along with reference lines at 50 (midline), 80 (overbought), and 20 (oversold), making it easy to interpret the relative volatility levels.
Historical Volatility Plot: Optionally plots the Historical Volatility for additional reference.
Usage:
IV Rank : Use the IV Rank to assess the relative level of volatility. High IV Rank values (close to 100) indicate that the current volatility is high relative to its historical range, while low IV Rank values (close to 0) indicate low relative volatility.
Reference Lines: The overbought (80) and oversold (20) lines help identify extreme volatility conditions, aiding in trading decisions.
Example Use Case:
A trader can use the IV Rank Oscillator to identify potential entry and exit points based on the volatility conditions. For instance, a high IV Rank may suggest a period of high market uncertainty, which could be a signal for options traders to consider strategies like selling premium. Conversely, a low IV Rank might indicate a more stable market condition.
Parameters:
HV Calculation Length: Adjustable period length for the historical volatility calculation (default: 20 periods).
This indicator is a powerful tool for options traders, volatility analysts, and any market participant looking to gauge market conditions based on historical volatility patterns.

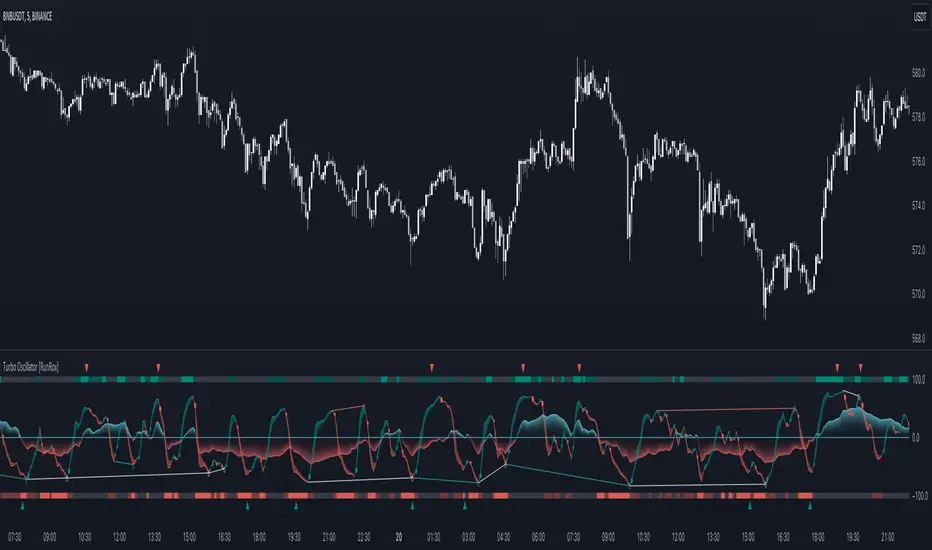
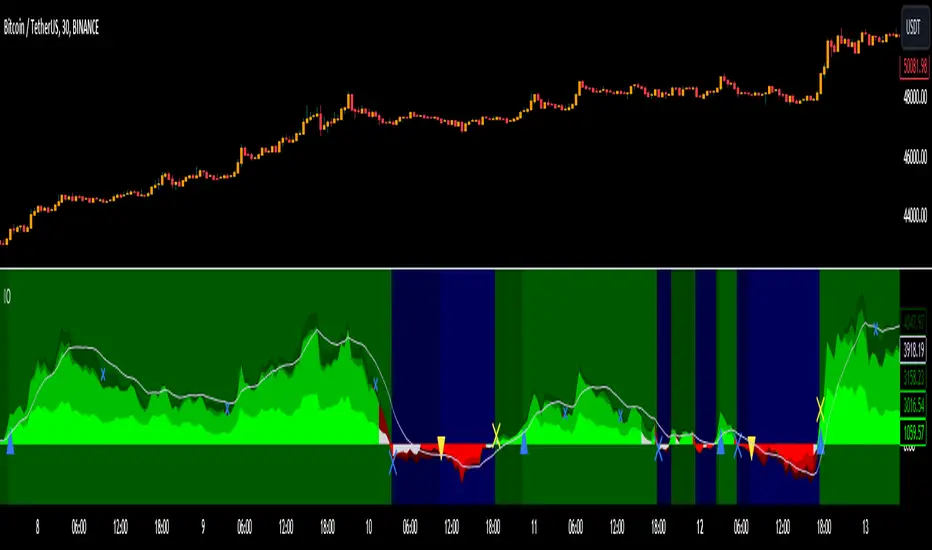
Turbo Oscillator [RunRox]Introducing Turbo Oscillator by RunRox, our new indicator that combines a multitude of useful and unique features, which we will detail in this post.
List of Advanced Technologies:
Real-Time Divergences: Detects discrepancies between price movements and oscillator indicators to forecast potential price reversals.
Real-Time Hidden Divergences: We identify hidden divergences in real-time. These are not the standard type of divergences; they are opposite to regular divergences, providing unique insights into potential market movements.
Overbought and Oversold Zones: Identifies areas where the market is potentially overextended, suggesting possible entry and exit points.
Signal Line: Indicates the market direction, helping traders to quickly understand current trends.
Money Flow Histogram: Shows the flow of money into and out of the market, providing insights into buying and selling pressure.
Predicted Reversal Zones: Pinpoints areas where the market might experience reversals, aiding in strategic planning and risk management. These zones also serve as potential areas for taking profits, enhancing their utility for exit strategy planning.
Customizable Alerts: You can flexibly set up alerts for any events detected by our indicator, ensuring you stay informed about critical market movements.
To begin with, I would like to describe the difference between classic divergences and hidden divergences.
As you can see, these are opposite situations. Our oscillator identifies both types of divergences and displays them in real-time.
Divergences can serve as points where the price might reverse in the opposite direction, making both classic and hidden divergences powerful tools for spotting reversal points. I'll show a few examples of how divergences are used in our oscillator.
Classic Divergences - which we identify in real-time. As you can see, the price often reacts strongly to the formation of these divergences, frequently changing its direction.
Hidden Divergences - we also observe frequent movement in the opposite direction on the chart. The advantage of our indicator is that we show divergences in real-time without delays, allowing you to react immediately to trend changes.
Overbought and Oversold Zones - These zones allow you to see trend changes when the price is clearly overbought or oversold. When the color changes from a contrasting shade to a neutral one, you can observe the trend shift. The lines work by combining the positivity/negativity of the histogram, the positivity/negativity of the signal line, and the direction of the signal line (red/green). This sophisticated interaction provides precise insights into market conditions, making it an invaluable tool for traders.
Signal Line - This provides insights into trend changes and price reversals. The points on the line better indicate the beginning of a trend shift. These points can vary in size, offering a clearer understanding of the strength of the emerging trend. This feature works in combination with RSI, Stochastic, and MFI. RSI and MFI are top-tier indicators, while Stochastic adds responsiveness and sensitivity to trend changes, ensuring you capture every market movement accurately and promptly.
Money Flow Histogram - As shown in the example, our histogram displays the divergence between money flow and the actual price. You can see that while the price is rising, the money flow is decreasing, indicating insufficient demand for the asset and an imminent trend change. This feature uses MFI with an extended period, providing a more comprehensive and accurate analysis of market conditions. The extended period enhances the reliability of the Money Flow Index, making it an essential tool for identifying subtle shifts in market dynamics.
Predicted Reversal Zones - We automatically identify potential price reversal zones and display them above our overbought and oversold zones. In cases of strong overbought or oversold conditions, we detect potential price pullbacks and mark the beginning of a trend change. This helps you better identify trend shifts. We recommend considering these zones as potential take profit points for your trades.
Customizable Alerts - Our flexible alert system allows you to receive notifications only for the events you are interested in. These can include:
1. Classic Divergences
2. Hidden Divergences
3. Overbought or Oversold conditions on the status line
4. Strong Overbought or Oversold conditions on the status line
5. Signals from the signal line
6. Reversal zones in any direction
Our oscillator is a unique indicator that provides a comprehensive understanding of price movements. It can be used as a standalone tool for analyzing price action.
Here are a few examples of using our Oscillator in practice:
In the example above, you can see three conditions that have formed for a potential trade:
1. Clear overbought condition with a formed reversal point.
2. Decreasing Money Flow Index diverging from the rising price.
3. Formed classic divergence.
The entry point could be the formed divergence, while the exit point could be the overbought condition at the bottom of the oscillator along with the reversal points.
Here's another example of using hidden divergence, where you can see three conditions for a potential trade:
1. Overbought zone
2. Formed hidden divergence
3. Start of bearish movement indicated by the signal line
You can enter the trade either when the hidden divergence forms or wait for confirmation of the trend change by the signal line and enter the trade when the corresponding signal forms on the signal line. The exit point could be the opposite reversal point or the formation of a new hidden divergence.
We have demonstrated a few examples of how you can use our indicator, but we are confident that you will find many more applications in your own strategies.
Oscillator offers a variety of customizable parameters to tailor the indicator to your trading preferences. Here’s what our settings include:
Signal Line
Turn On/Off: Enable or disable the signal line.
Length: Set the length period for the signal line calculation.
Smooth: Adjust the smoothing level of the signal line for more accurate display.
Histogram
Turn On/Off: Enable or disable the histogram.
Length: Set the length period for the histogram calculation.
Smooth: Adjust the smoothing level of the histogram.
Other
Show Divergence Line: Display divergence lines on the chart.
Show Hidden Divergence: Display hidden divergences.
Show Status Line: Show the status line indicating overbought or oversold conditions.
Show TP Signal: Display signals for take profit.
Show Reversal Points: Display potential trend reversal points.
Delete Broken Divergence Lines: Remove broken divergence lines from the chart.
Alerts Customization
Signal Line Bull/Bear: Set alerts for bullish or bearish signals from the signal line.
TP Bull/Bear: Set alerts for take profit signals.
Status Bull/Bear: Set alerts for bullish or bearish status conditions.
Status Bull+/Bear+: Set enhanced alerts for stronger bullish or bearish status conditions.
Divergence Bull/Bear: Set alerts for bullish or bearish divergences.
Hidden Divergence Bull/Bear: Set alerts for hidden bullish or bearish divergences.
With these comprehensive settings, you can fine-tune the Oscillator to perfectly fit your trading strategy and preferences.
Our indicator utilizes technologies such as RSI, Stochastic, and Money Flow Index, with numerous enhancements from our team. It includes exclusive features such as real-time detection of hidden and classic divergences, identification of reversal points using our unique methodology, and much more.
Disclaimer:
While we consider our Turbo Oscillator to be an excellent tool, it is important to understand that past performance is not indicative of future results. We recommend approaching market analysis comprehensively, using a combination of tools and techniques to make well-informed trading decisions. Always consider the full range of market data and risks when using any trading indicator.
Relative Strength Universal
Relative strength is a ratio between two assets, generally it is a stock and a market average (index). RS implementation details are explained here .
This script automatically decides benchmark index for RS calculation based on market cap input values and input benchmark indices values.
Relative strength calculation:
"To calculate the relative strength of a particular stock, divide the percentage change over some time period by the percentage change of a particular index over the same time period". This indicator value oscillates around zero. If the value is greater than zero, the investment has been relatively strong during the selected period; if the value is less than zero, the investment has been relatively weak.
In this script, You can input market cap values and all are editable fields. If company market cap value is grater than 75000(Default value) then stock value will be compared with Nifty index. If company market cap is between 75000 and 25000 then stock value will be compared with midcap 150 to calculate RS. If marketcap is greater than 5000 and less than 25000 then RS will be calculated based on smallcap250. If marketcap is less than 5000 and greater than 500 then it will be compared with NIFTY_MICROCAP250
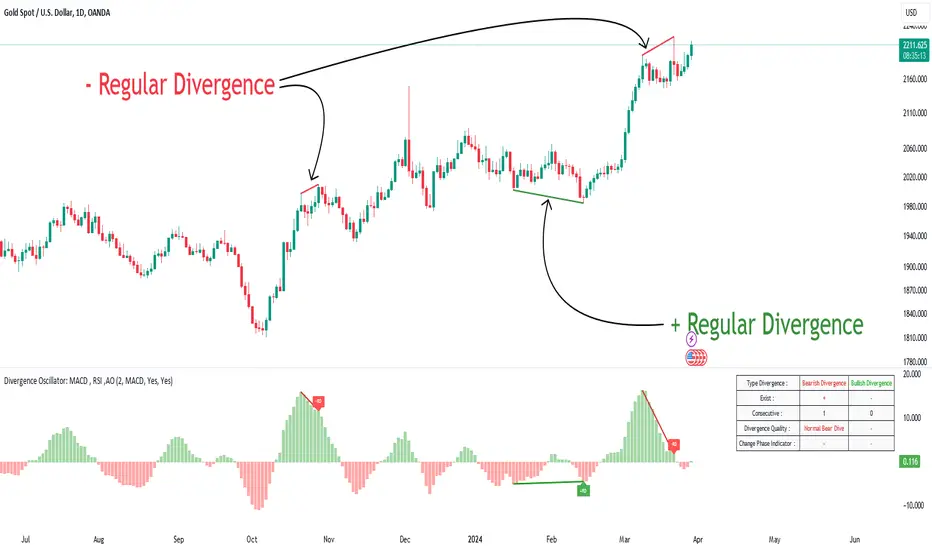
Divergence Detector [TradingFinder] RSI + MACD + AO Oscillator 🔵 Introduction
🟣 Understanding Divergence
As mentioned, divergence occurs in technical analysis when a stock's price behaves contrary to indicators on the price chart. Divergence can signify either a reversal of the stock's trend or a continuation of the previous trend correction.
Divergences can act as reversal patterns or continuation patterns. Moreover, divergences can be utilized to identify potential support and resistance levels.
For instance, when an indicator is trending upwards and positive, but the price is declining and trending downwards, divergence occurs. Divergence in a stock indicates trader indecision in buying and selling and warns traders to reconsider their decisions regarding buying or holding the stock.
Divergence aids analysts in identifying critical price points. In indicator divergences, it serves as a potent signal in the realm of technical analysis.
🟣 Types of Divergence
1.Regular Divergence
o Positive Regular Divergence (RD+)
o Negative Regular Divergence (RD-)
2.Hidden Divergence
o Positive Hidden Divergence (HD+)
o Negative Hidden Divergence (HD-)
3.Time Divergence
Key Note : This indicator is specifically designed to identify "Regular Divergence" only. Therefore, the following explanation pertains to this type of divergence.
🔵 Regular Divergence/Convergence
Regular Divergence(Convergence) occurs due to conflicting behavior between the indicator and the price chart, typically at the end of a trend. Recognizing Regular Divergence suggests an anticipation of a trend reversal or a pattern resembling a reversal.
🟣 Positive Regular Divergence (RD+)
In contrast to negative divergence, positive Regular Divergence occurs at the end of a downtrend and between two price lows. It manifests when the price forms a new low on the price chart, but the indicator fails to recognize it.
Positive Regular Divergence indicates strong buying pressure and weak selling pressure. Following the identification of positive divergence on the chart, one can anticipate a price increase for the examined stock.
🟣 Negative Regular Divergence (RD-)
This type of Regular Divergence emerges between two price highs during an uptrend. A new high is formed on the price chart, but the indicator fails to acknowledge it. This scenario indicates negative Regular Divergence.
The likelihood of a subsequent market downturn is high. Negative divergence signifies strong selling pressure and weak buying pressure, suggesting an unfavorable future for the stock.
🔵 How to use
By utilizing the "Fractal Period" input, you can specify your desired periods for identifying divergences.
Additionally, through the "Divergence Detect Method" feature, you can choose which oscillators (MACD, RSI, or AO) to base divergence identification on.
Divergence in MACD Oscillator :
Divergence in the MACD indicator occurs when the price chart and the MACD line form a noticeable opposing pattern, meaning the price moves contrary to the MACD line. In this scenario, one expects a reversal in price direction.
Divergence in RSI Oscillator :
If divergence occurs during a downtrend on the price chart (two consecutive lows, with the second low being lower) and on the corresponding RSI point (two consecutive lows, with the second low being higher), it signifies positive Regular Divergence and implies a buying signal.
Conversely, if divergence occurs during an uptrend on the price chart (two consecutive highs, with the second high being higher) and on the corresponding RSI point (two consecutive highs, with the second high being lower), it indicates negative Regular Divergence, signaling a selling opportunity.
Divergence in AO Oscillator :
The AO indicator calculates histograms similar to the AO base. It calculates the difference between the simple moving averages of 5 and 34 periods based on the median of each bar. Then, it plots the bars based on the difference.
It then compares the histograms to detect peaks and troughs in the AO histograms and compares the identified peaks and troughs to the price. Whenever divergence is detected, it plots lines and arrows.
🔵 Table
The table contains information on the functional features of this oscillator that you can utilize. Four categories of information are presented in the table: "Exist," "Consecutive," "Divergence Quality," and "Change Phase Indicator."
Exist :
If divergence exists, you'll see "+" in this row.
Consecutive :
Divergences may occur consecutively. If same-type divergences form within short intervals, you can observe the count in this row.
Divergence Quality : Based on the number of consecutive divergences, their quality can be evaluated. If one divergence exists, its quality is considered "Normal." If two divergences exist, the quality is "Good," and if three or more divergences exist, the quality is considered "Strong."
Change Phase Indicator : If a phase change occurs between two oscillation peaks formed based on divergence, this change is identified and displayed in this row.
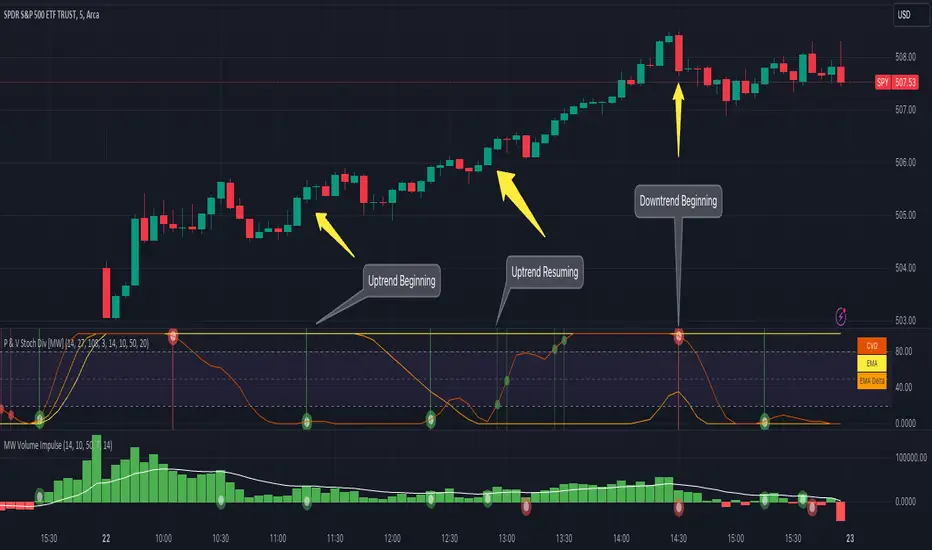
Price and Volume Stochastic Divergence [MW]Introduction
This indicator creates signals of interest for entering and exiting long and short positions on equities. It primarily uses up and down trends defined by the change in cumulative volume with some filtering provided by a short period exponential moving average (9 EMA by default).
Settings
Moving Average Period : The moving average over which the cumulative volume delta is calculated. Default: 14
Short Period EMA : The EMA used to represent price action, and is used to generate the EMA Delta line. Default: 27 (3*3*3)
Long Period EMA : The second EMA used to calculate the EMA Delta line. Default: 108 (2*2*3*3*3)
Stochastic K Value : The value used for stochastic curve smoothing. Default: 3
Dot Size : The diameter of the larger indicator. Default: 10
Dot Transparency : The transparency level of the outer ring of the primary BUY/SELL signal. Default: 50 (0 is opaque, 100 is transparent)
Band Distance from 0 to 100 : The upper and lower band distance. Default: 20
Calculations
The cumulative volume delta (CVD) is calculated using candle bodies and wicks. For a red candle, buying volume is calculated by multiplying the volume by the spread percentage of the average of the top and bottom wicks, while Selling Volume is calculated multiplying the volume by the spread percentage of the average of the top and bottom wicks - in addition to the spread percentage of the candle body.
For a green candle, buying volume is calculated by multiplying the volume by the spread percentage of the average of the top and bottom wicks - plus the spread percentage of the candle body - while Selling Volume is calculated using only the spread percentage average of the top and bottom wicks.
Once we have the CVD, we can then perform a stochastic calculation of the CVD value.
stochastic calculation = (current value - lowest value in period) / (highest value in period - lowest value in period)
We’ll do the same stochastic calculation for the short term EMA (27 EMA default) as well as for the difference between the short term and long term EMA.
When the stochastic CVD value is rising from zero and the short term EMA stochastic value equals 100, then it’s a major bullish signal. When the stochastic CVD value is falling from 100 and the short term EMA stochastic value equals 0, then it’s a major bearish signal.
Sometimes, after a bullish or bearish signal, the stochastic CVD will reverse direction triggering a new opposing signal.
How to Interpret
The CVD indicates when there is either more buying than selling or vice versa. A value over 50 for the stochastic CVD curve represents more buying taking place. A value below 50 represents more selling. One might intuitively believe that when there is more buying volume than selling volume that the price would follow suit. This is not always the case.
Most of the time buying volume will precede consistent price movement upwards, and selling volume will precede consistent price movement downwards. When this divergence occurs, the indicator generates a signal. When this divergence begins to fail, and buying or selling volume reverses, then another signal is generated indicating that the buying/selling impulse is headed back into the direction of price action.
These interactions are visually represented on the chart with the coral line that represents CVD, and the yellow line that represents the EMA, or the average price. When the coral line goes up and the yellow line stays down, that’s the BUY signal. When the coral line goes down and the yellow line stays up, that’s the sell signal. When the coral line switches direction, the chart generates another signal showing that volume is moving in a direction that supports the price.
The orange line represents the stochastic representation of the difference between the short EMA (27 by default) and the long EMA (108 by default). EMA differences is a method that can be used to define a trend. When a short term EMA is above a longer term EMA, that may represent a bullish trend. When it is below, that may represent a bearish trend. When all 3 lines are rising or falling in the same direction at the same time, it tends to indicate a movement that has the potential to continue.
Other Usage Notes and Limitations
It's important for traders to be aware of the limitations of any indicator and to use them as part of a broader, well-rounded trading strategy that includes risk management, fundamental analysis, and other tools that can help with reducing false signals, determining trend direction, and providing additional confirmation for a trade decision. Diversifying strategies and not relying solely on one type of indicator or analysis can help mitigate some of these risks.
This indicator can be paired with the MW Volume Impulse indicator if it is desired to see the actual buying and selling cumulative volume deltas. Also, in many cases, the BUY and SELL signals tend to correspond with Keltner Bands (ATR Bands) becoming extended. Lastly, volume weighted average price (VWAP) along with other macro events can impact price and negate signals. To view VWAP lines, you may choose to use the Multi VWAP or Multi VWAP for Gaps indicator to help ensure that the signals you see in this indicator are not being affected by VWAP lines.
FibonacciAveragesOscillatorLibraryLibrary "FibonacciAveragesOscillatorLibrary"
The FibonacciAveragesOscillator library provides a streamlined way to analyze market trends using Fibonacci intervals and smoothed averages.
fibAvgOscillator(maxFibNumber, smoothLevel)
Parameters:
maxFibNumber (string) : string: The maximum Fibonacci number to use, affecting analysis depth.
smoothLevel (simple int) : simple int: Smoothing level for the oscillator, higher values produce smoother results.
@return series float: The Fibonacci averages trend oscillator value, smoothed over the specified level.
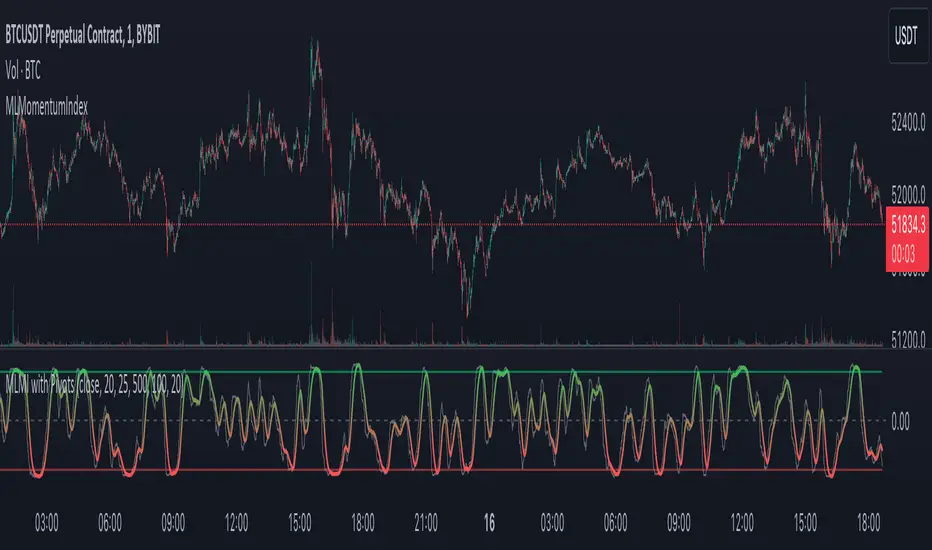
ML - Momentum Index (Pivots)Building upon the innovative foundations laid by Zeiierman's Machine Learning Momentum Index (MLMI), this variation introduces a series of refinements and new features aimed at bolstering the model's predictive accuracy and responsiveness. Licensed under the Creative Commons Attribution-NonCommercial-ShareAlike 4.0 International License (CC BY-NC-SA 4.0), my adaptation seeks to enhance the original by offering a more nuanced approach to momentum-based trading.
Key Features :
Pivot-Based Analysis: Shifting focus from trend crosses to pivot points, this version employs pivot bars to offer a distinct perspective on market momentum, aiding in the identification of critical reversal points.
Extended Parameter Set: By integrating additional parameters for making predictions, the model gains improved adaptability, allowing for finer tuning to match market conditions.
Dataset Size Limitation: To ensure efficiency and mitigate the risk of calculation timeouts, a cap on the dataset size has been implemented, balancing between comprehensive historical analysis and computational agility.
Enhanced Price Source Flexibility: Users can select between closing prices or (suggested) OHLC4 as the basis for calculations, tailoring the indicator to different analysis preferences and strategies.
This adaptation not only inherits the robust framework of the original MLMI but also introduces innovations to enhance its utility in diverse trading scenarios. Whether you're looking to refine your short-term trading tactics or seeking stable indicators for long-term strategies, the ML - Momentum Index (Pivots) offers a versatile tool to navigate the complexities of the market.
For a deeper understanding of the modifications and to leverage the full potential of this indicator, users are encouraged to explore the tooltips and documentation provided within the script.
The Momentum Indicator calculations have been transitioned to the MLMomentumIndex library, simplifying the process of integration. Users can now seamlessly incorporate the momentumIndexPivots function into their scripts to conduct detailed momentum analysis with ease.
Ichimoku OscillatorHello All,
This is Ichimoku Oscillator that creates different oscillator layers, calculates the trend and possible entry/exit levels by using Ichimoku Cloud features.
There are four layer:
First layer is the distance between closing price and cloud (min or max, depending on the main trend)
Second layer is the distance between Lagging and Cloud X bars ago (X: the displacement)
Third layer is the distance between Conversion and Base lines
Fourth layer is the distance between both Leadlines
If all layers are visible maning that positive according to the main trend, you can take long/short position and when main trend changed then you should close the position. so it doesn't mean you can take position when main trend changed, you need to wait for all other conditions met (all layers(
there is take profit partially option. if Conversion and base lines cross then you can take profit partially. Optionally you can take profit partially when EMA line crosses Fourth layer.
Optionally ATR (average true range) is used for Conversion and baseline for protection from whipsaws. you can use it to stay on the trend longer time.
I added options to enable/disable the alert and customize alert messages. You can change alert messages as you wish. if you use ' close ' in the alert message then you can get closing price in the alert message when the alert was triggered.
There is an option Bounce Off Support/Resistance , if there is trend and if the price bounce off Support/Resistance zone then a tiny triangle is shown.
There are many other options for coloring, alerts etc.
Some screenshots:
Main trend:
Taking/closing positions:
Example alert messages:
Bounce off:
Colors:
Colors:
Colors:
Non-colored background:
P.S. For a few months I haven't published any new script because of some health issues. hope to be healthy and create new scripts in 2024 :)
Enjoy!
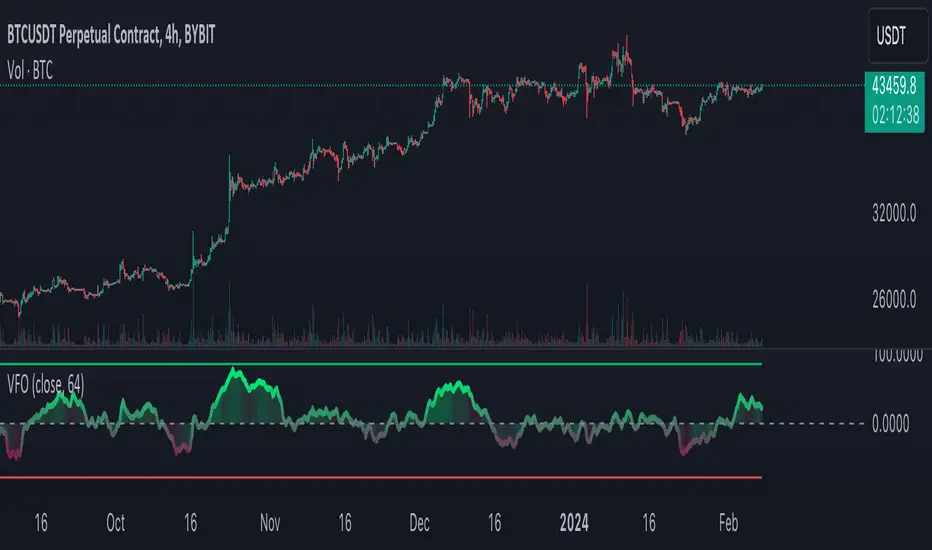
Volume Flow Oscillator (VFO)I created the Volume Flow Oscillator (VFO) to explore the intricate interplay between volume and price movements over a specific lookback period. This tool contrasts volumes that move in sync with the price against those that move in opposition, signaling potential overbought or oversold territories. To determine the direction, I compare the current price to its value four periods back, shedding light on underlying bullish or bearish momentum. The VFO enriches my analysis and decision-making by offering a detailed perspective on how volume trends correlate with price changes. Its color-coded visuals are crucial for highlighting optimal trading points based on volume dynamics.
Intraday volume pressureThis indicator shows the difference of bullish and bearish trading volume during intraday
The idea
Especially in "6E1!" it caught my eye, that often outside regular trading hours the price moves in one direction with thin volume and inside regular trading hours it moves back with much higher volume. It is possible, that the market closes e.g. with a plus. And over some days maybe you can see e.g. weak rising prices. But in this time the movements with high volume are going down every day. And one day - maybe within view minutes - the market rushs a level deeper.
Maybe some are manipulating the market in this way, maybe not, it doesn't matter. So my question was, can I find a way to show such divergences? I guess I can do.
How to use this indicator
Use it at your own risk! I don't take over any responsibility. You are the only one, who is responsible for your decisions. Always collect information from different independent sources!
Watch it in the daily chart - not intraday, not weekly! Of course this indicator just analyzes the past as all indicators. Everytime everything may happen that influences the market in any direction, no indicator can predict any news.
Watch it in sideways market or when the price is moving quite slow over days! An average volume pressure
below zero shows a volume-driven bearish pressure
above zero shows a volume-driven bullish pressure
of the last days. So there is a chance, that the market may follow the volume pressure within the next days. But of course, I cannot guarantee anything. The indicator just can give you an idea, why this will happen, when it will happens. Otherwise, the indicator indicated nothing helpfull.
Of course you also can try other securities. Maybe it will work there better or worse - difficult to say. I guess, it depends on the market.
Possible settings aside of colors
Intraday minute bars: Default is 15 minutes, in 6E in my point of view it is a good value. If you choose a smaller value, the chart gets too noisy, the results are getting too small. With a bigger timeframe some moves are hidden in bigger candles, the results are getting a large spread
Average over days: Default is 5 days - so one week. In 6E in my point of view it is a good value. A smaller value is too noisy. A bigger value reacts too slow. Often 6E has a trend over weeks. Sometimes it changes within some days - the indicator may help. But sometimes the market changes with a buying or selling climax. Such a case this indicator cannot recognize. But with the 5 days average maybe you get a change in the indicator within one or two days. Anyway, it is always a good idea to learn recognizing climaxes otherwise.
How the indicator works
It uses the function request.security_lower_tf to get the intraday candles. The volume of intraday up-candles is added to the intraday summary volume. The volume of down candles is substracted from the intraday summary volume.
In the oscillator area I plot a green bar on a day with a higher close than open and a red bar on a day with a lower close than open. The bar has a positive value, if the volume pressure is positive and a negative value if the volume pressure is negative. So it happens, that a green bar has a negative value or a red bar has a positive value.
The average is calculated with a floating sum. Once we have enough days calculated, I devide the floating sum by the length of the "Average over days" and plot the result. Then I substract the first value of the queue and I remove it.

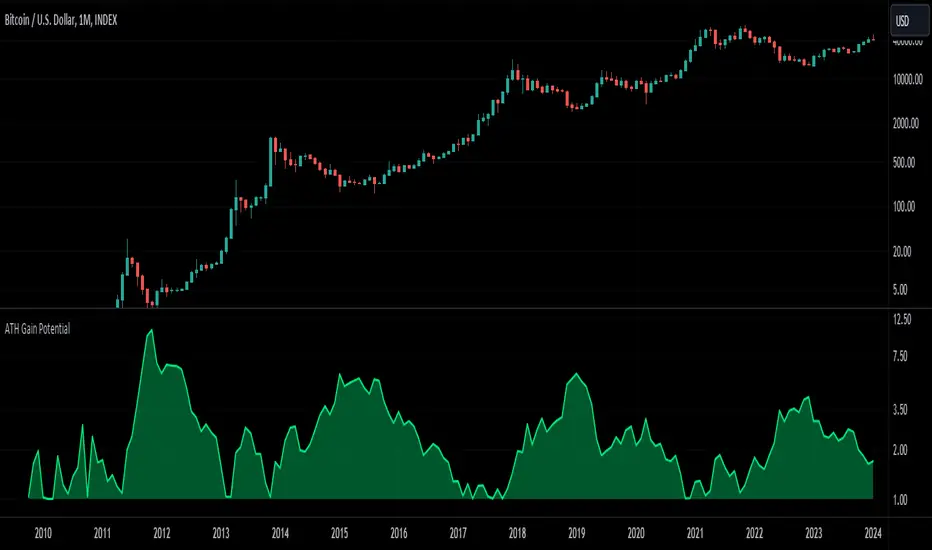
ATH Gain PotentialThe indicator quantifies the relative position of a symbol's current closing price in relation to its historical all-time high (ATH).
By evaluating the ratio between the ATH and the present closing price, it provides an analytical framework to estimate the potential gains that could accrue if the symbol were to revert to its ATH from a specified reference point. The ratio serves as a quantitative measure for assessing the distance between the current market value and the symbol's historical peak, enabling investors to gauge the prospective profitability of a return to the ATH.
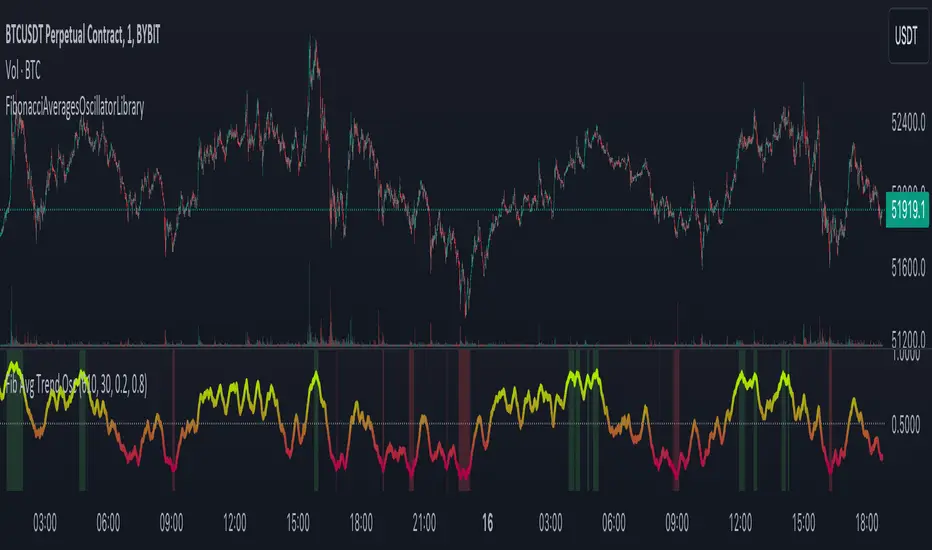
Fibonacci Averages Trend OscillatorOverview:
The Fibonacci Averages Trend Oscillator is a unique technical indicator that leverages Fibonacci numbers to analyze market trends. It calculates the average trend sentiment over periods determined by Fibonacci numbers and smooths the result to create an oscillator.
Key Features:
Uses Fibonacci sequences for trend analysis.
Smooths the trend data to create a clear oscillator.
Offers adjustable oversold and overbought levels for customized analysis.
Inputs:
Max Fib Number: Select the highest Fibonacci number for trend calculation.
Smooth: Adjust the smoothness of the oscillator line.
Using the Oscillator:
A rising oscillator indicates a bullish trend, while a falling oscillator suggests bearish sentiment.
Oversold and overbought levels help identify potential reversal points.
Use the oscillator in conjunction with other indicators for comprehensive market analysis.
Tips for Effective Use:
Adjusting Fibonacci Levels: Experiment with different 'Max Fib Number' settings to find the one that best matches your trading style and the asset's characteristics. Higher Fibonacci numbers consider longer periods, which might be more suitable for long-term trend analysis.
Smoothing Level: The 'Smooth' input helps in reducing noise. A higher smooth level results in a less responsive but smoother line, which can be useful for identifying the overall trend direction.
Interpreting Overbought/Oversold: Watch for the oscillator reaching overbought or oversold levels. These points could signal potential trend reversals or consolidation phases.
Combination with Other Tools: For best results, combine the Fibonacci Averages Trend Oscillator with other technical tools like moving averages, RSI, or MACD to validate the signals and develop a robust trading strategy.
Conclusion:
The Fibonacci Averages Trend Oscillator offers a unique approach to trend analysis by incorporating Fibonacci numbers into its calculation. Its adjustable settings allow for customization to fit various trading styles and market conditions, making it a versatile tool for traders seeking to enhance their technical analysis capabilities.

Fusion: Aroon trend matching with dual thresholds 2Same as previous one, just making the code publicly available.
You set an upper and lower threshold and when both are met a direction is determined.
I use this primarily as a confirmation indicator of a trend.
The addition to the normal Aroon is simply the threshold settings and the visuals. There is even an option to see the length you are using which I find useful when the length is long, say 40+ so you don't forget that it's considerably longer than how it's normally used.
Additionally it defaults to the normal colors we are familar with for up and down (long/short) but you can choose Aroon colors if you wish with just a checkbox.
The length is certainly not optimized so set to whatever suits your needs. The Aroon default is 14, I used 6 for one particular case so that's what it ended up being for this indicator.
I default to a dark theme so if you are using a light theme you may need to change some brightness settings.
Finally, if you find value please do make a comment, give a thumbs up etc.
Enjoy and good luck!

Easy To Trade indicatorAbstract
This script evaluates how easy for traders to trade.
This script computes the level that the gains were distributed in many trading days.
We can use this indicator to decide the instruments and the time we trade.
Introduction
Why we think the trading markets are boring?
It is because most of the gains were concentrated in a few trading days.
We look for instruments we can buy at support and sell at resistance frequently and repeatedly.
However, it does not happen usually because it is difficult to find sellers sell at support and buyers buy at resistance.
This script is a method to measure if an instrument is difficult to trade.
If most of the gains were concentrated in a few trading days, this script says it is difficult to trade.
If gains were distributed in many trading days and we can buy low and sell high repeatedly, this script says it is easy to trade.
Therefore, this script measure how difficult for us to trade by the ratio between the area of value and the total gain.
How it works
1. Determine the instruments and time frames we are interested in.
2. Determine how many days this script evaluate the result. This number may depend on how many days from you buy in to you sell out.
3. If the instrument you choose is easy to trade, this script reports higher values.
4. If the instrument is long term bullish, the number "easy to invest" is usually higher than the number "easy to short" .
5. We can consider trade instruments which are easier to trade than others.
6. We can consider wait until the period that it is difficult to trade has past or keep believing that some instruments are easier to trade than others.
Parameters
x_src = The price for each trading day this script use. It may be open , high , low , close or their combination.
x_is_exp = Whether this script evaluate the price movement in exponential or logarithm. You are advised to answer yes if the price changes drastically.
x_period = How many days this script evaluate the result.
Conclusion
With this indicator , we have data to explain how easy or difficult an instrument is for traders . In other words , if we hear some people say the trading markets are boring or difficult for traders , we can use this indicator to verify how accurate their comments are.
With this explainable analysis , we have more knowledge about which instruments and which sessions are relative easy for us to buy low and sell high repeatedly and frequently , we can have better proceeding than buy and hold simply.