Volume RSIThis is an indicator that shows the inflow and outflow of volume into a financial instrument. Volume is likely one of the most underrated source of data in trading unfortunately so there seems to be a lack of studies on it. The size of the candle is related to the strength of the move. The calculations for this are: cumulative sum of +volume if open < close OR -volume if open > close. This has been now transformed into an rsi style indicator to give a distinct advantage (or atleast thats the idea). The idea is that we take rsi of candles so we might as well take the rsi of volume candles. As far as I can tell it is faster/its own thing compared to regular rsi. I ave also added a smoothing option. Dont forget you can change the settings and you wont die. Thank you for your interest in this release I hope you find great piles of money with it.
link to the script I used to make this
Obv-rsi

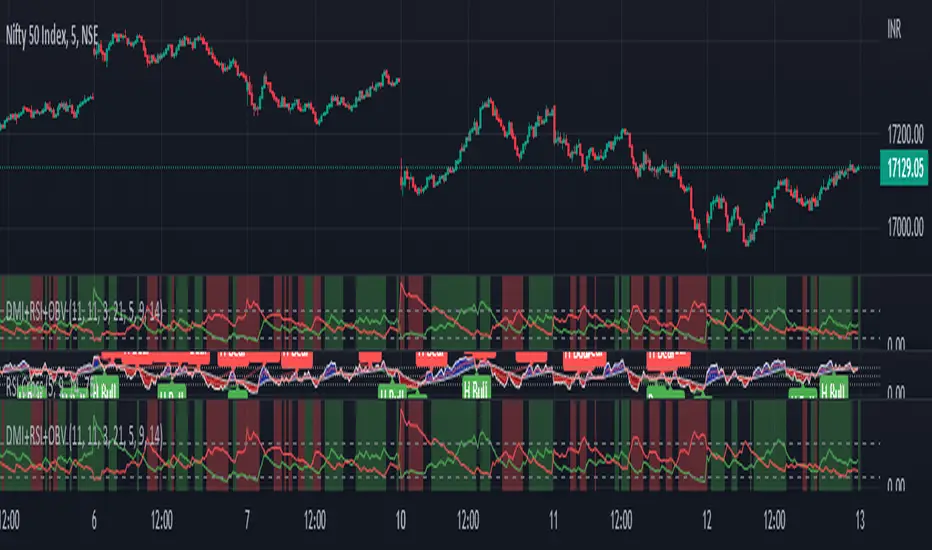
RSI+OBVthis strategy works on the basis of crossovers of RSI at different period and OBV at different periods (separately). I am using it for Nifty and Bank Nifty. Entry for long can be taken when green bar appears; and exit has to be done when it disappears. Entry for short has to be taken when red bar appears; and exit has to be done when it disappears.
With little help from price action good results can be achieved.
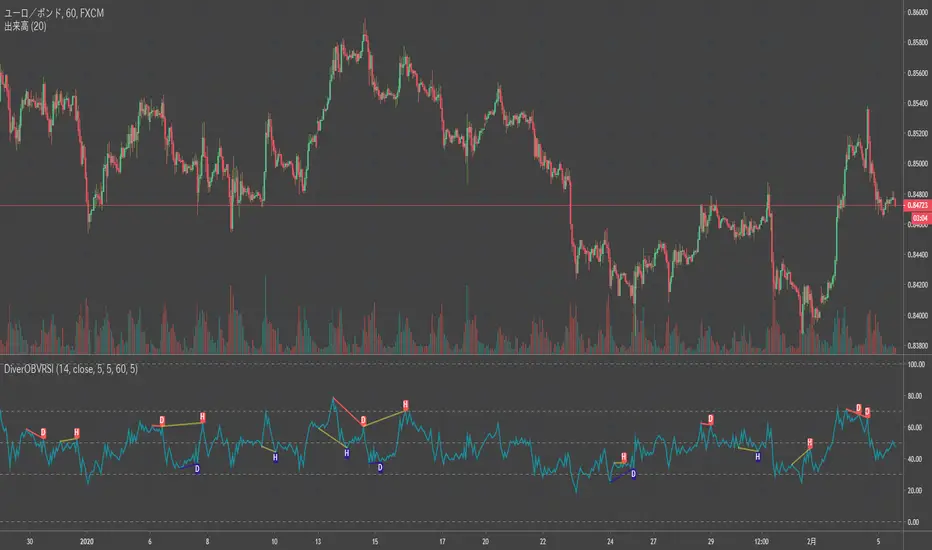
Divergence OBV RSI[mado]Divergence screener for OBV RSI
Regular Bullish: "D" navy label
Hidden Bullish: "H" navy label
Regular Bearish: "D" red label
Hidden Bearish: "H" red label