Dynamic Trend Indicator (DTI) - VWAP FilterThe Dynamic Trend Indicator (DTI) with VWAP Filter is a trend-following indicator.
It aims to identify and follow market trends while minimizing false signals in choppy or ranging markets.
The DTI combines a dynamically adjusted Exponential Moving Average (EMA) with a daily Volume Weighted Average Price (VWAP) confirmation filter and a cooldown mechanism to enhance signal reliability. This indicator is particularly useful for traders on intraday timeframes (e.g., 4-hour charts) who want to align their trades with the broader daily trend while avoiding whipsaws.
Key Features:
Dynamic Trend Line:
The core of the DTI is a trend line calculated using a custom EMA that adjusts its period dynamically based on market conditions.
The period of the EMA is determined by a combination of volatility (measured via ATR) and trend strength (measured via price momentum). In strong trends, the period shortens for faster responsiveness; in weak or ranging markets, it lengthens to reduce noise.
An optional smoothing EMA can be applied to the dynamic trend line to further reduce noise, with a user-defined smoothing length.
Daily VWAP Confirmation Filter:
A daily VWAP is calculated to provide a higher-timeframe trend bias. VWAP represents the average price paid for an asset during the day, weighted by volume, and is often used as a benchmark by institutional traders.
Buy signals are only generated when the price is above the daily VWAP (indicating a bullish daily bias), and sell signals are only generated when the price is below the VWAP (indicating a bearish daily bias).
The VWAP resets at the start of each day, ensuring it reflects the current day’s trading activity.
Cooldown Mechanism:
To prevent rapid signal reversals (whipsaws), the indicator includes a cooldown period between signals. After a buy or sell signal is generated, no new signals can be generated for a user-defined number of bars (default: 5 bars).
This helps filter out noise in choppy markets, ensuring signals are spaced out and more likely to align with significant trend changes.
Visual Elements:
Trend Line: Plotted on the chart, colored green when the price is above (uptrend) and red when below (downtrend). A gray color indicates a neutral trend.
Buy/Sell Signals: Displayed as green triangles below the bar for buy signals and red triangles above the bar for sell signals.
Background Coloring: The chart background is shaded green during uptrends and red during downtrends, providing a quick visual cue of the trend direction.
Daily VWAP Line: Optionally plotted as a purple step line, allowing traders to see the VWAP level and its relationship to the price.
Alerts:
The indicator includes built-in alerts for buy and sell signals, triggered when the price crosses the trend line and satisfies the VWAP filter and cooldown conditions.
Alert messages specify whether the signal is a buy or sell and confirm that the VWAP condition was met (e.g., "DTI Buy Signal: Price crossed above trend line and VWAP").
Input Parameters
Base Length (default: 14): The base period for calculating volatility and trend strength, used to adjust the dynamic EMA period.
Volatility Multiplier (default: 1.5): Adjusts the sensitivity of the dynamic period to market volatility (via ATR).
Trend Threshold (default: 0.5): Controls the sensitivity of the dynamic period to trend strength (via price momentum).
Use Smoothing (default: true): Enables/disables smoothing of the trend line with an additional EMA.
Smoothing Length (default: 3): The period for the smoothing EMA, if enabled.
Cooldown Bars (default: 5): The minimum number of bars between consecutive signals, reducing signal frequency in choppy markets.
Show Daily VWAP (default: true): Toggles the display of the daily VWAP line on the chart.
How It Works
Dynamic Trend Line Calculation:
Volatility is measured using the Average True Range (ATR) over the base length, scaled by the volatility multiplier.
Trend strength is calculated as the absolute price momentum (change in price over the base length) divided by the volatility factor.
The dynamic EMA period is adjusted based on the trend strength: stronger trends result in a shorter period (faster response), while weaker trends result in a longer period (more stability). The period is constrained between 5 and 50 to avoid extreme values.
A custom EMA function is used to handle the dynamic period, as Pine Script’s built-in ta.ema() requires a fixed length. The trend line is optionally smoothed with a secondary EMA.
Signal Generation:
A buy signal is generated when the price crosses above the trend line, the price is above the daily VWAP, and the cooldown period has elapsed.
A sell signal is generated when the price crosses below the trend line, the price is below the daily VWAP, and the cooldown period has elapsed.
The cooldown mechanism ensures that signals are not generated too frequently, reducing false signals in ranging markets.
Daily VWAP Calculation:
The VWAP is calculated by accumulating the price-volume product (close * volume) and total volume for the day, resetting at the start of each new day.
The VWAP is then computed as the cumulative price-volume divided by the cumulative volume, providing a volume-weighted average price for the day.
Usage
Timeframe: Best suited for intraday timeframes (e.g., 1-hour, 4-hour) where the daily VWAP provides a higher-timeframe trend bias. It can also be used on daily charts with adjustments to the cooldown period.
Markets: Works well in trending markets (e.g., forex, crypto, stocks) where the dynamic trend line can capture sustained price movements. The VWAP filter helps align signals with the daily trend, making it effective for assets with clear daily biases.
Trading Strategy:
Buy: Enter a long position when a green triangle (buy signal) appears, indicating the price has crossed above the trend line and is above the daily VWAP.
Sell: Enter a short position (or exit a long) when a red triangle (sell signal) appears, indicating the price has crossed below the trend line and is below the daily VWAP.
Use the trend line and VWAP as dynamic support/resistance levels to set stop-losses or take-profit targets.
Backtesting: Use TradingView’s strategy tester to evaluate the indicator’s performance on your chosen market and timeframe, adjusting parameters like cooldown_bars and volatility_mult to optimize for profitability.
Example
On a 4-hour SOLUSDT chart, the DTI with VWAP Filter might show:
An uptrend with the price above the green trend line and above the daily VWAP, generating buy signals as the price continues to rise.
A downtrend where the price falls below the red trend line and the daily VWAP, generating sell signals that align with the bearish daily bias.
During choppy periods, the cooldown mechanism and VWAP filter reduce false signals, ensuring trades are taken only when the price aligns with the daily trend.
Limitations
Lagging Nature: Like all trend-following indicators, the DTI may lag during sharp price reversals, as the dynamic EMA needs time to adjust.
Ranging Markets: While the VWAP filter and cooldown mechanism reduce whipsaws, the indicator may still generate some false signals in strongly ranging markets. Combining it with a trend strength filter (e.g., ADX) can help.
VWAP Dependency: The effectiveness of the VWAP filter depends on the market’s respect for the daily VWAP as a support/resistance level. In markets with low volume or erratic price action, the VWAP may be less reliable.
Potential Improvements
VWAP Buffer: Add a percentage buffer around the VWAP (e.g., require the price to be 1% above/below) to further reduce noise.
Multi-Timeframe VWAP: Incorporate a weekly VWAP for additional trend confirmation on longer timeframes.
Trend Strength Filter: Add an ADX filter to ensure signals are generated only during strong trends (e.g., ADX > 25).
Multitimeframe

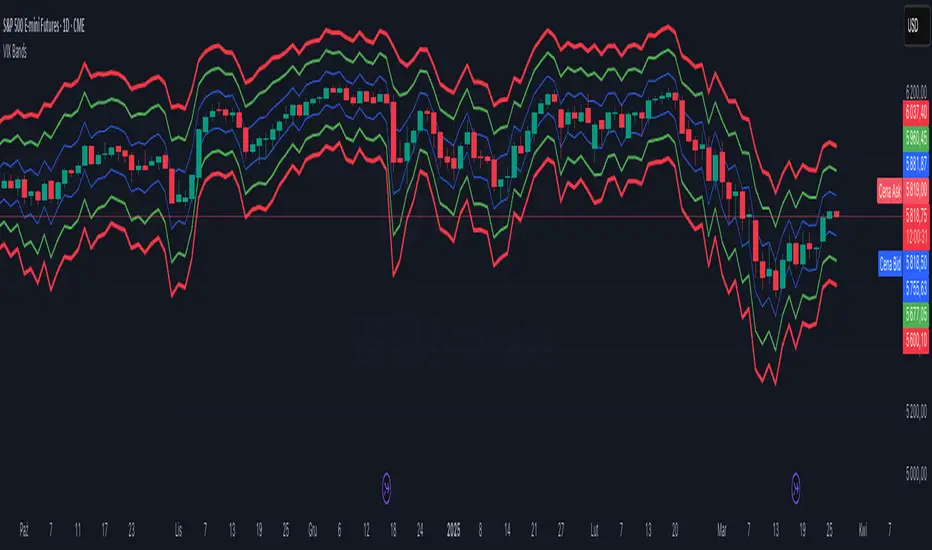
VIX Implied MovesKey Features:
Three Timeframe Bands:
Daily: Blue bands showing ±1σ expected move
Weekly: Green bands showing ±1σ expected move
30-Day: Red bands showing ±1σ expected move
Calculation Methodology:
Uses VIX's annualized volatility converted to specific timeframes using square root of time rule
Trading day convention (252 days/year)
Band width = Price × (VIX/100) ÷ √(number of periods)
Visual Features:
Colored semi-transparent backgrounds between bands
Progressive line thickness (thinner for shorter timeframes)
Real-time updates as VIX and ES prices change
Example Calculation (VIX=20, ES=5000):
Daily move = 5000 × (20/100)/√252 ≈ ±63 points
Weekly move = 5000 × (20/100)/√50 ≈ ±141 points
Monthly move = 5000 × (20/100)/√21 ≈ ±218 points
This indicator helps visualize expected price ranges based on current volatility conditions, with wider bands indicating higher market uncertainty. The probabilistic ranges represent 68% confidence levels (1 standard deviation) derived from options pricing.
Super Cycle Low FinderHow the Indicator Works
1. Inputs
Users can adjust the cycle lengths:
Daily Cycle: Default is 40 days (within 36-44 days).
Weekly Cycle: Default is 26 weeks (182 days, within 22-31 weeks).
Yearly Cycle: Default is 4 years (1460 days).
2. Cycle Low Detection
Function: detect_cycle_low finds the lowest low over the specified period and confirms it with a bullish candle (close > open).
Timeframes: Daily lows are calculated directly; weekly and yearly lows use request.security to fetch data from higher timeframes.
3. Half Cycle Lows
Detected over half the cycle length, plotted to show mid-cycle strength or weakness.
4. Cycle Translation
Logic: Compares the position of the highest high to the cycle’s midpoint.
Output: "R" for right translated (bullish), "L" for left translated (bearish), displayed above bars.
5. Cycle Failure
Flags when a new low falls below the previous cycle low, indicating a breakdown.
6. Visualization
Cycle Lows: Diamonds below bars (yellow for daily, green for weekly, blue for yearly).
Half Cycle Lows: Circles below bars (orange, lime, aqua).
Translations: "R" or "L" above bars in distinct colors.
Failures: Downward triangles below bars (red, orange, purple).

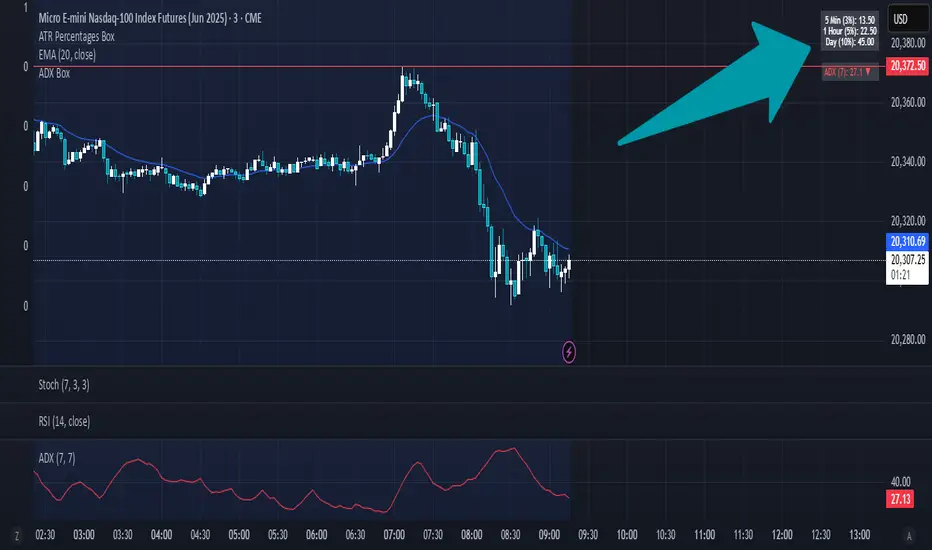
ADX BoxDescription:
The ADX Box indicator provides traders with a quick and intuitive way to monitor the current trend strength based on the Average Directional Index (ADX), calculated with a customisable period (default: 7 periods).
This compact indicator neatly displays the current ADX value rounded to one decimal place, along with a clear directional arrow:
Green upward triangle (▲): Indicates that ADX is rising above its moving average, signaling increasing trend strength.
Red downward triangle (▼): Indicates that ADX is declining below its moving average, signaling weakening trend strength.
Key Features:
Small and clean visual representation.
Dynamically updates in real-time directly on the chart.
Ideal for quick trend strength assessment without cluttering your workspace.
Recommended Usage:
Quickly identifying whether market trends are strengthening or weakening.
Enhancing decision-making for trend-following or breakout trading strategies.
Complementing other indicators such as ATR boxes for volatility measurement.
Feel free to use, share, and incorporate this indicator into your trading setups for clearer insights and more confident trading decisions!
Multi-Fibonacci Trend Average[FibonacciFlux]Multi-Fibonacci Trend Average (MFTA): An Institutional-Grade Trend Confluence Indicator for Discerning Market Participants
My original indicator/Strategy:
Engineered for the sophisticated demands of institutional and advanced traders, the Multi-Fibonacci Trend Average (MFTA) indicator represents a paradigm shift in technical analysis. This meticulously crafted tool is designed to furnish high-definition trend signals within the complexities of modern financial markets. Anchored in the rigorous principles of Fibonacci ratios and augmented by advanced averaging methodologies, MFTA delivers a granular perspective on trend dynamics. Its integration of Multi-Timeframe (MTF) filters provides unparalleled signal robustness, empowering strategic decision-making with a heightened degree of confidence.
MFTA indicator on BTCUSDT 15min chart with 1min RSI and MACD filters enabled. Note the refined signal generation with reduced noise.
MFTA indicator on BTCUSDT 15min chart without MTF filters. While capturing more potential trading opportunities, it also generates a higher frequency of signals, including potential false positives.
Core Innovation: Proprietary Fibonacci-Enhanced Supertrend Averaging Engine
The MFTA indicator’s core innovation lies in its proprietary implementation of Supertrend analysis, strategically fortified by Fibonacci ratios to construct a truly dynamic volatility envelope. Departing from conventional Supertrend methodologies, MFTA autonomously computes not one, but three distinct Supertrend lines. Each of these lines is uniquely parameterized by a specific Fibonacci factor: 0.618 (Weak), 1.618 (Medium/Golden Ratio), and 2.618 (Strong/Extended Fibonacci).
// Fibonacci-based factors for multiple Supertrend calculations
factor1 = input.float(0.618, 'Factor 1 (Weak/Fibonacci)', minval=0.01, step=0.01, tooltip='Factor 1 (Weak/Fibonacci)', group="Fibonacci Supertrend")
factor2 = input.float(1.618, 'Factor 2 (Medium/Golden Ratio)', minval=0.01, step=0.01, tooltip='Factor 2 (Medium/Golden Ratio)', group="Fibonacci Supertrend")
factor3 = input.float(2.618, 'Factor 3 (Strong/Extended Fib)', minval=0.01, step=0.01, tooltip='Factor 3 (Strong/Extended Fib)', group="Fibonacci Supertrend")
This multi-faceted architecture adeptly captures a spectrum of market volatility sensitivities, ensuring a comprehensive assessment of prevailing conditions. Subsequently, the indicator algorithmically synthesizes these disparate Supertrend lines through arithmetic averaging. To achieve optimal signal fidelity and mitigate inherent market noise, this composite average is further refined utilizing an Exponential Moving Average (EMA).
// Calculate average of the three supertends and a smoothed version
superlength = input.int(21, 'Smoothing Length', tooltip='Smoothing Length for Average Supertrend', group="Fibonacci Supertrend")
average_trend = (supertrend1 + supertrend2 + supertrend3) / 3
smoothed_trend = ta.ema(average_trend, superlength)
The resultant ‘Smoothed Trend’ line emerges as a remarkably responsive yet stable trend demarcation, offering demonstrably superior clarity and precision compared to singular Supertrend implementations, particularly within the turbulent dynamics of high-volatility markets.
Elevated Signal Confluence: Integrated Multi-Timeframe (MTF) Validation Suite
MFTA transcends the limitations of conventional trend indicators by incorporating an advanced suite of three independent MTF filters: RSI, MACD, and Volume. These filters function as sophisticated validation protocols, rigorously ensuring that only signals exhibiting a confluence of high-probability factors are brought to the forefront.
1. Granular Lower Timeframe RSI Momentum Filter
The Relative Strength Index (RSI) filter, computed from a user-defined lower timeframe, furnishes critical momentum-based signal validation. By meticulously monitoring RSI dynamics on an accelerated timeframe, traders gain the capacity to evaluate underlying momentum strength with precision, prior to committing to signal execution on the primary chart timeframe.
// --- Lower Timeframe RSI Filter ---
ltf_rsi_filter_enable = input.bool(false, title="Enable RSI Filter", group="MTF Filters", tooltip="Use RSI from lower timeframe as a filter")
ltf_rsi_timeframe = input.timeframe("1", title="RSI Timeframe", group="MTF Filters", tooltip="Timeframe for RSI calculation")
ltf_rsi_length = input.int(14, title="RSI Length", minval=1, group="MTF Filters", tooltip="Length for RSI calculation")
ltf_rsi_threshold = input.int(30, title="RSI Threshold", minval=0, maxval=100, group="MTF Filters", tooltip="RSI value threshold for filtering signals")
2. Convergent Lower Timeframe MACD Trend-Momentum Filter
The Moving Average Convergence Divergence (MACD) filter, also calculated on a lower timeframe basis, introduces a critical layer of trend-momentum convergence confirmation. The bullish signal configuration rigorously mandates that the MACD line be definitively positioned above the Signal line on the designated lower timeframe. This stringent condition ensures a robust indication of converging momentum that aligns synergistically with the prevailing trend identified on the primary timeframe.
// --- Lower Timeframe MACD Filter ---
ltf_macd_filter_enable = input.bool(false, title="Enable MACD Filter", group="MTF Filters", tooltip="Use MACD from lower timeframe as a filter")
ltf_macd_timeframe = input.timeframe("1", title="MACD Timeframe", group="MTF Filters", tooltip="Timeframe for MACD calculation")
ltf_macd_fast_length = input.int(12, title="MACD Fast Length", minval=1, group="MTF Filters", tooltip="Fast EMA length for MACD")
ltf_macd_slow_length = input.int(26, title="MACD Slow Length", minval=1, group="MTF Filters", tooltip="Slow EMA length for MACD")
ltf_macd_signal_length = input.int(9, title="MACD Signal Length", minval=1, group="MTF Filters", tooltip="Signal SMA length for MACD")
3. Definitive Volume Confirmation Filter
The Volume Filter functions as an indispensable arbiter of trade conviction. By establishing a dynamic volume threshold, defined as a percentage relative to the average volume over a user-specified lookback period, traders can effectively ensure that all generated signals are rigorously validated by demonstrably increased trading activity. This pivotal validation step signifies robust market participation, substantially diminishing the potential for spurious or false breakout signals.
// --- Volume Filter ---
volume_filter_enable = input.bool(false, title="Enable Volume Filter", group="MTF Filters", tooltip="Use volume level as a filter")
volume_threshold_percent = input.int(title="Volume Threshold (%)", defval=150, minval=100, group="MTF Filters", tooltip="Minimum volume percentage compared to average volume to allow signal (100% = average)")
These meticulously engineered filters operate in synergistic confluence, requiring all enabled filters to definitively satisfy their pre-defined conditions before a Buy or Sell signal is generated. This stringent multi-layered validation process drastically minimizes the incidence of false positive signals, thereby significantly enhancing entry precision and overall signal reliability.
Intuitive Visual Architecture & Actionable Intelligence
MFTA provides a demonstrably intuitive and visually rich charting environment, meticulously delineating trend direction and momentum through precisely color-coded plots:
Average Supertrend: Thin line, green/red for uptrend/downtrend, immediate directional bias.
Smoothed Supertrend: Bold line, teal/purple for uptrend/downtrend, cleaner, institutionally robust trend.
Dynamic Trend Fill: Green/red fill between Supertrends quantifies trend strength and momentum.
Adaptive Background Coloring: Light green/red background mirrors Smoothed Supertrend direction, holistic trend perspective.
Precision Buy/Sell Signals: ‘BUY’/‘SELL’ labels appear on chart when trend touch and MTF filter confluence are satisfied, facilitating high-conviction trade action.
MFTA indicator applied to BTCUSDT 4-hour chart, showcasing its effectiveness on higher timeframes. The Smoothed Length parameter is increased to 200 for enhanced smoothness on this timeframe, coupled with 1min RSI and Volume filters for signal refinement. This illustrates the indicator's adaptability across different timeframes and market conditions.
Strategic Applications for Institutional Mandates
MFTA’s sophisticated design provides distinct advantages for advanced trading operations and institutional investment mandates. Key strategic applications include:
High-Probability Trend Identification: Fibonacci-averaged Supertrend with MTF filters robustly identifies high-probability trend continuations and reversals, enhancing alpha generation.
Precision Entry/Exit Signals: Volume and momentum-filtered signals enable institutional-grade precision for optimized risk-adjusted returns.
Algorithmic Trading Integration: Clear signal logic facilitates seamless integration into automated trading systems for scalable strategy deployment.
Multi-Asset/Timeframe Versatility: Adaptable parameters ensure applicability across diverse asset classes and timeframes, catering to varied trading mandates.
Enhanced Risk Management: Superior signal fidelity from MTF filters inherently reduces false signals, supporting robust risk management protocols.
Granular Customization and Parameterized Control
MFTA offers unparalleled customization, empowering users to fine-tune parameters for precise alignment with specific trading styles and market conditions. Key adjustable parameters include:
Fibonacci Factors: Adjust Supertrend sensitivity to volatility regimes.
ATR Length: Control volatility responsiveness in Supertrend calculations.
Smoothing Length: Refine Smoothed Trend line responsiveness and noise reduction.
MTF Filter Parameters: Independently configure timeframes, lookback periods, and thresholds for RSI, MACD, and Volume filters for optimal signal filtering.
Disclaimer
MFTA is meticulously engineered for high-quality trend signals; however, no indicator guarantees profit. Market conditions are unpredictable, and trading involves substantial risk. Rigorous backtesting and forward testing across diverse datasets, alongside a comprehensive understanding of the indicator's logic, are essential before live deployment. Past performance is not indicative of future results. MFTA is for informational and analytical purposes only and is not financial or investment advice.

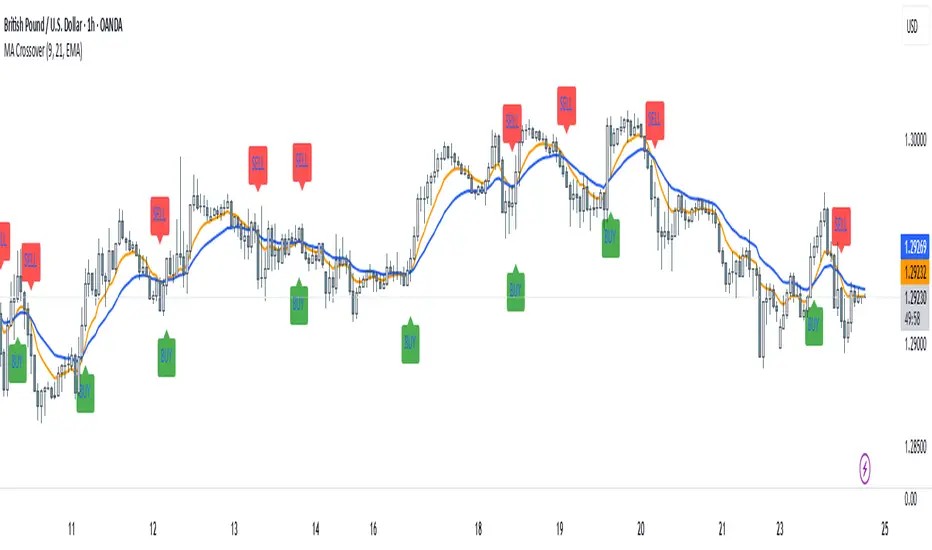
Forexsom MA Crossover SignalsA Trend-Following Trading Indicator for TradingView
Overview
This indicator plots two moving averages (MA) on your chart and generates visual signals when they cross, helping traders identify potential trend reversals. It is designed to be simple yet effective for both beginners and experienced traders.
Key Features
✅ Dual Moving Averages – Plots a Fast MA (default: 9-period) and a Slow MA (default: 21-period)
✅ Customizable MA Types – Choose between EMA (Exponential Moving Average) or SMA (Simple Moving Average)
✅ Clear Buy/Sell Signals – Displays "BUY" (green label) when the Fast MA crosses above the Slow MA and "SELL" (red label) when it crosses below
✅ Alerts – Get notified when new signals appear (compatible with TradingView alerts)
✅ Clean Visuals – Easy-to-read moving averages with adjustable colors
How It Works
Bullish Signal (BUY) → Fast MA crosses above Slow MA (suggests uptrend)
Bearish Signal (SELL) → Fast MA crosses below Slow MA (suggests downtrend)
Best Used For
✔ Trend-following strategies (swing trading, day trading)
✔ Confirming trend reversals
✔ Filtering trade entries in combination with other indicators
Customization Options
Adjust Fast & Slow MA lengths
Switch between EMA or SMA for smoother or more responsive signals
Why Use This Indicator?
Simple & Effective – No clutter, just clear signals
Works on All Timeframes – From scalping (1M, 5M) to long-term trading (4H, Daily)
Alerts for Real-Time Trading – Never miss a signal
Forex Fire EMA/MA/RSI StrategyEURUSD
The entry method in the Forex Fire EMA/MA/RSI Strategy combines several conditions across two timeframes. Here's a breakdown of how entries are determined:
Long Entry Conditions:
15-Minute Timeframe Conditions:
EMA 13 > EMA 62 (short-term momentum is bullish)
Price > MA 200 (trading above the major trend indicator)
Fast RSI (7) > Slow RSI (28) (momentum is increasing)
Fast RSI > 50 (showing bullish momentum)
Volume is increasing compared to 20-period average
4-Hour Timeframe Confluence:
EMA 13 > EMA 62 (larger timeframe confirms bullish trend)
Price > MA 200 (confirming overall uptrend)
Slow RSI (28) > 40 (showing bullish bias)
Fast RSI > Slow RSI (momentum is supporting the move)
Additional Precision Requirement:
Either EMA 13 has just crossed above EMA 62 (crossover)
OR price has just crossed above MA 200
Short Entry Conditions:
15-Minute Timeframe Conditions:
EMA 13 < EMA 62 (short-term momentum is bearish)
Price < MA 200 (trading below the major trend indicator)
Fast RSI (7) < Slow RSI (28) (momentum is decreasing)
Fast RSI < 50 (showing bearish momentum)
Volume is increasing compared to 20-period average
4-Hour Timeframe Confluence:
EMA 13 < EMA 62 (larger timeframe confirms bearish trend)
Price < MA 200 (confirming overall downtrend)
Slow RSI (28) < 60 (showing bearish bias)
Fast RSI < Slow RSI (momentum is supporting the move)
Additional Precision Requirement:
Either EMA 13 has just crossed under EMA 62 (crossunder)
OR price has just crossed under MA 200
The key aspect of this strategy is that it requires alignment between the shorter timeframe (15m) and the larger timeframe (4h), which helps filter out false signals and focuses on trades that have strong multi-timeframe support. The crossover/crossunder requirement further refines entries by looking for actual changes in direction rather than just conditions that might have been in place for a long time.

ICT Breakers (BOS / MSS - Market Structure) [ICTProTools]The Breakers (Market Structure) indicator is designed to help traders identify true breaker structures , a key concept in Inner Circle Trader (ICT) methodology. In market structure, Breakers represent powerful shifts where a key high or low is broken, leading to a reversal in market direction. Most tools misinterpret structure shifts, using internal structure , leading to fake breakouts. This tool solves that problem by filtering out false signals , providing clear & structured insights , all with multi-timeframe compatibility.
💎 Key Features
⚡️ Breakers in action
The indicator shows the structure following ICT instructions. A breaker is defined by two lines:
The first line confirms the previous trend (it could be interpreted as a BOS).
The second line highlights the moment price breaks structure (with candle body or wick based on your chosen settings), signaling a shift in trend direction (like an MSS).
Furthermore, it’s important to note that a breaker not only shows the structure, but also defines a potential Point of Interest (POI), an area where price may retrace before continuing its trend.
Here, we can observe two clear structure shifts.
On the far left, the market was in a bearish trend, illustrated by the first visible (dotted and red) line. Shortly after, the second (solid and green) line appears, showing a break that initiates a new bullish trend.
This upward movement continues, with the last confirmation marked by a top structure line. And finally, the structure is broken once again indicating a transition back into a bearish trend.
💪 Real Structure with True Highs / Lows
Unlike many indicators that detect internal breakouts , this tool follows ICT’s true market structure rules .
In a bearish trend , a bullish breaker is only confirmed when the high that created the low is broken , and conversely for a bullish scenario.
Fake breakouts are ignored, preventing misleading signals.
In the image above, the white breakout is correctly ignored by the indicator, as it doesn't align with ICT’s structural rules. That white high is simply part of the internal structure, not the true swing point. Instead, the green line highlights the key level that truly matters, the one whose rupture would have confirmed a real change in market structure.
🔔 Smart Alerts for Structure Updates
Stay one step ahead with customizable alerts designed to notify you instantly when market structure changes occur.
Get notified for BOS (Continuation) and / or MSS (Breaker) events.
Set alerts for bullish , bearish , or both directions.
Choose between once or repeated alerts , based on your strategy.
This feature allows traders to remain focused and reactive , even when monitoring multiple markets.
In the alert settings, select which structure shifts you want to be notified of. Whether you're a scalper or a swing trader, the alerts keep you connected to key moments without needing to constantly monitor the chart.
⏳ Multi-Timeframe Structure
All features of the indicator are fully compatible with higher timeframes .
Get a broader view of market structure without switching timeframes.
Monitor higher timeframe structures and receive alerts, all without leaving your analysis chart .
In this example, the market structure of the 30m timeframe is displayed while on a 5m chart, providing a clearer perspective.
✨ Customization & User Control
Make it yours! The indicator allows full customization:
Swing bars (to confirm high / low)
Select your mode for Breakers (MSS) , using the candle body only or body / wick
Line style (type, width, color)
Choice of displayed timeframe
Activate any alert , with the frequency you want
🎯 Conclusion
✅ Avoid false signals by focusing on true ICT Breakers
✅ Smart alerts to never miss a structural shift
✅ Multi-timeframe support for enhanced analysis
✅ Clean & professional design for an optimal trading experience

Lower Timeframe *MALower Timeframe Moving Average (MA) Indicator
This indicator calculates a moving average using data from a lower timeframe than the chart's current timeframe.
It provides potentially earlier signals and smoother price action by incorporating more granular price data. It also allows you to keep the same reference frame for your moving average regardless of your currently selected period.
Key Features:
- Uses lower timeframe data to calculate moving averages on higher timeframes
- Supports multiple MA types: SMA, EMA, WMA, VWMA, RMA, and HMA
- Allows selection of various price inputs (close, open, high, low, hl2, hlc3, ohlc4)
- Automatically adjusts MA length based on the ratio between chart timeframe and selected sub-timeframe
15m
5m

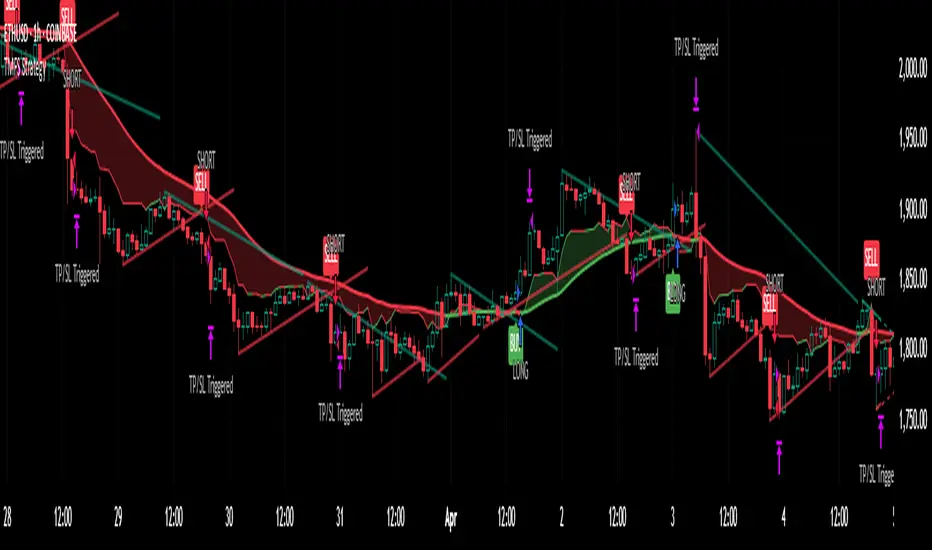
Trendline Breaks with Multi Fibonacci Supertrend StrategyTMFS Strategy: Advanced Trendline Breakouts with Multi-Fibonacci Supertrend
Elevate your algorithmic trading with institutional-grade signal confluence
Strategy Genesis & Evolution
This advanced trading system represents the culmination of a personal research journey, evolving from my custom " Multi Fibonacci Supertrend with Signals " indicator into a comprehensive trading strategy. Built upon the exceptional trendline detection methodology pioneered by LuxAlgo in their " Trendlines with Breaks " indicator, I've engineered a systematic framework that integrates multiple technical factors into a cohesive trading system.
Core Fibonacci Principles
At the heart of this strategy lies the Fibonacci sequence application to volatility measurement:
// Fibonacci-based factors for multiple Supertrend calculations
factor1 = input.float(0.618, 'Factor 1 (Weak/Fibonacci)', minval = 0.01, step = 0.01)
factor2 = input.float(1.618, 'Factor 2 (Medium/Golden Ratio)', minval = 0.01, step = 0.01)
factor3 = input.float(2.618, 'Factor 3 (Strong/Extended Fib)', minval = 0.01, step = 0.01)
These precise Fibonacci ratios create a dynamic volatility envelope that adapts to changing market conditions while maintaining mathematical harmony with natural price movements.
Dynamic Trendline Detection
The strategy incorporates LuxAlgo's pioneering approach to trendline detection:
// Pivotal swing detection (inspired by LuxAlgo)
pivot_high = ta.pivothigh(swing_length, swing_length)
pivot_low = ta.pivotlow(swing_length, swing_length)
// Dynamic slope calculation using ATR
slope = atr_value / swing_length * atr_multiplier
// Update trendlines based on pivot detection
if bool(pivot_high)
upper_slope := slope
upper_trendline := pivot_high
else
upper_trendline := nz(upper_trendline) - nz(upper_slope)
This adaptive trendline approach automatically identifies key structural market boundaries, adjusting in real-time to evolving chart patterns.
Breakout State Management
The strategy implements sophisticated state tracking for breakout detection:
// Track breakouts with state variables
var int upper_breakout_state = 0
var int lower_breakout_state = 0
// Update breakout state when price crosses trendlines
upper_breakout_state := bool(pivot_high) ? 0 : close > upper_trendline ? 1 : upper_breakout_state
lower_breakout_state := bool(pivot_low) ? 0 : close < lower_trendline ? 1 : lower_breakout_state
// Detect new breakouts (state transitions)
bool new_upper_breakout = upper_breakout_state > upper_breakout_state
bool new_lower_breakout = lower_breakout_state > lower_breakout_state
This state-based approach enables precise identification of the exact moment when price breaks through a significant trendline.
Multi-Factor Signal Confluence
Entry signals require confirmation from multiple technical factors:
// Define entry conditions with multi-factor confluence
long_entry_condition = enable_long_positions and
upper_breakout_state > upper_breakout_state and // New trendline breakout
di_plus > di_minus and // Bullish DMI confirmation
close > smoothed_trend // Price above Supertrend envelope
// Execute trades only with full confirmation
if long_entry_condition
strategy.entry('L', strategy.long, comment = "LONG")
This strict requirement for confluence significantly reduces false signals and improves the quality of trade entries.
Advanced Risk Management
The strategy includes sophisticated risk controls with multiple methodologies:
// Calculate stop loss based on selected method
get_long_stop_loss_price(base_price) =>
switch stop_loss_method
'PERC' => base_price * (1 - long_stop_loss_percent)
'ATR' => base_price - long_stop_loss_atr_multiplier * entry_atr
'RR' => base_price - (get_long_take_profit_price() - base_price) / long_risk_reward_ratio
=> na
// Implement trailing functionality
strategy.exit(
id = 'Long Take Profit / Stop Loss',
from_entry = 'L',
qty_percent = take_profit_quantity_percent,
limit = trailing_take_profit_enabled ? na : long_take_profit_price,
stop = long_stop_loss_price,
trail_price = trailing_take_profit_enabled ? long_take_profit_price : na,
trail_offset = trailing_take_profit_enabled ? long_trailing_tp_step_ticks : na,
comment = "TP/SL Triggered"
)
This flexible approach adapts to varying market conditions while providing comprehensive downside protection.
Performance Characteristics
Rigorous backtesting demonstrates exceptional capital appreciation potential with impressive risk-adjusted metrics:
Remarkable total return profile (1,517%+)
Strong Sortino ratio (3.691) indicating superior downside risk control
Profit factor of 1.924 across all trades (2.153 for long positions)
Win rate exceeding 35% with balanced distribution across varied market conditions
Institutional Considerations
The strategy architecture addresses execution complexities faced by institutional participants with temporal filtering and date-range capabilities:
// Time Filter settings with flexible timezone support
import jason5480/time_filters/5 as time_filter
src_timezone = input.string(defval = 'Exchange', title = 'Source Timezone')
dst_timezone = input.string(defval = 'Exchange', title = 'Destination Timezone')
// Date range filtering for precise execution windows
use_from_date = input.bool(defval = true, title = 'Enable Start Date')
from_date = input.time(defval = timestamp('01 Jan 2022 00:00'), title = 'Start Date')
// Validate trading permission based on temporal constraints
date_filter_approved = time_filter.is_in_date_range(
use_from_date, from_date, use_to_date, to_date, src_timezone, dst_timezone
)
These capabilities enable precise execution timing and market session optimization critical for larger market participants.
Acknowledgments
Special thanks to LuxAlgo for the pioneering work on trendline detection and breakout identification that inspired elements of this strategy. Their innovative approach to technical analysis provided a valuable foundation upon which I could build my Fibonacci-based methodology.
This strategy is shared under the same Attribution-NonCommercial-ShareAlike 4.0 International (CC BY-NC-SA 4.0) license as LuxAlgo's original work.
Past performance is not indicative of future results. Conduct thorough analysis before implementing any algorithmic strategy.
Quantum Motion Oscillator-QMO (TechnoBlooms)Quantum Motion Oscillator (QMO) is a momentum indicator designed for traders who demand precision. Combining multi-timeframe weighted linear regression with EMA crossovers, QMO offers a dynamic view of market momentum, helping traders anticipate trend shifts with greater accuracy.
This oscillator is inspired by quantum mechanics and wave theory, where market movement is seen as a series of probabilistic waves rather than rigid structures.
The histogram is plotted in proportion to the price movement of the candlesticks.
KEY FEATURES
1. Multi-Timeframe Histogram - Integrates 1 to 5 weighted linear regression averages, reducing lag while maintaining accuracy.
2. EMA Crossover Signal - Uses a Short and Long EMA to confirm trend shifts with minimal noise.
3. Adaptive Trend Analysis - Self-adjusting mechanics make QMO effective in both ranging and trending markets.
4. Scalable for Different Trading Styles - Works seamlessly for scalping, intraday, swing and position trading.
ADVANCED PROFESSIONAL INSIGHTS
1. Wave Dynamics and Market Flow - Inspired by wave mechanics, QMO reflects the energy accumulation and dissipation in price movements.
Expanding histogram waves = Strong momentum surge
Contracting waves = Momentum weakening, potential reversal zone.
2. Liquidity and Order Flow Applications - QMO works well alongside liquidity concepts and smart money techniques:
Combine with Fair Value Gaps & Order Blocks -> Enter when QMO signals align with liquidity zones.
Avoid False Moves - If price sweeps liquidity, but QMO momentum diverges, it is a sign of potential smart money manipulation.

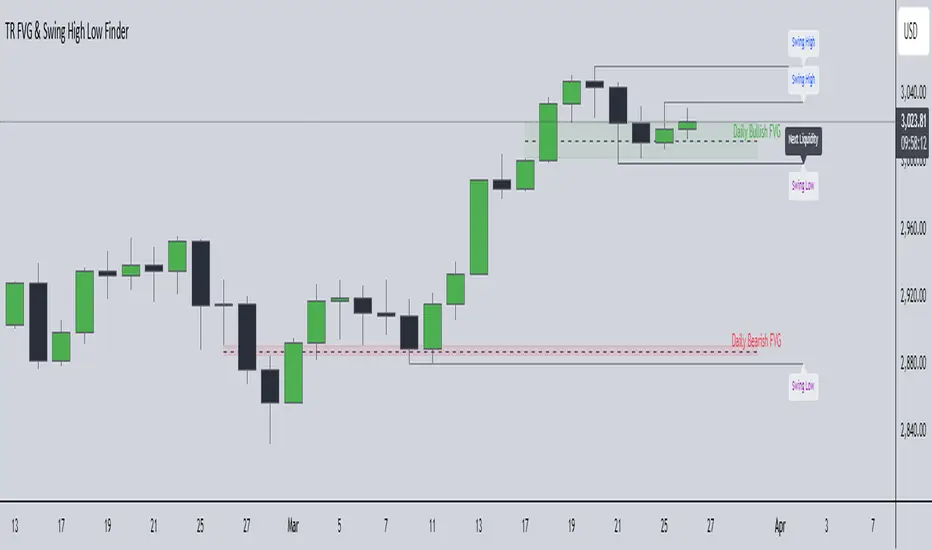
TR FVG & Swing High Low FinderTR FVG & Swing Level Finder
Overview:
The TR FVG & Swing Level Finder is a powerful Pine Script indicator designed for traders who want to identify Fair Value Gaps (FVGs) and Swing Highs/Lows on their charts. This indicator combines two essential technical analysis tools into one, helping traders spot potential areas of support, resistance, and trend reversals. FVGs are price gaps that often act as areas of interest for price to return to, while swing highs and lows help identify key turning points in the market. The indicator is highly customizable, allowing users to adjust colors, limits, and display options to suit their trading style.
Key Features:
1: Fair Value Gap (FVG) Detection:
- Identifies Bullish FVGs: Occur when the high of two candles ago is lower than the low of the current candle, indicating a potential upward price movement.
- Identifies Bearish FVGs: Occur when the low of two candles ago is higher than the high of the current candle, indicating a potential downward price movement.
- Displays FVGs as colored boxes on the chart, with customizable border and fill colors based on the timeframe.
- Labels each FVG box with the corresponding timeframe (e.g., "1m FVG", "1h FVG", "Daily FVG").
2: Swing High and Swing Low Detection:
- Detects Swing Highs: A 3-candle pattern where the middle candle's high is higher than the highs of the candles on either side.
- Detects Swing Lows: A 3-candle pattern where the middle candle's low is lower than the lows of the candles on either side.
- Draws a solid black line with 50% opacity at each swing high and low, extending 5 bars to the right for better visibility.
- Adds a small Swing High or Swing Low label at the right end of each line, colored according to user-defined settings.
3: Timeframe-Specific FVG Visualization:
- FVGs are color-coded based on the chart's timeframe, making it easy to distinguish between FVGs on different timeframes.
- Each timeframe has its own fill color for bullish and bearish FVGs, with adjustable transparency for better chart clarity.
- A dashed black line is drawn in the middle of each FVG box to highlight the midpoint of the gap.
4: Customizable Display Options:
- FVG Limit: Control the maximum number of FVGs displayed on the chart (from 1 to 20).
- Extend Options for FVG Boxes:
- "None": FVG boxes extend only 2 bars to the right.
- "Limited": FVG boxes extend a user-defined number of candles to the right (1 to 100 candles).
- "Default": FVG boxes extend 3 bars to the right of the current bar.
- Color Customization:
- Set border colors for bullish and bearish FVGs.
- Adjust fill colors for FVGs on different timeframes (1m, 5m, 15m, 30m, 1h, 4h, Daily, Weekly, Monthly).
- Customize the colors of swing high and swing low labels.
5: Performance Optimization:
- The indicator only plots FVGs and swings on the last confirmed bar (barstate.islastconfirmedhistory), ensuring efficient performance and reducing chart clutter.
- Limits the number of displayed FVGs and swings to the user-defined fvgLimit, keeping the chart clean and focused on the most recent price action.
6: Inputs and Customization:
- Number of FVGs to Show (fvgLimit): Set the maximum number of FVGs and swings to display (default: 3, range: 1 to 20).
- Bullish FVG Border Color (bullishColor): Choose the border color for bullish FVGs (default: green).
- Bearish FVG Border Color (bearishColor): Choose the border color for bearish FVGs (default: red).
- Swing High Color (swingHighColor): Set the color for swing high labels (default: blue).
- Swing Low Color (swingLowColor): Set the color for swing low labels (default: purple).
- Extend Options:
- Extend Option (extendOption): Choose how far FVG boxes extend to the right ("None", "Limited", or "Default"; default: "Default").
- Extend Candles (extendCandles): If "Limited" is selected, specify the number of candles to extend FVG boxes (default: 8, range: 1 to 100).
- Timeframe-Specific Fill Colors:
- Customize fill colors for bullish and bearish FVGs on various timeframes (1m, 5m, 15m, 30m, 1h, 4h, Daily, Weekly, Monthly).
- Each fill color has a default transparency (e.g., 93% for most timeframes, 90% for 30m), which can be adjusted as needed.
How to Use:
1: Add the Indicator to Your Chart:
- Open TradingView, go to the Pine Editor, and paste the script.
- Click "Add to Chart" to apply the indicator to your current chart.
2: Adjust Settings:
- Open the indicator settings by clicking the gear icon next to the indicator name on your chart.
- Modify the inputs to suit your preferences:
- Set the number of FVGs and swings to display.
- Choose your preferred colors for FVGs and swings.
- Adjust the extend options for FVG boxes.
3: Interpret the Indicator:
- FVG Boxes: Look for colored boxes on the chart, which represent Fair Value Gaps. Bullish FVGs (green borders by default) suggest potential buying opportunities, while bearish FVGs (red borders by default) suggest potential selling opportunities. The label inside each box indicates the timeframe of the FVG.
- Swing Highs and Lows: Identify key turning points with solid black lines (50% opacity) at swing highs and lows. Each line extends 5 bars to the right, with an "SH" (Swing High) or "SL" (Swing Low) label at the end. Swing highs can act as resistance levels, while swing lows can act as support levels.
4: Combine with Your Strategy:
- Use FVGs to identify areas where price might return to fill the gap, often acting as support or resistance.
- Use swing highs and lows to spot potential trend reversals or to set stop-loss and take-profit levels.
- Combine the indicator with other tools (e.g., trendlines, moving averages) for a more comprehensive trading strategy.
Notes:
- The indicator works on all timeframes, but the appearance of FVGs and swings will vary depending on the chart's timeframe.
- For best results, use the indicator on a clean chart to avoid visual clutter, especially if you increase the fvgLimit.
- The swing high/low lines are drawn with 50% opacity to ensure they don’t overpower other chart elements, but they are still clearly visible.
Author’s Note:
This script was developed to help traders identify key price levels with ease. I hope it adds value to your trading! If you have any feedback or suggestions for improvement, feel free to leave a comment. Happy trading!
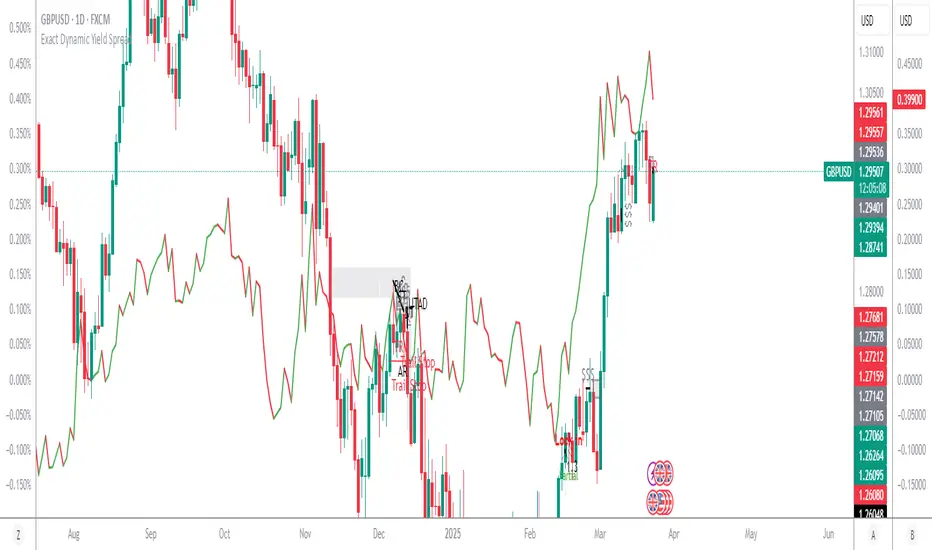
Exact Dynamic Yield SpreadYield Spread Overlay
"Yield Spread Overlay" is an indicator that displays the yield spread between two currencies based on their respective 10-year bond yields. It overlays directly onto the Forex chart, allowing real-time visualization of the relationship between the yield spread and the currency pair's price movements.
This indicator saves time by avoiding the manual addition of bond yields. Unlike manual methods, it supports smaller timeframes (1h, 4h, etc.), making it particularly useful.
Several customization options are available to suit individual preferences:
Custom Display: Adjust the line thickness and color.
Scale Position: Choose between displaying the scale on the right or left side of the chart.
This indicator helps traders better understand currency relationships and can serve as an additional tool within a Forex trading strategy.
All feedback, suggestions, and critiques—positive or negative—are welcome to continually improve this tool.
Multi-Timeframe EMAsThis TradingView indicator provides a comprehensive overview of price momentum by overlaying multiple Exponential Moving Averages (EMAs) from different timeframes onto a single chart. By combining 1-hour, 4-hour, and daily EMAs, you can observe short-term trends while simultaneously monitoring medium-term and long-term market dynamics. The 1-hour EMA 13 and EMA 21 help capture rapid price changes, which is useful for scalpers or intraday traders looking to identify sudden momentum shifts. Meanwhile, the 4-hour EMA 21 offers a more stable, intermediate perspective, filtering out some of the noise found in shorter intervals. Finally, the daily EMAs (13, 25, and 50) highlight prevailing market sentiment over a longer period, enabling traders to assess higher-level trends and gauge whether short-term signals align with overarching tendencies. By plotting all these EMAs together, it becomes easier to detect confluences or divergences across different time horizons, making it simpler to refine entries and exits based on multi-timeframe confirmation. This script is especially helpful for swing traders and position traders who wish to ensure that smaller timeframe strategies do not conflict with long-term market direction.

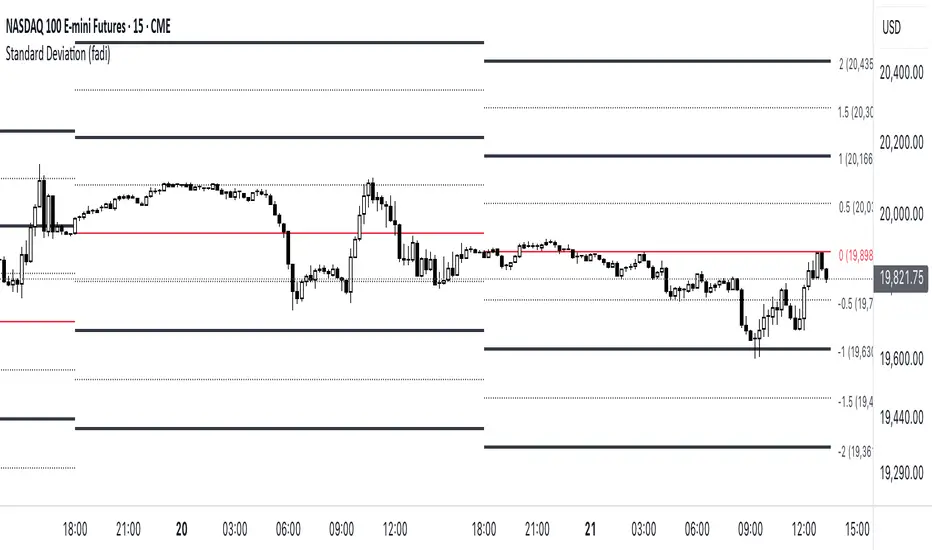
Standard Deviation (fadi)The Standard Deviation indicator uses standard deviation to map out price movements. Standard deviation measures how much prices stray from their average—small values mean steady trends, large ones mean wild swings. Drawing from up to 20 years of data, it plots key levels using customizable Fibonacci lines tied to that standard deviation, giving traders a snapshot of typical price behavior.
These levels align with a bell curve: about 68% of price moves stay within 1 standard deviation, 95% within roughly 2, and 99.7% within roughly 3. When prices break past the 1 StDev line, they’re outliers—only 32% of moves go that far. Prices often snap back to these lines or the average, though the reversal might not happen the same day.
How Traders Use It
If prices surge past the 1 StDev line, traders might wait for momentum to fade, then trade the pullback to that line or the average, setting a target and stop.
If prices dip below, they might buy, anticipating a bounce—sometimes a day or two later. It’s a tool to spot overstretched prices likely to revert and/or measure the odds of continuation.
Settings
Higher Timeframe: Sets the Higher Timeframe to calculate the Standard Deviation for
Show Levels for the Last X Days: Displays levels for the specified number of days.
Based on X Period: Number of days to calculate standard deviation (e.g., 20 years ≈ 5,040 days). Larger periods smooth out daily level changes.
Mirror Levels on the Other Side: Plots symmetric positive and negative levels around the average.
Fibonacci Levels Settings: Defines which levels and line styles to show. With mirroring, negative values aren’t needed.
Background Transparency: Turn on Background color derived from the level colors with the specified transparency
Overrides: Lets advanced users input custom standard deviations for specific tickers (e.g., NQ1! at 0.01296).
Time Marker Pro: Vertical Line at Key Times)Smart Vertical Line at Specific Time (with Timezone, Color, and Width Controls)
This script draws a vertical line on your chart at a user-defined time once per day, based on the selected timezone.
🕒 Key Features:
Set your target hour and minute
Choose from a list of common timezones (Tehran, UTC, New York, etc.)
Customize the line color and thickness
Works across all intraday timeframes (1min, 5min, 15min, etc.)
Adjusts automatically to bar intervals — no need for exact time matching
This is perfect for traders who want to:
Highlight the start of a session
Mark specific news times, breakouts, or routine entries
Visualize key time-based levels on the chart

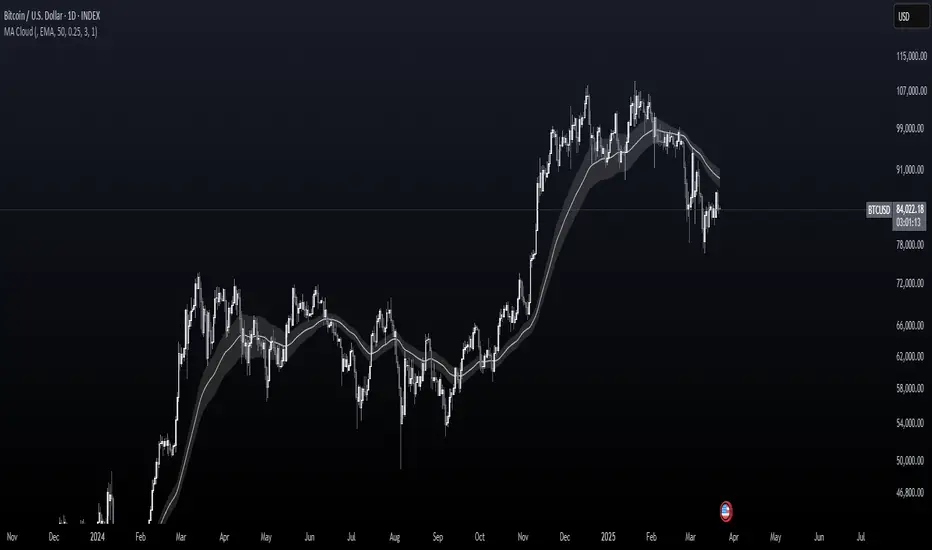
MA CloudThis indicator plots a Moving Average (MA) cloud with ultra-smooth visuals, designed to help traders identify trend direction, momentum, and volatility in a clear and intuitive way.
Features:
Multiple MA types: choose between EMA, SMA, WMA, or RMA
Adaptive cloud width: based on standard deviation of price to visualize volatility
Smoothing controls: post-processed smoothing gives a silky, curved appearance
Multi-Timeframe (MTF) support: default to chart timeframe, or override to any custom timeframe (e.g. 1H, 1D, etc.)
Custom styling: adjustable colours, line thickness, and cloud opacity
Use cases:
Quickly assess trend strength and direction
Use cloud thickness as a volatility proxy
Spot pullback entries during trending conditions
Combine with price action or support/resistance for confluence
Settings:
MA Type – select your preferred moving average method
MA Length – period for the average
Cloud Width Factor – adjusts the distance of the cloud edges
Smoothing Length – softens the output for a polished look
Timeframe – optional override to analyse data from a higher or lower timeframe
Fibonacci Forecast IndicatorThis indicator projects potential price movements into the future based on user-defined Fibonacci-period moving averages. By default, it calculates Simple Moving Averages (SMAs) for the 3, 5, 8, 13, and 21 bars (though you can customize these values). For each SMA, it measures the distance between the current closing price and that SMA, then extends the price forward by the same distance.
Key Features
1. Fibonacci MAs:
- Uses Fibonacci numbers (3, 5, 8, 13, 21) for SMA calculations by default.
- Fully customizable periods to fit different trading styles.
2. Forecast Projection:
- If the current price is above a given SMA, the forecast line extends higher (bullish bias).
- If the current price is below the SMA, the forecast line extends lower (bearish bias).
- Forecast lines are anchored at the current bar and project forward according to the same Fibonacci intervals.
3. Clean Visualization:
- Draws a series of connected line segments from the current bar’s close to each forecast point.
- This approach offers a clear, at-a-glance visual of potential future price paths.
How to Use
1. Add to Chart:
- Simply apply the indicator to any chart and timeframe.
- Adjust the Fibonacci periods and styling under the indicator settings.
2. Interpretation:
- Each forecast line shows where price could potentially head if the current momentum (distance from the SMA) continues.
- When multiple lines are consistently above (or below) the current price, it may reinforce a bullish (or bearish) outlook.
3. Customization:
- You can modify the number of forecast lines, their color, and line width in the inputs.
- Change or add your own Fibonacci periods to experiment with different intervals.
Notes and Best Practices
- Confirmation Tool: This indicator is best used alongside other forms of technical or fundamental analysis. It provides a “what-if” scenario based on current momentum, not a guaranteed prediction.
- Not Financial Advice: Past performance doesn’t guarantee future results. Always practice proper risk management and consider multiple indicators or market factors before making trading decisions.
Give it a try, and see if these Fibonacci-based projections help visualize where price may be headed in your trading strategy!

TR FVG Finder 1.0TR FVG Finder 1.0 - Identify High-Probability Trading Zones
Unlock the power of Fair Value Gaps (FVGs) with this advanced TradingView indicator! Designed for traders seeking high-probability setups, the Fair Value Gap Detector identifies key price imbalances on your chart, helping you spot potential reversal and continuation zones with precision.
Key Features:
Accurate FVG Detection: Automatically detects bullish and bearish Fair Value Gaps based on a proven 3-candle pattern, highlighting areas where price is likely to return.
Customizable Display: Shows the most recent 3 FVGs by default (combined bullish and bearish), with an option to adjust the number of FVGs displayed.
Visual Clarity: Draws semi-transparent boxes (green for bullish FVGs, red for bearish FVGs) that extend 15 candles to the right, making it easy to track key levels.
Versatile for All Markets: Works on any timeframe and instrument—perfect for forex, stocks, crypto, and commodities like XAU/USD (gold).
User-Friendly: Simple to use with customizable settings, ideal for both beginner and experienced traders.
How It Works:
The indicator identifies FVGs by analyzing a 3-candle pattern:
- Bullish FVG: When the high of the candle two bars back is below the low of the current candle.
- Bearish FVG: When the low of the candle two bars back is above the high of the current candle. These gaps often act as magnets for price, making them powerful zones for trading strategies like breakouts, pullbacks, or reversals.
Why Use This Indicator?
- Enhance your technical analysis with a proven concept used by institutional traders.
- Spot high-probability trading opportunities with clear visual cues.
- Save time by automating FVG detection—no manual drawing required.
Best Practices:
- Use on lower timeframes (e.g., 15-minute or 1-hour) for more frequent FVGs, especially in volatile markets like forex or crypto.
- Combine with other indicators (e.g., support/resistance, volume) for confirmation.
- Ideal for strategies like ICT (Inner Circle Trader) concepts, Smart Money trading, and price action analysis.
Regards,
Trader Riaz

matrixx Global Sessions + Good/Premium Spread ZonesSimple (enough) Script that allows you to visualize the major trading sessions, with some QoL stuff, Includes a "Monday Open" bar for reference when zooming out.
By default no one 'session' is turned on; instead, we have;
Good Zone - where spread tends to close up enough for (me) to trade in the 1-minute timezones
Premium Zone - where the tightest spreads tend to happen and I (you?) can get more aggressive with Stop Losses, and moment-to-moment trade accuracy.
The Monday Open - for reference.
You are able to go into the settings and turn these on and off at will, making any combination of 'zones' you prefer, and can colour code them, as well.
Points of Difference;
You can turn on and off any group or set of sessions for an overview;
Additionally, this is coded so that if there is a "Daylight Saving" or other localized timezone shift, it should be reflected correcty, as timezones are calculated based on each sessions' data, not arbitrarily with +/- as most of the other scripts that do similar to this one.
Monday Open
you can toggle sessions, or instead toggle the 'off hour' zones, at will
MTF Fibonacci Pivots with Mandelbrot FractalsMTF Fibonacci Pivots with Mandelbrot Fractals: Advanced Market Structure Analysis
Overview
The MTF Fibonacci Pivots with Mandelbrot Fractals indicator represents a significant advancement in technical analysis by combining multi-timeframe Fibonacci pivot levels with sophisticated fractal pattern recognition. This powerful tool identifies key support and resistance zones while predicting potential price reversals with remarkable accuracy.
Key Capabilities
This indicator provides traders with three distinct layers of market structure analysis:
Automatic Timeframe Adaptation: The primary pivot set automatically adjusts to your chart's timeframe, ensuring relevant support and resistance levels for your specific trading horizon.
1-Year Fibonacci Pivots: The second layer displays yearly pivots that reveal long-term market cycles and institutional price levels that often act as significant reversal points.
3-Year Fibonacci Pivots: The third layer unveils major market structure zones that typically remain relevant for extended periods, offering strategic context for position trading and long-term investment decisions.
Predictive Technology
What truly distinguishes this indicator is its advanced predictive capability powered by:
Mandelbrot Fractal Pattern Recognition: The indicator implements a sophisticated fractal detection algorithm that identifies recurring price patterns across multiple timeframes. Unlike conventional fractal indicators, it incorporates noise filtering and adaptive sensitivity to market volatility.
Tesla's 3-6-9 Principle Integration: The system incorporates Nikola Tesla's mathematical principle through a cubic Mandelbrot equation (Z_{n+1} = Z_n^3 + C where Z_0 = 0), creating a unique approach to pattern recognition that aligns with natural market rhythms.
Historical Pattern Matching: When a current price pattern exhibits strong similarity to historical formations, the indicator generates predictive targets with confidence ratings. Each prediction undergoes rigorous validation against multiple parameters including trend alignment, volatility context, and mathematical coherence.
Visual Intelligence System
The indicator's visual presentation enhances trading decision-making through:
Confidence-Based Visualization: Predictions display with intuitive star ratings, percentage confidence scores, and contextual information including price movement magnitude and estimated time to target.
Adaptive Color Harmonization: The color system intelligently adjusts to provide optimal visibility while maintaining a professional appearance suitable for any chart setup.
Trend Alignment Indicators: Each prediction includes references to the broader trend context, helping traders avoid counter-trend trades unless the reversal signal carries exceptional strength.
Strategic Applications
This indicator excels in multiple trading scenarios:
Intraday Trading: Identify high-probability reversal zones with precise timing
Swing Trading: Anticipate significant market turns at key structural levels
Position Trading: Recognize major cycle shifts for strategic entry and exit
The automatic 1-year and 3-year Fibonacci pivots provide institutional-grade reference points that typically define major market movements. These longer timeframes reveal critical zones that might be invisible on shorter-term analysis, giving you a significant edge in understanding where price is likely to encounter substantial buying or selling pressure.
This innovative approach to market analysis combines classical Fibonacci mathematics with cutting-edge fractal theory to create a comprehensive market structure visualization system that illuminates both present support/resistance levels and future price targets with exceptional clarity.
Setting Up MTF Fibonacci Pivots with Mandelbrot Fractals
Initial Setup
Adding this indicator to your TradingView charts is straightforward:
Navigate to the "Indicators" button on your chart toolbar
Search for "MTF Fibonacci Pivots with Mandelbrot Fractals"
Select the indicator to add it to your chart
A configuration panel will appear with various setting categories
Recommended Settings
The indicator comes pre-configured with optimal default settings, but you may want to adjust them based on your trading style:
For Day Trading (Timeframes 1-minute to 1-hour)
Pivots Timeframe 1: Auto (automatically adapts to your chart)
Pivots Timeframe 2: Daily
Pivots Timeframe 3: Weekly
Fractal Sensitivity: 2-3
Fractal Lookback Period: 20
Prediction Strength: 2
Color Theme: High Contrast or Dark Mode
For Swing Trading (Timeframes 4-hour to Daily)
Pivots Timeframe 1: Daily
Pivots Timeframe 2: Weekly
Pivots Timeframe 3: Monthly
Fractal Sensitivity: 1-2
Fractal Lookback Period: 30
Prediction Strength: 2-3
Color Theme: Default or Dimmed
For Position Trading (Timeframes Daily to Weekly)
Pivots Timeframe 1: Weekly
Pivots Timeframe 2: Monthly
Pivots Timeframe 3: Quarterly
Fractal Sensitivity: 1
Fractal Lookback Period: 50
Prediction Strength: 1
Color Theme: Monochrome or Pastel
Restoring Default Settings
If you've adjusted settings and wish to return to the defaults:
Right-click on the indicator name on your chart
Select "Settings" from the context menu
In the settings dialog, look for the "Reset All" button at the bottom
Confirm the reset when prompted
Alternatively, you can remove the indicator and add it again for a fresh start with default settings.
Advanced Settings Guidance
Visual Appearance
Use Gradient Colors: Enable for better visual differentiation between pivot levels
Color Transparency: 15% provides an optimal balance between visibility and chart clutter
Line Width: 1-2 for cleaner charts, 3+ for enhanced visibility
Fractal Analysis
Enable Fractal Analysis: Keep enabled for prediction capabilities
Fractal Box Spacing: Higher values (5-10) for cleaner displays, lower values (1-3) for more signals
Maximum Forecast Bars: 20 is optimal for most timeframes, adjust higher for longer predictions
Performance Considerations
Enable Self-Optimization: Keep enabled to maintain smooth chart performance
Resource Priority: Use "Balanced" for most computers, "Performance" for older systems
Force Pivot Display: Enable only when checking specific historical periods
Common Setup Mistakes to Avoid
Setting all timeframes too close together (e.g., Daily, Daily, Weekly) reduces the multi-timeframe advantage
Using high fractal sensitivity (4+) on noisy markets creates excessive signals
Setting fractal box spacing too low causes cluttered prediction boxes
Disabling self-optimization may cause performance issues on complex charts
Using incompatible color themes for your chart background reduces visibility
The indicator's power comes from its default 1-year and 3-year Fibonacci pivot settings, which highlight institutional levels while the auto-timeframe setting adapts to your trading horizon. These carefully balanced defaults provide an excellent starting point for most traders.
For optimal results, I recommend making minimal adjustments at first, then gradually customizing settings as you become familiar with the indicator's behavior in your specific markets and timeframes.
Screenshots:

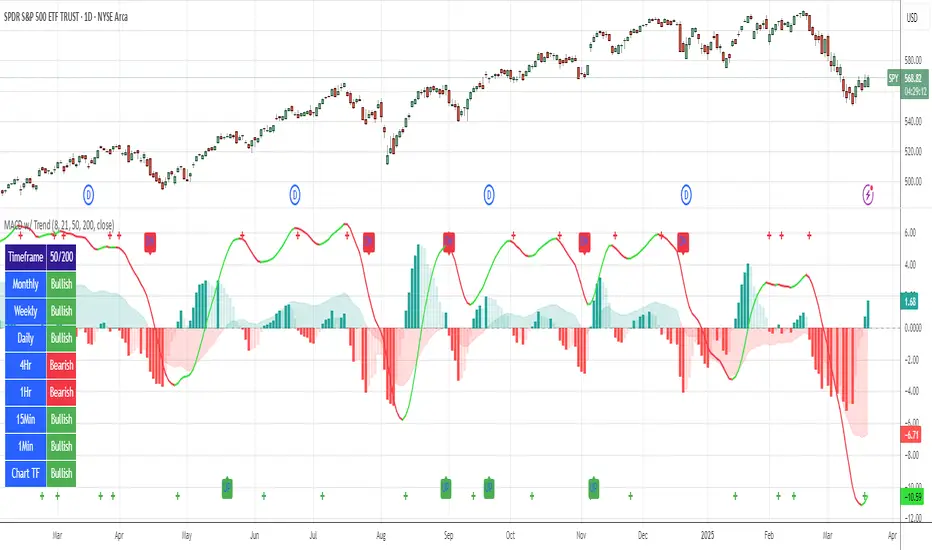
MACD with TrendIndicator Name: MACD with Trend & Multi-Timeframe Dashboard
Why Use This Indicator?
Two MACDs for Double Confirmation:
It integrates both a standard MACD (fast/slow lengths of your choice) and a Trend MACD (longer lengths). The standard MACD identifies short-term momentum shifts, while the Trend MACD helps confirm the higher-level market trend.
Multi-Timeframe 50/200 SMA Overview:
A built-in dashboard quickly shows whether the 50-period moving average is above or below the 200-period moving average across multiple timeframes (Monthly, Weekly, Daily, etc.). At a glance, you can see if higher timeframes agree with your immediate trading setup.
Clear Buy/Sell Signals:
The script plots buy arrows when the MACD histogram crosses from negative to positive, plus an additional label for the Trend MACD crossing. The same goes for sell signals if momentum flips from positive to negative. This clarity can reduce guesswork.
Customizable & Intuitive:
Easily adjust moving average types (SMA or EMA), lengths, and source inputs to suit different asset classes or personal preferences. Visual color coding helps you quickly interpret bullish vs. bearish conditions.
Recommended Trading Approach
Identify Overall Trend
Check the Trend MACD histogram and the multi-timeframe dashboard (50/200 SMAs). If you see bullish alignment on higher timeframes (e.g., Daily, Weekly) and the Trend MACD is above zero, you know the market environment is supportive for long trades.
Pinpoint Entry Using Standard MACD
Wait for the standard MACD histogram to cross above zero or for a labeled “Buy Signal.” This indicates short-term momentum turning bullish in sync with the broader trend. If the market is already trending up (confirmed by the dashboard), the probability of a successful long entry often improves.
Set a Stop-Loss & Take-Profit
While not included in the code, adding an ATR- or price-based stop-loss can protect against sudden reversals. A simple approach is risking 1–2% per trade and aiming for a 1.5–2× reward relative to that risk.
Monitor Sell Signals
If the short-term MACD crosses below zero—triggering a “Sell Signal”—and the Trend MACD also turns down (or the dashboard flips bearish), consider exiting the position or tightening stops. This alignment of short- and long-term indicators often signals a shift in momentum that could threaten your open profits.
Summary
The MACD with Trend & Multi-Timeframe Dashboard is a versatile, all-in-one toolkit. It combines the immediacy of short-term MACD signals, the validation of a longer-term trend oscillator, and the broader insight of multi-timeframe moving averages. Whether you are a swing trader looking for alignment across bigger trends or a shorter-term trader wanting clear momentum triggers, this indicator helps streamline decision-making and reduce noise.
Disclaimer: As with all technical analysis tools, there is no guarantee of success. Always combine indicator signals with sound risk management and a thorough understanding of market conditions
Multi-Timeframe Stochastic RSI ArrowsMulti-Timeframe Stochastic RSI Arrows Indicator by The Venetian
Dear Moderators before you torch me alive theres nothing groundbreaking just very handy indicator for some users.
This indicator provides traders with a jet fighter-style heads-up display for market momentum across multiple timeframes. By displaying Stochastic RSI directional arrows for 12 different timeframes simultaneously, it offers a comprehensive view of market conditions without requiring multiple chart windows.
How It Works
The indicator calculates the Stochastic RSI for each of 12 common timeframes (1m to 3M) and represents directional movements with intuitive arrows:
- ▲ Green up arrow = Rising momentum
- ▼ Red down arrow = Falling momentum
- ◄► Yellow horizontal arrows = Flat/sideways momentum
- ► Gray right arrow = Just peaked (crossed above overbought)
- ◄ Gray left arrow = Just bottomed (crossed below oversold)
Each timeframe's status appears with its label (e.g., "1m ▲") in a clean, vertically-stacked display using ATR-based spacing to maintain consistent visual appearance regardless of price scale.
Key Features
- ATR-Based Spacing : Uses Average True Range to maintain consistent distances between labels even as chart scale changes
- Multi-Timeframe Analysis: Easily spot divergences and confluences across timeframes (1m, 3m, 5m, 15m, 30m, 1h, 2h, 4h, 1D, 1W, 1M, 3M)
- Sensitivity Control: Adjust flat detection sensitivity to filter out noise
- Customisable Appearance: Modify arrow size, vertical spacing, and show/hide timeframe labels
- Overbought/Oversold Detection: Highlights when momentum has peaked or bottomed at extreme levels
- Trading Applications
- Trend Alignment: Quickly identify when multiple timeframes align in the same direction
- Divergence Detection: Spot when shorter timeframes begin to shift against longer ones
- Entry/Exit Timing: Use crossovers of significant timeframes as potential signals
- Market Context: Maintain awareness of the bigger picture while trading shorter timeframes
This indicator doesn't break new ground technically but excels in presenting complex multi-timeframe information in a clean, actionable format — much like a pilot's heads-up display provides critical information at a glance. The ATR-based positioning ensures consistent visibility across different instruments and market conditions.
Great effort has been made for this script to adhere to TradingView's Pine Script house rules and focuses on trader usability rather than introducing novel technical concepts.
