Change of Character FanChange of Character Fan
Overview
The Change of Character Fan is designed to help traders detect shifts (changes of character) in market direction and sentiment before they become fully visible through traditional candlestick analysis. Instead of relying solely on the shape or close of candlesticks, this indicator offers a direct, real-time look at the internal price action occurring within a single bar. This visibility into intrabar dynamics can potentially allow traders to enter or exit trades earlier, minimize false signals, and reduce their dependence on multiple lower-timeframe charts.
How it Works:
The indicator plots a "fan" consisting of five distinct slope lines within the current bar. Each line represents the internal trend of price movement based on user-defined lower timeframe data intervals.
By default, these intervals are set to 3, 5, 8, 13, and 21 samples from 1-second timeframe data.
Each line only appears when it has collected the minimum required number of intrabar data points.
The fan lines use a progressive opacity scale (lighter to darker), visually highlighting the confidence level or probability of directional continuation within the current bar.
At the open of every new bar, the fan disappears completely and gradually reappears as new data is gathered, ensuring clarity and eliminating outdated signals.
Understanding the Mathematics: Linear Regression Model
This indicator is built around the concept of a linear regression model. Linear regression is a statistical technique used to model and analyze relationships between variables—in this case, time (independent variable) and price (dependent variable).
How Linear Regression Works:
Linear regression fits a straight line (called a "line of best fit") through a set of data points, minimizing the overall distance between each point and the line itself.
Mathematically, this is achieved by minimizing the squared differences (errors) between the observed values (actual prices) and the predicted values (prices on the line).
The linear model used here can be expressed in the form:
y = mx + b
where:
𝑦
y is the predicted price,
𝑥
x represents time (each data sample interval),
𝑚
m is the slope of the line, representing the direction and velocity of the trend,
𝑏
b is the intercept (the theoretical price when x=0).
Why a Linear Model is Beneficial in this Indicator:
Simplicity and Reliability: Linear regression is simple, robust, and widely accepted as a baseline predictive model. It requires minimal computational resources, providing instant updates in real-time trading conditions.
Immediate Directional Feedback: The slope derived from linear regression immediately communicates the directional tendency of recent price action. A positive slope indicates upward pressure, and a negative slope signals downward pressure.
Noise Reduction: Even when price fluctuations are noisy or erratic, linear regression summarizes overall direction clearly, making it easier to detect genuine directional shifts (change of character) rather than random price noise.
Intrabar Analysis: Traditional candlestick analysis relies on fully formed candles, potentially delaying signals. By using linear regression on very short-term (intrabar) data, traders can detect shifts in momentum more quickly, providing an earlier signal than conventional candle patterns alone.
Practical Application:
This indicator helps traders to visually identify:
Early Trend Reversals: Intrabar analysis reveals momentum shifts potentially signaling reversals before they become obvious on conventional candles.
Momentum Continuations: Confidence is gained when all lines in the fan are clearly pointing in the same direction, indicating strong intrabar conviction.
Reduced False Signals: Traditional candlestick signals (e.g., hammer candles) sometimes produce false signals due to intrabar noise. By looking directly into intrabar dynamics, traders gain better context on whether candle patterns reflect genuine directional change or merely noise.
Important Requirements and Recommendations:
Subscription Requirements:
A TradingView subscription that supports sub-minute data (e.g., 1-second or 5-second resolution) is strongly recommended.
If your subscription doesn't include this data granularity, you must use a 1-minute lower timeframe, significantly reducing responsiveness. In this scenario, it's best suited for a 15-minute or higher chart, adjusting intervals to shorter periods.
Live Data Essential:
Real-time market data subscription is essential for the accuracy and effectiveness of this indicator.
Using delayed data reduces responsiveness and weakens the indicator's primary advantage.
Recommended Settings for Different Chart Timeframes:
1-minute chart: Use 1-second lower timeframe intervals (default intervals: 3, 5, 8, 13, 21).
5-minute chart: Adjust to a 5- or 10-second lower timeframe, possibly reducing intervals to shorter periods (e.g., 3, 5, 8, 10, 12).
15-minute or higher charts: Adjust lower timeframe to 1-minute if granular data is unavailable, with reduced interval lengths to maintain responsiveness.
Conclusion:
The Change of Character Fan empowers traders with early insight into directional shifts within each candle, significantly enhancing reaction speed, signal accuracy, and reducing dependency on multiple charts. Built on robust linear regression mathematics, it combines clarity, responsiveness, and ease-of-use in a powerful intrabar analysis tool.
Trade smarter, see sooner, and react faster.
Multitimeframe

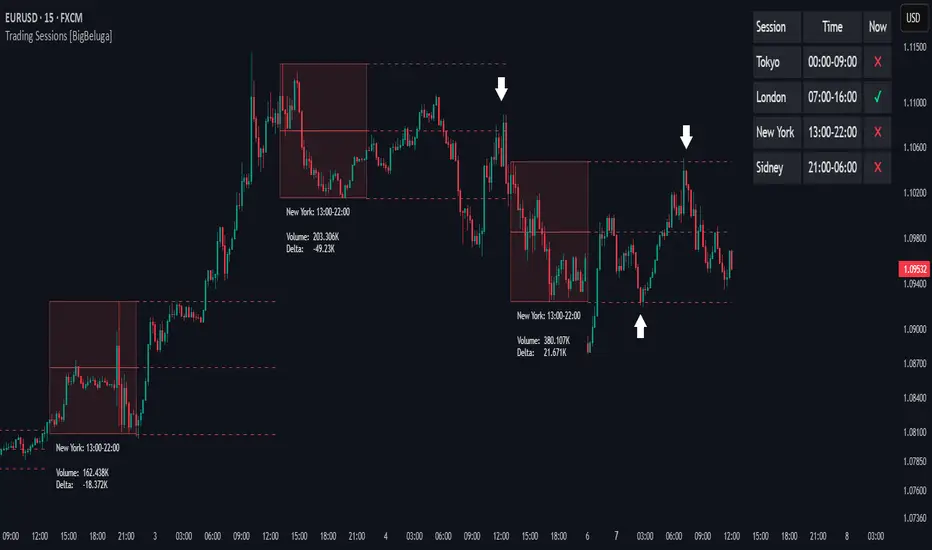
Trading Sessions [BigBeluga]
This indicator brings Smart Money Concept (ICT) session logic to life by plotting key global trading sessions with volume and delta analytics. It not only highlights session ranges but also tracks their midpoints — which often act as intraday support/resistance levels.
🔵 KEY FEATURES
Visual session boxes: Plots boxes for Tokyo, London, New York, and Sydney sessions based on user-defined UTC+0 time ranges.
Volume & delta metrics: Displays total volume and delta volume (buy–sell difference) within each session.
Mid, High & Low Range Extension: Once a session ends, the high, low, and midpoint levels automatically extend — ideal for detecting SR zones.
Session labels: Each box includes a label with session name, time, volume, and delta for quick reference.
Custom session control: Enable or disable sessions individually and configure start/end times.
Clean aesthetics: Transparent shaded boxes with subtle borders make it easy to overlay without clutter.
Sessions Dashboard: Shows the time range of each session and tells you whether the session is currently active.
🔵 USAGE
Enable the sessions you want to monitor (e.g., New York or Tokyo) from the settings.
Use session volume and delta values to gauge the strength and direction of institutional activity.
Watch for price interaction with the extended range — it often acts as dynamic support/resistance after the session ends.
Overlay it with liquidity tools or breaker blocks for intraday strategy alignment.
🔵 EXAMPLES
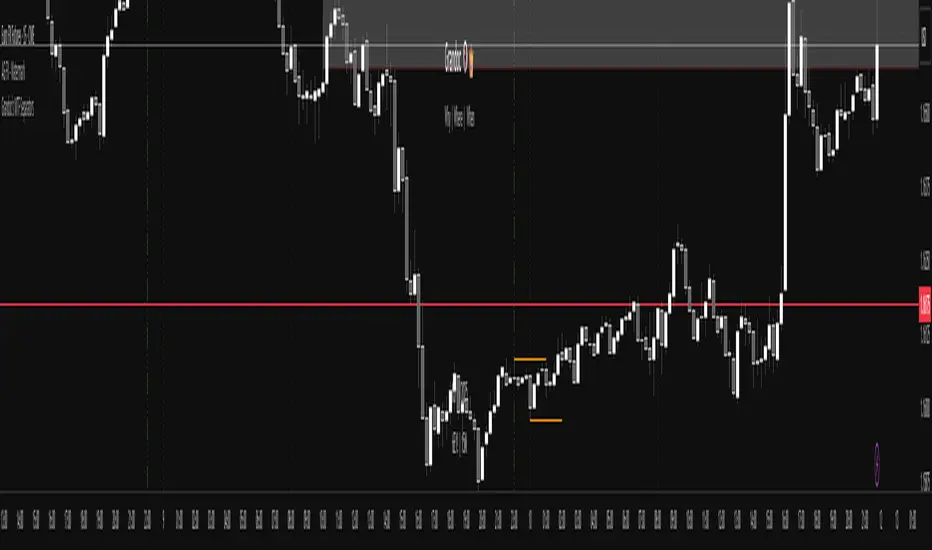
Extended Future Range acted as resistance/support.
Delta value helped confirm bullish pressure during New York open.
Multiple sessions helped identify kill zone overlaps and high-volume turns.
Trading Sessions is more than just a visual scheduler — it's a precision tool for traders who align with session-based volume dynamics and ICT methodology. Use it to define high-probability zones, confirm volume shifts, and read deeper into the true intent behind market structure.
No Trading ZoneNo trading zone
This indicator highlights the time range between 03:00 and 11:00 UTC as a "danger zone" for trading.
Based on data-driven backtesting, this period consistently showed:
- High frequency of moving average (MA) crossovers without meaningful trend
- A high concentration of sideways market conditions
- Increased likelihood of false breakouts and stop-loss hunting
On average, strong directional trends tend to emerge after 12:00 UTC, especially between 12:00–15:00 UTC.
Avoiding trades during this time zone can help reduce exposure to low-probability setups and enhance strategy reliability.

Key Trading Session Times (UK) with DST AdjustTradingView Pine Script for London Killzone with DST Adjustment
What This Script Does:
This script highlights three important trading sessions on the chart:
Asia Session (12:00 AM – 6:00 AM UK)
London Session (6:30 AM – 9:00 AM UK)
New York Session (1:00 PM – 3:00 PM UK)
It will highlight these sessions using background colors, and it automatically adjusts the session times for Daylight Saving Time (DST).

Bijnor Pivot ExtendedOverview: The Bijnor Pivot Extended (BP+) indicator is a powerful visual tool designed to help traders identify key price levels using Fibonacci-based pivots. It dynamically plots Support and Resistance levels based on your chosen timeframe (Daily, Weekly, or Monthly) and displays them only for the current session, reducing chart clutter and improving focus.
🔧 Features:
📆 Pivot Timeframe Selection: Choose between Daily, Weekly, or Monthly pivots.
🎯 Fibonacci Pivot Levels:
Central Pivot (P)
Resistance: R1, R2, R3, R4 (Extended)
Support: S1, S2, S3, S4 (Extended)
🎨 Full Customization:
Toggle labels and prices on/off
Position labels to the left or right
Change line width and individual colors for pivot, support, and resistance lines
🧠 Smart Line Plotting:
Lines are drawn only during the selected session, keeping your chart clean
🕹️ Max Performance: Optimized to stay lightweight with max_lines_count and max_labels_count set to 500
🧭 How to Use It:
Use this indicator to:
Plan entries and exits around key Fibonacci pivot zones
Identify overbought/oversold zones at R3/R4 and S3/S4
Enhance your intraday, swing, or positional trading setups
Combine with price action, candlestick patterns, or volume for maximum edge.
✅ Bonus:
This script is ideal for traders looking for a minimalist yet powerful pivot framework, with extended levels for breakout or reversal scenarios.

Daily Forex Market Zones (IST)📈 Script Description: Market Range Zones (5:30 AM–7:30 AM & 7:00 PM–9:00 PM)
This custom Pine Script highlights two key time-based range zones on the chart:
🕔 Morning Range (5:30 AM – 7:30 AM)
🔹 Helps identify the early market structure and potential breakout levels.
🔹 Useful for traders who track early volatility and pre-London session setups.
🌆 Evening Range (7:00 PM – 9:00 PM)
🔹 Captures the price consolidation or movements during late market hours.
🔹 Helpful for traders who look for end-of-day or Asian session setups.
✅ Both ranges are displayed with custom visuals (boxes or lines) for quick reference.
✅ Supports intraday trading strategies like breakout, fakeout, and range-retest entries.
✅ Time zones are adjustable depending on your broker/server time settings.

Attrition Scalper - MTF# Attrition Scalper MTF Update
## What's Changed
Compared to previous Attrition Scalper versions, the channel and lines are now calculated using multi-timeframe (MTF) confluence with weighted averages.
The indicator is updated to PineScript V6.
I've removed redundant logic, inefficient buy/sell and high/low signals, and linear regression calculations to create a cleaner, more streamlined version that's both easier to use and provides a better foundation for future developments.
Using these lines every day has quickly made me realize that one line in one timeframe is usually in confluence with another line in another timeframe, and that price zone is usually much more reliable as a proper support/resistance or a mean reversion scalp zone.
The new logic checks one timeframe lower and one timeframe higher than the current timeframe the user is viewing and performs a weighted average calculation of 0.618 × lower TF + 1.0 × current TF + 0.786 × higher TF before plotting the lines.
Timeframes higher than weekly or lower than 5 minutes don't use MTF and instead just show the normal lines and the channel for that single timeframe similar to previous Attrition Scalper V2.
## Understanding the Lines
The Attrition Scalper generates several key reference lines that can help identify trade opportunities:
### Primary Reference Lines
- **Middle VIDYA and EVWMA (Middle Band)**: Usually represents the "mean" or equilibrium price. Price tends to gravitate back to this area during consolidation.
- **Green/Red VIDYA Lines**: These color-changing lines are your higher priority/reliable support/resistance levels.
### Fibonacci Extension Lines
- **Blue Lower Fibonacci Lines (0.618, 1.618, 2.618)**: Secondary support/resistance zones. While less significant than the VIDYA lines, these still provide valuable reference points for potential bounces.
- **Yellow 4.236 Fibonacci Lines**: These represent significant price overextension. When price reaches or exceeds these levels, expect a mean reversion move soon. These are the highest trust lines.
## Trading Applications
### Overextension & Mean Reversion
When price pushes above/below the yellow 4.236 Fibonacci line:
- This indicates an overextended market condition
- Probability of mean reversion increases significantly
- Consider counter-trend positions back toward the middle band
- Set targets near the middle VIDYA/EVWMA lines
- Higher timeframes = Higher reliability
- Don't panic and trust the process
### Support & Resistance Trading
- **Primary S/R Zones (Green/Red VIDYA)**: These are your highest probability bounce/rejection points. Pay special attention when price approaches these levels, especially on the first test.
- **Secondary S/R Zones (Blue Fib Lines)**: Use these as supplementary confirmation or for tighter stop placement or basic entries/TPs when laddering in and out.
## Best Practices
1. **Wait for Candle Close**: Trading signals are most reliable after a candle has fully closed above/below significant lines. Don't just take an instant long/short position when price goes above/below the outer yellow 4.236 fib line; wait for confirmation and candle close. Don't be sad if you miss an opportunity just because you waited—it's better this way in the long run.
2. **Respect Momentum**: Don't fight strong momentum just because price reached a line; wait for signs of reversal. Price almost always retraces, but it can be a small retracement only to inside the channel instead of going all the way back to the mean if the market is trending, OR it can stay overextended for an extended period of time (usually few candles max though). Sudden spikes all the way to the overextended zone are almost always a better position to take as a mean reversion play compared to long drawn out single direction trends. Don't fight the trend; take very small quick scalps given the opportunity.
3. **Use Confirmation Combined with Volume**: Look for rejection candles, engulfing patterns, or double tops/bottoms at key levels before entering. Strong volume at key lines increases the probability of a meaningful reaction. For example, at the end of an uptrend, if you see the price has spiked and is now overextended (out of the channel and above all the lines) and you see volume also spiking, that's almost always the top, at least for a while.
5. **Consider Volatility**: During high volatility, price may overshoot lines a lot (although very rare) before reversing; be patient and wait for confirmation. It could also be a news event, so always check before entering a position.

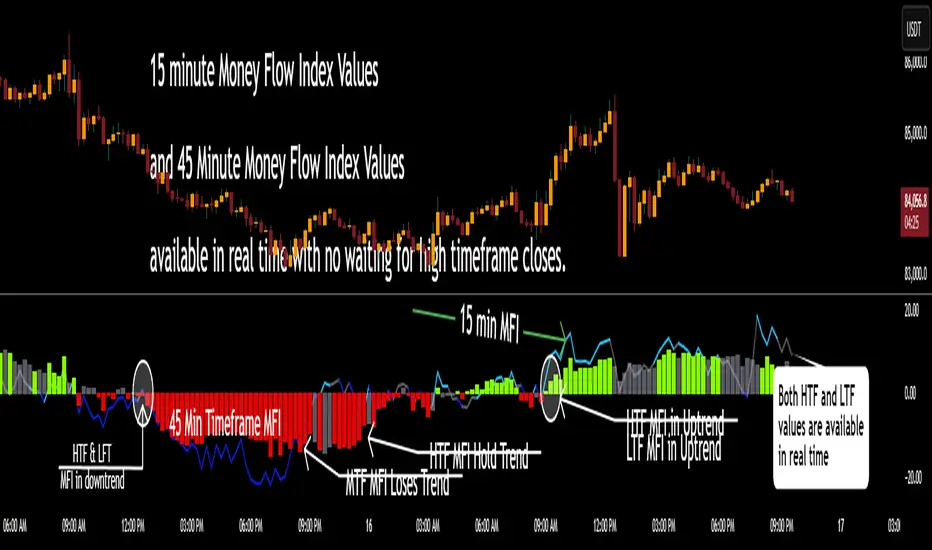
Multi Timeframe Altered Money Flow Index by CoffeeShopCryptoMoney Flow Index is a long used tool in trading markets, understanding to where money is moving and most importantly when its going there.
One of the biggest challenges was the when part. Because seeing it on your current trading chart timeframe is easy but it gets difficult if youre attempting a top-down-analysis of market structure vs price performance.
The new formula presented by @CoffeeshopCrypto is a key solution to this timeframe analysis issue. Seems like I may have solved the "glitch-In-The-Matrix".
The issue was always setting a secondary MFI on your chart and telling the system you wanted to watch the 1 hour MFI from a 5 minute chart.
To do this you need to wait for 12 candles to close on your 5 minute chart before you can get a 1hour MFI value. The move may have already happend and you may be too late. If there was only a better faster way to see the changing values of the High Timeframe Money Flow Index in real time without changing chart times and losing place......oh wait.....there is one now!
This tool allows you to tell it what timeframe you are looking at,
and what you want to compare it to.
It runs the calculation in the background automatically to give you the real time values of your High Timeframe chart setting on the chart you are looking at.
How to trade Long
When both the LFT and HTF Money flow cross above ZERO, they are both in uptrend
How to trade Short
When both the LFT and HTF Money flow cross below ZERO, they are both in downtrend
What happens when Low timeframe is inside the high timeframe:
If High timeframe MFI is below zero but the LFT MFI is above it and still below zero, you have lost your short term downtrend. The opposite is true when the high timeframe MFI is above zero.
A strong constant comparative trend is when your low timeframe MFI is leading your High timeframe MFI.
Personal Settings:
In my usage, i find it best to multiply my trading chart timeframe by 3 and use that number as my high timeframe MFI setting
This works on ANY chart time you want. For example you are not locked to the standard built TradingView chart times.
If you trade on a 7 minute timeframe, you can set your HTF to 21.
7 * 3 = 21
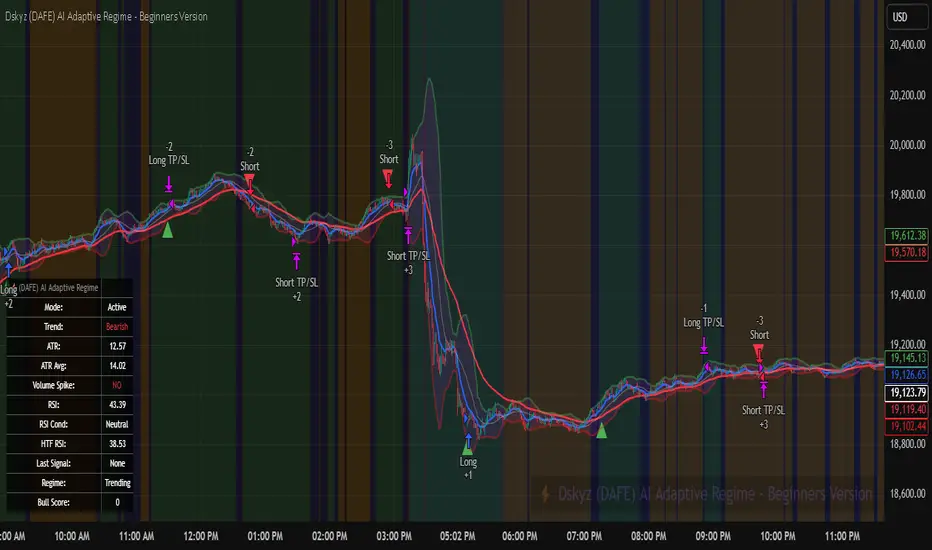
Dskyz (DAFE) AI Adaptive Regime - Beginners VersionDskyz (DAFE) AI Adaptive Regime - Pro: Revolutionizing Trading for All
Introduction
In the fast-paced world of financial markets, traders need tools that can keep up with ever-changing conditions while remaining accessible. The Dskyz (DAFE) AI Adaptive Regime - Pro is a groundbreaking TradingView strategy that delivers advanced, AI-driven trading capabilities to everyday traders. Available on TradingView (TradingView Scripts), this Pine Script strategy combines sophisticated market analysis with user-friendly features, making it a standout choice for both novice and experienced traders.
Core Functionality
The strategy is built to adapt to different market regimes—trending, ranging, volatile, or quiet—using a robust set of technical indicators, including:
Moving Averages (MA): Fast and slow EMAs to detect trend direction.
Average True Range (ATR): For dynamic stop-loss and volatility assessment.
Relative Strength Index (RSI) and MACD: Multi-timeframe confirmation of momentum and trend.
Average Directional Index (ADX): To identify trending markets.
Bollinger Bands: For assessing volatility and range conditions.
Candlestick Patterns: Recognizes patterns like bullish engulfing, hammer, and double bottoms, confirmed by volume spikes.
It generates buy and sell signals based on a scoring system that weighs these indicators, ensuring trades align with the current market environment. The strategy also includes dynamic risk management with ATR-based stops and trailing stops, as well as performance tracking to optimize future trades.
What Sets It Apart
The Dskyz (DAFE) AI Adaptive Regime - Pro distinguishes itself from other TradingView strategies through several unique features, which we compare to common alternatives below:
| Feature | Dskyz (DAFE) | Typical TradingView Strategies|
|---------|-------------|------------------------------------------------------------|
| Regime Detection | Automatically identifies and adapts to **four** market regimes | Often static or limited to trend/range detection |
| Multi‑Timeframe Analysis | Uses higher‑timeframe RSI/MACD for confirmation | Rarely incorporates multi‑timeframe data |
| Pattern Recognition | Detects candlestick patterns **with volume confirmation** | Limited or no pattern recognition |
| Dynamic Risk Management | ATR‑based stops and trailing stops | Often uses fixed stops or basic risk rules |
| Performance Tracking | Adjusts thresholds based on past performance | Typically static parameters |
| Beginner‑Friendly Presets | Aggressive, Conservative, Optimized profiles | Requires manual parameter tuning |
| Visual Cues | Color‑coded backgrounds for regimes | Basic or no visual aids |
The Dskyz strategy’s ability to integrate regime detection, multi-timeframe analysis, and user-friendly presets makes it uniquely versatile and accessible, addressing the needs of everyday traders who want professional-grade tools without the complexity.
-Key Features and Benefits
[Why It’s Ideal for Everyday Traders
⚡The Dskyz (DAFE) AI Adaptive Regime - Pro democratizes advanced trading by offering professional-grade tools in an accessible package. Unlike many TradingView strategies that require deep technical knowledge or fail in changing market conditions, this strategy simplifies complex analysis while maintaining robustness. Its presets and visual aids make it easy for beginners to start, while its adaptive features and performance tracking appeal to advanced traders seeking an edge.
🔄Limitations and Considerations
Market Dependency: Performance varies by market and timeframe. Backtesting is essential to ensure compatibility with your trading style.
Learning Curve: While presets simplify use, understanding regimes and indicators enhances effectiveness.
No Guaranteed Profits: Like all strategies, success depends on market conditions and proper execution. The Reddit discussion highlights skepticism about TradingView strategies’ universal success (Reddit Discussion).
Instrument Specificity: Optimized for futures (e.g., ES, NQ) due to fixed tick values. Test on other instruments like stocks or forex to verify compatibility.
📌Conclusion
The Dskyz (DAFE) AI Adaptive Regime - Pro is a revolutionary TradingView strategy that empowers everyday traders with advanced, AI-driven tools. Its ability to adapt to market regimes, confirm signals across timeframes, and manage risk dynamically. sets it apart from typical strategies. By offering beginner-friendly presets and visual cues, it makes sophisticated trading accessible without sacrificing power. Whether you’re a novice looking to trade smarter or a pro seeking a competitive edge, this strategy is your ticket to mastering the markets. Add it to your chart, backtest it, and join the elite traders leveraging AI to dominate. Trade like a boss today! 🚀
Use it with discipline. Use it with clarity. Trade smarter.
**I will continue to release incredible strategies and indicators until I turn this into a brand or until someone offers me a contract.
-Dskyz
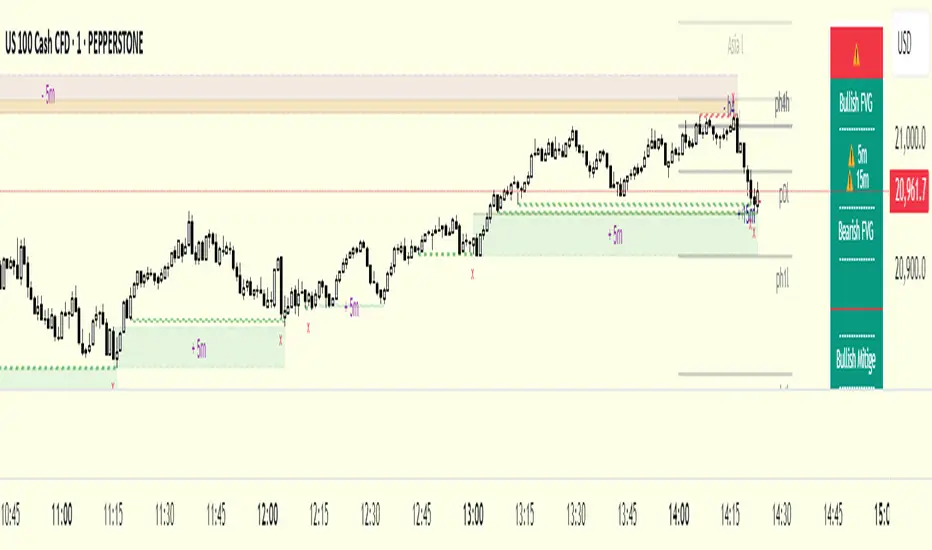
cd_full_poi_CxOverview
This indicator tracks the price in 16 different time frames (optional) in order to answer the question of where the current price has reacted or will react.
It appears on the chart and in the report table when the price approaches or touches the fvg or mitigations (order block / supply-demand), the rules of which will be explained below.
In summary, it follows the fvg and mitigations in the higher timeframe than the lower timeframe.
Many traders see fvg or mitigates as an point of interest and see the high, low swept in those zones as a trading opportunity. Key levels, Session high/lows and Equal high and lows also point of interest.
If we summarise the description of the point of interest ;
1- Fair value gaps (FVG) (16 time frames)
2- Mitigation zones (16 time frames)
3- Previous week, day, H4, H1 high and low levels
4- Sessions zones (Asia, London and New York)
5- Equal high and low levels are in indicator display.
Details:
1- Fair Value Gaps : It is simply described as a price gap and consists of a series of 3 candles. The reaction of the price to the gap between the 1st and 3rd candle wicks is observed.
The indicator offers 3 options for marking. These are :
1-1- ‘Colours are unimportant’: candle colours are not considered for marking. Fvg formation is sufficient.(Classical)
1-2- ‘First candle opposite colour’ : when a price gap occurs, the first candle of a series of 3 candles must be opposite.
For bullish fvg : bearish - bullish - free
For Bearish fvg : bullish - bearish - free
1-3- ‘All same colour’ : all candles in a series of 3 candles must be the same direction.
For bullish fvg: bullish - bullish - bullish
For bearish fvg : bearish - bearish – bearish
Examples:
2- Mitigation zones: Opposite candles with a fvg in front of them or candles higher/lower than the previous and next candle and with the same colour as the fvg series are marked.
Examples :
3- Previous week, day, H4, H1 high and low levels
4- Sessions regions (Asia, London and New York)
5- Equal high and low levels:
Annotation: Many traders want to see a liquidity grab on the poi, then try to enter the trade with the appropriate method.
Among the indicators, there is also the indication of grabs/swepts that occur at swing points. It is also indicated when the area previously marked as equal high/low is violated (grab).
At the end, sample setups will be shown to give an idea about the use of the indicator.
Settings:
- The options to be displayed from the menu are selected by ticking.
- 1m, 2m, 3m, 5m, 5m, 10m, 15m, 30m, h1, h4, h4, h6, h8, h12, daily, weekly, monthly and quarterly, 16 time zones in total can be displayed.
- The ‘Collapse when the price touches mitigate’ tab controls whether to collapse the box as the price moves into the inner region of the mitigate. If not selected, the size of the mitigate does not change.
- ‘Approach limit =(ATR / n)’ tab controls how close the price is to the fvg or mitigate. Instant ATR(10) value is calculated by dividing by the entered ‘n’ value.
- All boxes and lines are automatically removed from the screen when the beyond is closed.
- Colour selections, table, text features are controlled from the menu.
- Sessions hours are set as standard hours, the user can select special time zones. Timezone is set to GMT-4.
- On the candle when the price touches fvg or mitigate, the timeframe information of the POI is shown in the report table together with the graphical representation.
The benefits and differences :
1- We can evaluate the factors we use for setup together.
2- We are aware of what awaits us in the high time frame in the following candles.
3- It offers the user the opportunity to be selective with different candle selection options in fvg selection.
4- Mitige areas are actually unmitige areas because they have a price gap in front of them. The market likes to retest these areas.
5- Equal high/low zones are the levels that the price creates to accumulate liquidity or fails to go beyond (especially during high volume hours). Failure or crossing of the level may give a reversal or continuation prediction.
Sample setup 1:
Sample setup 2:
Sample setup 3:
Cheerful trades…
Enjoy…
Ethergy ChronosThe Ethergy Chronos indicator displays major time-based pivot points such as:
Monthly, weekly and daily - previous highs, previous lows, and current opens.
It also displays the separators for each month, week and day.
What makes it original is the fact that it is completely TIME-ZONE customizable, meaning that all specified pivots and separators are calculated and displayed according to the time-zone set.
For instance, if -4 UTC is selected, and the user chart is set to NY time as a default, all mentioned pivots and separators will reference 00:00 (midnight), months will start on the first Monday of that month at 00:00, weeks will start on Monday at 00:00 and daily will follow the same logic. if time-zone is set to -5 UTC then it will be at 01:00 and so forth.
Enjoy.
Ethergy

Multi-Timeframe RSIMultiple Time Frame RSI (1 minute, 5 minute, 1 hour, 4 hour, 1 day)
Background Gradient Colouring with Custom Threshold Levels for Sensitivity
Ability to Choose Time Frames
Higher timeframes are only plotted when they are above 60 or below 20.

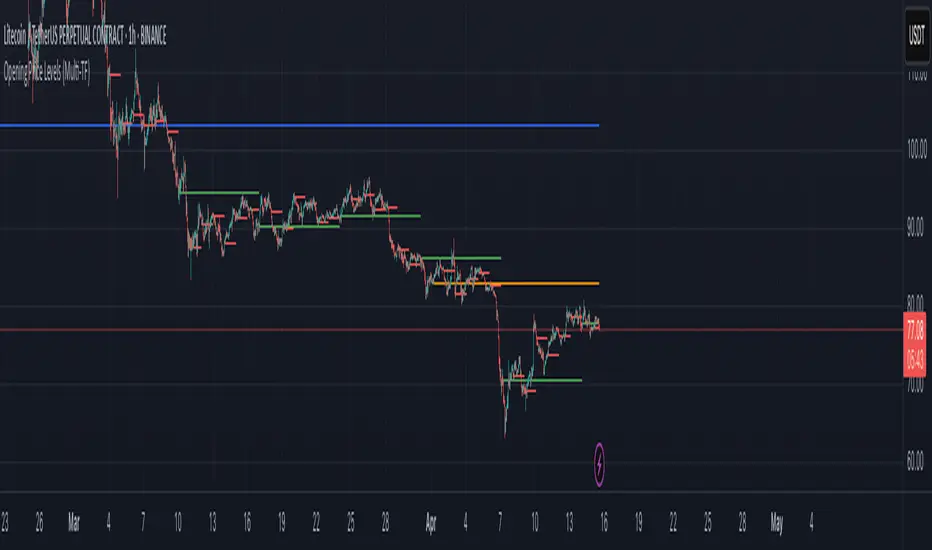
Opening Price LevelsOpening Price Levels
This simple and effective indicator automatically draws horizontal lines at the opening price of each major period:
Year
Quarter
Month
Week
Day
Each line extends until the end of its respective period, helping you quickly identify and react to key institutional price levels and market structure shifts.
🔧 Features:
Toggle visibility for each timeframe (Year, Quarter, Month, Week, Day)
Clean visual presentation using plot.style_linebr, ensuring no overlapping or vertical jumps
Automatically adapts to your chart’s timeframe and session settings
This tool is great for both discretionary and systematic traders who want to add more context and structure to their analysis.

Opening Price Levels (by Period)This indicator draws clean horizontal lines at the opening prices of key time periods: Year, Quarter, Month, Week, and Day.
Each line is plotted only within its own time range, so there's no visual clutter or vertical jumps between periods.
Perfect for traders who want to:
Identify and react to institutional levels.
Track price behavior relative to major opens.
Keep charts clean and easy to read.
Features:
✅ Toggle visibility for each period (Year, Quarter, Month, Week, Day).
🎯 Accurate open levels, aligned with your chart's timeframe and session settings.
✨ Clean segments — each line only spans its original period.
Triple StochasticTriple Stochastic Elasticity Indicator
This custom indicator leverages the power of multi-timeframe analysis by combining three Stochastic Oscillators across different timeframes to identify potential trade entries based on elasticity and divergence between momentum curves.
📊 How It Works:
The indicator plots Stochastic values from three timeframes (e.g., 5m, 15m, and 1h), allowing you to observe how momentum behaves at different scales.
It highlights moments of elasticity—where the Stochastics stretch apart and then begin to converge—potentially signaling a reversion opportunity or trend continuation.
By identifying these stretches and snapbacks in momentum alignment, you can better time your entries and exits with improved confidence.
🔍 Use Case:
Look for divergence or convergence between the Stochastics.
Ideal for trend-following entries, pullback setups, and momentum reversal spotting.
Works best when combined with price action, S/R zones, or volume confirmation.
🛠 Customization:
Timeframes for each Stochastic are fully customizable.
Options to tweak %K, %D, and smoothing values to fit your strategy.
I recommend to remove the D%
And set the following settings
5 : 3 : 3
14 : 3 : 3
56 : 12 :12
Visual alerts can be added for when certain conditions are met (e.g., all three Stochs cross overbought/oversold levels).
Alpha Conviction Engine PRO: 70% ConfluenceOnly fires signals when 70%+ of key strategies align
Includes both bullish and bearish logic across:
MA crossover & pullbacks (50/200)
Fibonacci retracements
Bollinger Band breakout/reversion
Volume Profile structure (POC, VAH, VAL)
ATR breakouts
Quant-style conviction (volume spikes, range expansion)
Liquidity Sweep with EMAThis Pine Script indicator helps traders identify potential market reversals based on liquidity sweeps, where the price moves through the previous candle's low or high and then closes above or below the previous candle's wick. These are often seen as significant market moves or liquidity grabs before a potential reversal or continuation.
The indicator is also equipped with an EMA (Exponential Moving Average) as an optional visual aid to give traders a sense of the prevailing trend, though it is not used as part of the signal generation logic.
Key Features:
Liquidity Sweep Detection:
Bullish Sweep: Triggered when the current candle sweeps below the low of the previous candle and then closes above the high of the previous candle. This indicates a potential market reversal to the upside after the liquidity sweep.
Bearish Sweep: Triggered when the current candle sweeps above the high of the previous candle and then closes below the low of the previous candle. This indicates a potential market reversal to the downside after the liquidity sweep.
EMA:
The EMA (50) is plotted on the chart for visual trend guidance. While it is not used to confirm the signals, it can help traders see if the market is in a general uptrend or downtrend.
Signal Presentation:
Buy Signal: The indicator will plot a green upward arrow below the candle when a bullish liquidity sweep is detected.
Sell Signal: The indicator will plot a red downward arrow above the candle when a bearish liquidity sweep is detected.
Timeframe Filter:
The indicator only generates signals on the following timeframes: 30-minute, 1-hour, 4-hour, and Daily. This helps to ensure the sweeps are significant and likely to result in meaningful price moves.
Alerts:
Alerts can be set up for both bullish and bearish sweep signals, so traders can be notified when these events occur.
Customizable:
EMA Length: The length of the Exponential Moving Average (EMA) can be adjusted. By default, it is set to 50, but you can modify this to fit your trading strategy.
Show EMA Option: You can toggle whether or not to display the EMA line on the chart.
How It Works:
The indicator looks for price action patterns where the current candle sweeps through the high or low of the previous candle and closes beyond the previous wick.
These patterns are often seen as potential traps, where the price initially moves in one direction (sweeping the liquidity) and then quickly reverses, making them important for traders who want to catch reversals or breakouts after a liquidity sweep.
The EMA (50) gives a general trend direction but doesn't directly affect the trade signals. It serves as a visual reference for trend analysis.
Potential Use Cases:
Reversal Trading: Traders can use this indicator to catch reversals after a liquidity sweep. The green upward arrows may indicate a bullish reversal, while the red downward arrows may indicate a bearish reversal.
Trend Trading: The EMA can help traders gauge the overall market trend. If the price is above the EMA, the market may be in an uptrend, and traders may focus on bullish sweeps. Conversely, if the price is below the EMA, the market may be in a downtrend, and traders may focus on bearish sweeps.
Confirmation with Other Indicators: Although the EMA is not used to confirm signals in this script, it can be combined with other indicators (like RSI, Volume, or MACD) to enhance the accuracy of your trades.
Final Thoughts:
This script is designed to identify liquidity sweeps and price reversals based on price action alone, without relying on complex indicators. The optional EMA serves as a helpful tool for understanding the overall market trend. It’s ideal for traders looking to spot potential reversal points after significant price sweeps and is suitable for multiple timeframes (30m, 1h, 4h, Daily).
You can use this description to help potential users understand the functionality of your indicator when publishing it on TradingView or selling it as an invite-only script. Let me know if you need any adjustments or further details!

EMA Envelope + EMA Bollinger BandsEMA envelope and bollinger bands together. It works on the principal of exponential moving average useful in identifying rallies top and bottoms.
Precision is high on higher timeframes like weekly and daily and monthly for swingtrades

GranDoc - Week, Day, Month, and Session Separator5Indicator Name: GranDoc's - Week, Day, Month, and Session Separator
Version: Pine Script v5
Author: Jonpaul Nnamdi Opara (GranDoc )
Description
The "GranDoc - Week, Day, Month, and Session Separator" is a highly customizable TradingView indicator designed to enhance chart analysis by visually marking critical time-based transitions. Developed by Jonpaul Nnamdi Opara, this tool plots vertical lines with labels or background highlights to denote the start and end of weeks, days, months, and major trading sessions (Frankfurt, London, NY Morning, NY Afternoon, Sydney, and Tokyo). Traders can tailor colors, line styles, widths, transparency, and session times to align with their strategies and timezones.
Ideal for forex, stocks, futures, and crypto traders, this indicator simplifies the identification of key market periods—such as session openings/closings or new weeks—that often signal increased volatility or trend shifts. It’s optimized for intraday timeframes for session separators but supports all timeframes for week, day, and month markers, making it a versatile addition to any trader’s toolkit.
Features
Week Separators: Marks Monday starts with customizable lines and "Week Start" labels.
Day Separators: Highlights daily openings with lines and "Day Start" labels.
Month Separators: Indicates new months with lines and "Month Start" labels.
Session Separators: Plots lines and labels for major trading sessions’ start and end:
Frankfurt (default: 07:00–15:00 UTC)
London (default: 08:00–16:00 UTC)
NY Morning (default: 13:00–16:00 UTC)
NY Afternoon (default: 16:00–21:00 UTC)
Sydney (default: 22:00–06:00 UTC)
Tokyo (default: 00:00–08:00 UTC)
Timezone Support: Adjusts session times with a UTC offset (±12 hours).
Display Flexibility : Toggle between labeled vertical lines or background highlights.
Customization: Fine-tune colors, line styles (solid, dashed, dotted), widths, and transparency.
Background Mode: Highlights periods with translucent backgrounds for cleaner charts.
[ i]Labeled Lines: Each line includes descriptive labels (e.g., "London Open", "Tokyo Closed") when not in background mode.
How to Use
Add to Chart:
Copy the script into TradingView’s Pine Editor.
Click "Add to Chart" to apply the indicator.
Customize Settings:
Open settings via double-click or the "Settings" gear icon.
Timezone Offset: Set your UTC offset (e.g., -5 for EST) to align sessions.
Toggles: Enable/disable week, day, month, or session separators.
Appearance: Adjust colors, line styles, widths, and transparency for each separator.
Session Times: Modify start/end hours and minutes if defaults don’t suit your market.
Background Mode: Enable "Show as Background" for colored backgrounds instead of lines, and tweak "Session Background Transparency."
Labels: Labeled lines (e.g., "Sydney Open") appear automatically unless background mode is active.
Chart Compatibility:
Session separators require intraday timeframes (e.g., 1-minute to 4-hour).
Week, day, and month separators work across all timeframes.
Confirm your chart’s timezone aligns with your analysis.
Analyze:
Use separators to pinpoint session transitions, daily openings, or weekly shifts for trade planning.
Labels make it easy to spot key periods on busy charts.
Pair with indicators like RSI, volume, or support/resistance for deeper insights.
Example Use Cases
Forex Trading: Highlight London and NY session opens/closes for high-liquidity entries.
Day Trading: Reset strategies at daily separators and monitor intraday volatility.
Swing Trading: Use week/month separators to track longer-term trends.
Session Focus: Isolate sessions like Tokyo for regional market analysis.
Chart Clarity: Background mode declutters charts while marking key times.
Notes
Session separators are disabled on daily+ timeframes to prevent clutter.
Verify timezone offset for accurate session alignment.
Background mode suits lower timeframes for readability.
Labels are visible only when background mode is disabled.
Feedback
Share your thoughts or suggestions to make this indicator even better! Reach out via TradingView or connect with the author for insights. Happy trading!
About the Author
Dr. Jonpaul Nnamdi Opara, a PhD graduate from Ehime University, Japan, is a researcher and developer specializing in AI and machine learning. His work on automated landslide mapping and defect detection, published in journals like GEOMATE, showcases his precision-driven approach. With the "GranDoc" indicator, Jonpaul brings intuitive, data-driven clarity to financial markets, reflecting his expertise in creating impactful tools.
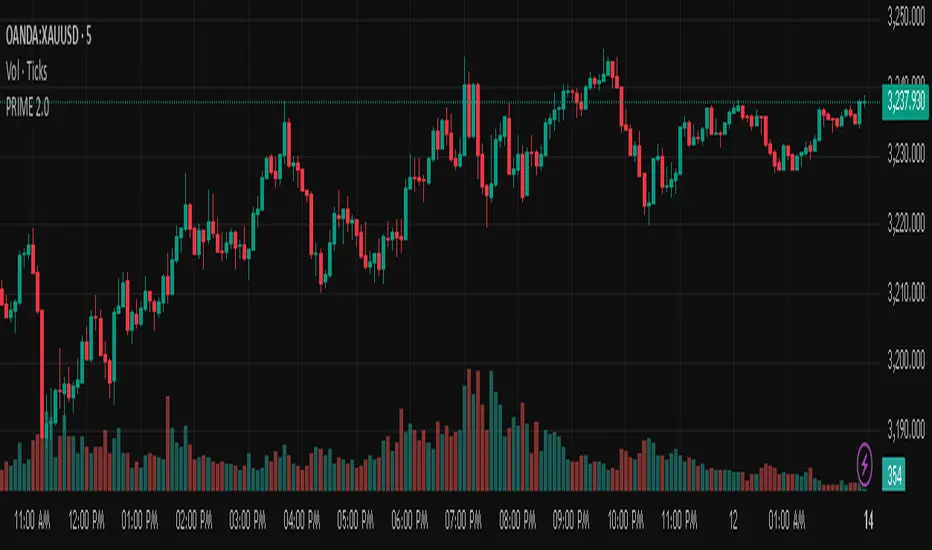
PRIME 2.0PRIME 2.0 — Precision Entry Tool
PRIME 2.0 is a smart price action-based indicator designed for intraday traders who want to catch high-probability moves during the London session. It uses a combination of market structure shifts (CHOCH – Change of Character) and session-based timing to identify potential entries.
🔍 Key Features:
Session-Based Logic: Activates after the London market opens, filtering noise from other sessions.
CHOCH Detection: Spots shifts in market structure by identifying crossover and crossunder of candle highs/lows.
Visual Entry Points: Plots real-time entry points based on structure change.
🧠 Who Is It For?
Scalpers and day traders
Traders who follow Smart Money Concepts (SMC)
Anyone looking to improve entry precision without clutter
⚠️ Disclaimer:
This indicator does not generate buy/sell signals or exit points. It is meant to be used as a tool within a broader trading strategy. Combine it with your own risk management and market knowledge for best results
ICT Judas + Silver Bullet🔰 ICT Judas + Silver Bullet Indicator (SMC-based)
Built for Prop Firm and High Win Rate Intraday Traders
This indicator identifies key institutional setups from Inner Circle Trader (ICT) and Smart Money Concepts (SMC) strategies, optimized for XAUUSD, EURUSD, and other high-volume pairs on the 5-minute chart.
📌 Core Features:
✅ Asian Range Box (02:00–08:00 SGT) – used as manipulation anchor
✅ London Killzone (14:00–16:00 SGT) – Judas Swing detection
✅ New York Killzone (22:30–23:30 SGT) – Silver Bullet setups
✅ Automatic Fair Value Gap (FVG) detection
✅ Liquidity sweep detection based on 20-bar EQH/EQL
✅ Entry + Stop Loss + Take Profit visualization with adjustable RR
✅ Alerts for Judas and Silver setups
✅ Perfect for prop firm scalping and intraday swing logic
🛠️ How It Works:
- Judas Swing: triggers when liquidity above the Asian high is swept during London Killzone
- Silver Bullet: triggers when liquidity below recent lows is swept during NY Killzone
- Entry shown via circle, SL and TP lines based on user-defined RR and stop-loss pip distance
- Designed to be paired with SMC/ICT OB/FVG confirmation entries
⚙️ Settings:
- Adjustable session times
- Toggle FVG display
- Set RR and SL pips to match prop firm rules
- Compatible with alert webhooks for Telegram
🕰️ Note:
All times are fixed to **SGT (GMT+8)**. If you're in another timezone, adjust your TradingView timezone accordingly or update the session inputs manually during Daylight Saving Time changes.
🔔 Alert-Ready:
Use alerts for live signals and pair with webhooks for automation.
🔍 Recommended Pairings:
XAUUSD, EURUSD, GBPUSD, NAS100 on M5 chart
📈 Win Rate Potential:
Backtested with high-probability setups aligned with prop firm daily goals. Best used with strict discipline and 1-2 setups per day.
—
Built with ❤️ by a trader, for traders looking for precision-based executions using ICT logic.

New Day DividerPlots vertical dividers on your chart to mark the beginning of a new trading day based on your preferred time convention.
✅ Customizable New Day Start Time:
"Use Midnight" → Marks the start of a new day at 00:00 (midnight) in the selected timezone.
"Use Digital Open" → Marks the start of a new day at 18:00 New York time, commonly used for digital asset trading.
✅ Full Timezone Support:
Choose from all U.S. time zones (default: New York).
Supports UTC and full UTC offset adjustments for global traders.
✅ Customizable Line Appearance:
Select divider color, width, and style (Solid, Dashed, or Dotted).
Multi-timeframe Moving Average Overlay w/ Sentiment Table🔍 Overview
This indicator overlays selected moving averages (MA) from multiple timeframes directly onto the chart and provides a dynamic sentiment table that summarizes the relative bullish or bearish alignment of short-, mid-, and long-term moving averages.
It supports seven moving average types — including traditional and advanced options like DEMA, TEMA, and HMA — and provides visual feedback via table highlights and alerts when strong momentum alignment is detected.
This tool is designed to support traders who rely on multi-timeframe analysis for trend confirmation, momentum filtering, and high-probability entry timing.
⚙️ Core Features
Multi-Timeframe MA Overlay:
Plot moving averages from 1-minute, 5-minute, 1-hour, 1-day, 1-week, and 1-month timeframes on the same chart for visual trend alignment.
Customizable MA Type:
Choose from:
EMA (Exponential Moving Average)
SMA (Simple Moving Average)
DEMA (Double EMA)
TEMA (Triple EMA)
WMA (Weighted MA)
VWMA (Volume-Weighted MA)
HMA (Hull MA)
Adjustable MA Length:
Change the length of all moving averages globally to suit your strategy (e.g. 9, 21, 50, etc.).
Sentiment Table:
Visually track trend sentiment across four key zones (Hourly, Daily, Weekly, Monthly). Each is based on the relative positioning of short-term and long-term MAs.
Sentiment Symbols Explained:
↑↑↑: Strong bullish momentum (short-term MAs stacked above longer-term MAs)
↑↑ / ↑: Moderate bullish bias
↓↓↓: Strong bearish momentum
↓↓ / ↓: Moderate bearish bias
Table Customization:
Choose the table’s position on the chart (bottom right, top right, bottom left, top left).
Style Customization:
Display MA lines as standard Line or Stepline format.
Color Customization:
Individual colors for each timeframe MA line for visual clarity.
Built-in Alerts:
Receive alerts when strong bullish (↑↑↑) or bearish (↓↓↓) sentiment is detected on any timeframe block.
📈 Use Cases
1. Trend Confirmation:
Use sentiment alignment across multiple timeframes to confirm the overall trend direction before entering a trade.
2. Entry Timing:
Wait for a shift from neutral to strong bullish or bearish sentiment to time entries during pullbacks or breakouts.
3. Momentum Filtering:
Only trade in the direction of the dominant multi-timeframe trend. For example, ignore long setups when all sentiment blocks show bearish alignment.
4. Swing & Intraday Scalping:
Use hourly and daily sentiment zones for swing trades, or rely on 1m/5m MAs for precise scalping decisions in fast-moving markets.
5. Strategy Layering:
Combine this overlay with support/resistance, RSI, or volume-based signals to enhance decision-making with multi-timeframe context.
⚠️ Important Notes
Lower-timeframe values (1m, 5m) may appear static on higher-timeframe charts due to resolution limits in TradingView. This is expected behavior.
The indicator uses MA stacking, not crossover events, to determine sentiment.
