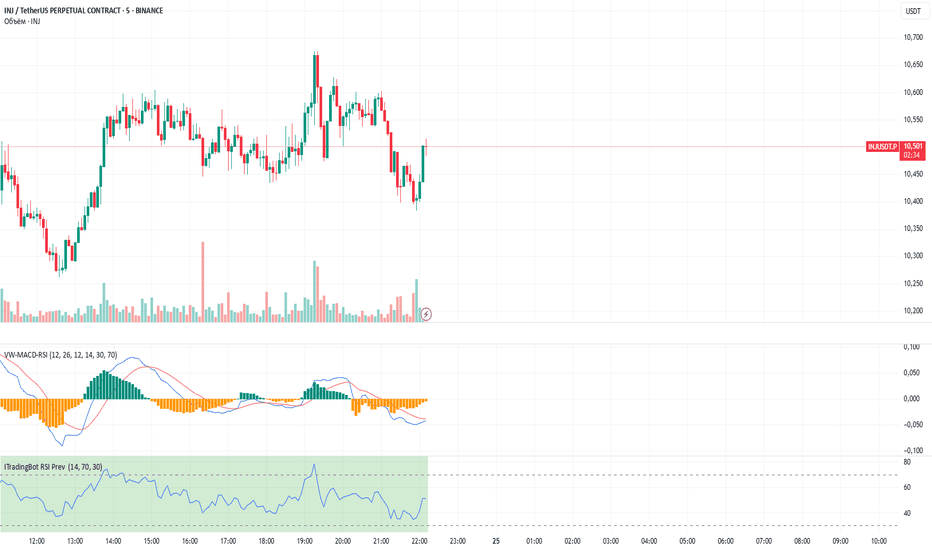
Momentum Based RSIThe Momentum Based RSI is an enhancement to the RSI. it incorporates 2 sections:
MA Ratio (Fast/Slow)
RSI
at the end both of those are multiplied to create a more responsive RSI which reacts fast to market moves while still providing a whip ressistant tool.
Momentum Calculation
The "MA Ratio" as i like to call it results from comparing 2 MAs (both can be set to whatever type you like) against eachother, which, in the end, provides a Ratio that visualizes the difference. It is simple yet effective
RSI
An Old yet popular tool which dates back to 1978. In and out of itself it is a great tool, however it still can be enhanced.
The Combination
The RSI and the MARatio are multiplied together, which results in an RSI that is ampliefied by the speed of the market movements.
This proves highly effective, since the MA Ratio is hovering around at the same level. However during trends, it picks up speed in either of both directions which marginally increases the RSI's response the said movement.
Why its Creative, New and Good
While it is a super simple concept, it still holds a lot of power relative to its sophistication. Traders may use it like they used the Vanilla RSI (e.g Trend following, Mean-reversion or other).
Unlike RSI with momentum overlays, this indicator actively uses an MA Ratio multiplier for simplicity and responsiveness.
At last, Its primary goal is to detect trends faster while not creating more noise & false signals.
What not to do
if youre using this indicator, please do NOT change the Fast MA to be slower than to Slow MA or vice versa, since you'll be getting broken & noise induced signals which may not align with your goals.
Great inventions require great Care
As with anything, you should not use this tool without any other confluence. As great as the backtests may be, you dont know what the future holds, be careful!
This indicator is not a guaranteed predicition tool. If youre going to use it for investment decisions, please use it in coherence with other tools.
Thank you for reading!
Скользящие средние
Multi-SMA Levels**Indicator Name:** Triple SMA Trend Analyzer
**Version:6
**Type:** Moving Average Trend Analysis Tool
### 📊 **Indicator Functionality**
This indicator plots three Simple Moving Averages (100, 150, and 200 periods) to:
1. Identify the market's primary trend direction
2. Highlight dynamic support/resistance levels
3. Detect potential trend reversals through SMA crossovers
### 🎯 **Key Features**
- **SMA 100 (Blue):** Short-term trend filter
- **SMA 150 (Orange):** Intermediate trend confirmation
- **SMA 200 (Red):** Long-term market bias (bullish/bearish)
- Customizable periods and colors
- Clear visual presentation on all timeframes
### 💡 **How to Trade With This Indicator**
**🔷 Trend Identification:**
- **Bullish Market:** Price above all three SMAs (stacked in order: 100 > 150 > 200)
- **Bearish Market:** Price below all three SMAs (stacked in order: 100 < 150 < 200)
**🔶 Trading Signals:**
1. **Bounce Plays:**
- Look for price to bounce off SMAs in trending markets
- Example: In uptrend, buy when price pulls back to SMA 100/150
2. **Breakout Trading:**
- Watch for price closing above/below all three SMAs
- Confirm with increased volume
3. **Crossover Signals:**
- SMA 100 crossing above 150/200 = Potential bullish momentum
- SMA 100 crossing below 150/200 = Potential bearish reversal
**⚙️ Optimal Settings:**
- Works best on daily/4h charts for swing trading
- Combine with RSI (14 period) for overbought/oversold confirmation
### 📝 **Pro Tips**
- The SMA 200 is widely watched by institutions - major reactions often occur here
- During strong trends, the SMA 100 often acts as dynamic support/resistance
- For day trading, apply to 15m/1h charts with adjusted periods (e.g., 50/100/200)
This multi-timeframe tool helps traders:
✓ Filter trade direction
✓ Identify key levels
✓ Spot high-probability entries
✓ Manage risk effectively
SMA7 Tail Reversal📌 Description:
The SMA7 Tail Reversal indicator is designed to identify potential counter-trend trading opportunities by checking if candle wicks (tails) respect a key moving average level (SMA7).
This indicator highlights price action where candles are clearly separated from the moving average, suggesting a possible reversal or temporary correction.
📌 How It Works:
Moving Average Calculation:
Calculates a simple moving average (SMA) of length 7 to act as the primary trend filter.
Candle Classification:
Bullish Candle: A candle where the closing price is higher than the opening price, with a short upper wick.
Bearish Candle: A candle where the closing price is lower than the opening price, with a short lower wick.
Conditions for Coloring Candles:
Long Condition (Green Candle):
High & Low are both below the SMA7 line.
Volume is above the 20-period average.
A bullish candle is detected.
Short Condition (Red Candle):
High & Low are both above the SMA7 line.
Volume is above the 20-period average.
A bearish candle is detected.
📌 Visual Representation:
Green Candles: Potential long signals when price action stays below the SMA7 line.
Red Candles: Potential short signals when price action stays above the SMA7 line.
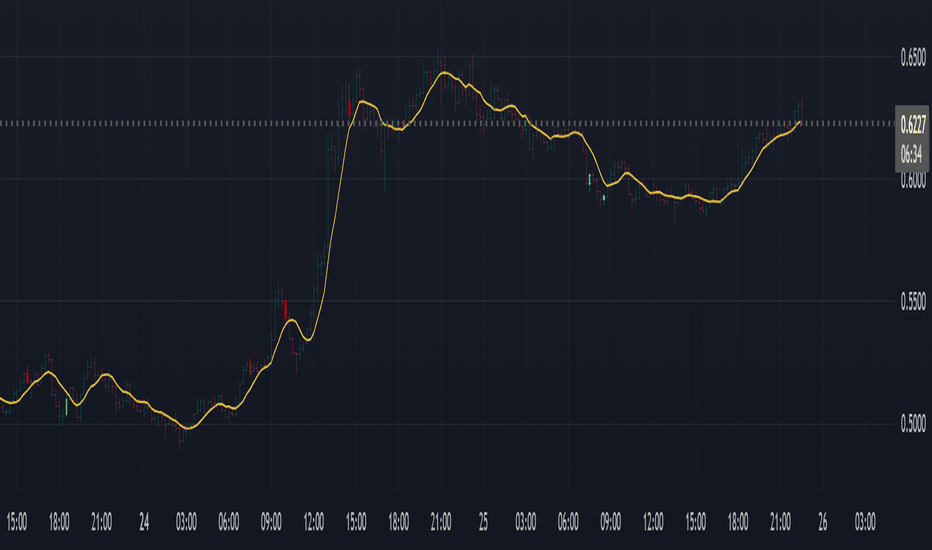
Yellow Line: SMA7, used as the dynamic threshold for signal generation.
📌 Usage:
Best applied to volatile markets with clear trends.
Effective in detecting counter-trend opportunities where price diverges from the SMA7 line.
Works well with additional confirmation tools for better accuracy.
Configurable MA Cross (MA-X) StrategyThis is a simple crossover strategy with configurable moving averages for entry and exits. You can also select the type of moving average you want to use. Support moving averages are SMA, EMA, WMA and HMA.
Why?
Trend following using crossovers is a very common strategy though people use different combinations of moving averages and types. I was also experimenting the same and decided to create this instead of changing the code every time I wanted to try a different period or moving averages.
With a right combination, you can make this work for nearly any sufficiently liquid instrument. The default combination of 21 (Fast) and 55 (Slow) EMA along with 34 EMA for exit works well on COINBASE:BTCUSD (4H/1D) and NSE:NIFTY (1D) though it needs to be tested more. TBH I haven't tried it on any other instrument so far but that's easy to do with simple and flexible options.
Enjoy!
Combined Market Structure Indicator### 🧠 Combined Market Structure Indicator – Supertrend + QQE + EMA + OB/MSB
The **Combined Market Structure Indicator** is a powerful, all-in-one trading tool designed to help you identify **market structure breaks (MSBs)**, **order blocks (OBs)**, **EMA crossovers**, and popular **trend-following indicators** like **Supertrend** and **QQE** – all in a single script.
#### 🚀 Key Features:
🔹 **Supertrend Buy/Sell Signals**
Identifies trend changes with customizable ATR and factor values. Alerts are built-in for both long and short opportunities.
🔹 **QQE Momentum Signals**
A refined QQE (Quantitative Qualitative Estimation) implementation to catch early momentum shifts. Plots buy/sell signals on the chart.
🔹 **EMA Crossovers**
Customizable fast and slow exponential moving averages highlight classic trend continuation or reversal points with optional alerts.
🔹 **Market Structure Break (MSB)**
Detects bullish and bearish market structure breaks using dynamic zigzag swing points and Fibonacci-based confirmation logic. MSBs are clearly labeled on the chart.
🔹 **Order Block (OB) Detection**
Automatically draws bullish and bearish OB zones based on candle structure and market shifts. Alerts notify when price revisits these areas.
🔹 **Breaker Block & Mitigation Block Zones (BB/MB)**
Visual zones for potential rejections or continuations, helping traders anticipate key reaction levels in the price structure.
🔹 **Dynamic ZigZag Visualization**
Optional zigzag line plotting to visualize swing highs/lows, providing better structure clarity and confirming OB/MSB zones.
🔹 **Custom Alert System**
Smart alerts for Supertrend, EMA crossovers, QQE signals, and price entering key OB/BB zones – fully customizable.
#### 🎛️ User Inputs:
- Supertrend Factor, ATR Length
- QQE RSI Length
- Fast/Slow EMA periods
- Alert toggles for each system
- Zigzag sensitivity and visualization toggle
- Full control over OB/BB colors, labels, and cleanup behavior
#### 📊 Ideal For:
- Swing Traders
- Smart Money / ICT Style Traders
- Trend Followers
- Breakout/Breakdown Traders
- Anyone seeking structure-based confluence zones
NakInvest - Inside Bar no Eden dos Traders (Stormer)📌 NakInvest - Inside Bar Detector (Éden dos Traders Enhanced Detection)
This indicator is designed to identify Inside Bars that occur during strong trending conditions, following the popular Éden dos Traders strategy by Stormer, famous brazilian trader. It uses the relationship between two EMAs (Short EMA & Long EMA) to determine whether the market is in a bullish or bearish trend, and highlights Inside Bars that meet specific criteria.
⸻
🔍 What This Indicator Does:
1. EMA-Based Trend Detection:
• Identifies Uptrends when the Short EMA is above the Long EMA.
• Identifies Downtrends when the Short EMA is below the Long EMA.
2. Inside Bar Detection:
• An Inside Bar is detected when the entire candle (body & wicks) is contained within the body of the previous candle.
• This pattern suggests consolidation and potential breakouts, especially when found within a strong trend.
3. Debug Mode for Transparency:
• When enabled, provides visual markers to indicate when the conditions for trend detection and Inside Bars are met.
• Helps traders understand why certain candles are detected and others are not.
⸻
📈 How to Use:
• Apply this indicator to any market and timeframe, but it’s most effective on higher timeframes (H1, H4, Daily).
• Ideal for traders looking for trend-continuation setups or reversal signals after periods of consolidation.
• Combine this indicator with other tools (e.g., Volume Analysis, Price Action Patterns) for greater accuracy.
⸻
⚙️ Indicator Settings:
1. Short EMA Length: The period for the fast-moving average (default: 8).
2. Long EMA Length: The period for the slow-moving average (default: 80).
3. Enable Debug Mode: Toggle visibility of debug markers to better understand condition logic.
⸻
📢 Alerts:
This script includes labels for:
• IB (Up): Inside Bar detected during an uptrend.
• IB (Down): Inside Bar detected during a downtrend.
⸻
📌 Disclaimer:
This indicator is intended for educational purposes only and is not financial advice. Always perform your own research and consult with a financial professional before making any trading decisions.
Multi-Fibonacci Trend Average[FibonacciFlux]Multi-Fibonacci Trend Average (MFTA): An Institutional-Grade Trend Confluence Indicator for Discerning Market Participants
My original indicator/Strategy:
Engineered for the sophisticated demands of institutional and advanced traders, the Multi-Fibonacci Trend Average (MFTA) indicator represents a paradigm shift in technical analysis. This meticulously crafted tool is designed to furnish high-definition trend signals within the complexities of modern financial markets. Anchored in the rigorous principles of Fibonacci ratios and augmented by advanced averaging methodologies, MFTA delivers a granular perspective on trend dynamics. Its integration of Multi-Timeframe (MTF) filters provides unparalleled signal robustness, empowering strategic decision-making with a heightened degree of confidence.
MFTA indicator on BTCUSDT 15min chart with 1min RSI and MACD filters enabled. Note the refined signal generation with reduced noise.
MFTA indicator on BTCUSDT 15min chart without MTF filters. While capturing more potential trading opportunities, it also generates a higher frequency of signals, including potential false positives.
Core Innovation: Proprietary Fibonacci-Enhanced Supertrend Averaging Engine
The MFTA indicator’s core innovation lies in its proprietary implementation of Supertrend analysis, strategically fortified by Fibonacci ratios to construct a truly dynamic volatility envelope. Departing from conventional Supertrend methodologies, MFTA autonomously computes not one, but three distinct Supertrend lines. Each of these lines is uniquely parameterized by a specific Fibonacci factor: 0.618 (Weak), 1.618 (Medium/Golden Ratio), and 2.618 (Strong/Extended Fibonacci).
// Fibonacci-based factors for multiple Supertrend calculations
factor1 = input.float(0.618, 'Factor 1 (Weak/Fibonacci)', minval=0.01, step=0.01, tooltip='Factor 1 (Weak/Fibonacci)', group="Fibonacci Supertrend")
factor2 = input.float(1.618, 'Factor 2 (Medium/Golden Ratio)', minval=0.01, step=0.01, tooltip='Factor 2 (Medium/Golden Ratio)', group="Fibonacci Supertrend")
factor3 = input.float(2.618, 'Factor 3 (Strong/Extended Fib)', minval=0.01, step=0.01, tooltip='Factor 3 (Strong/Extended Fib)', group="Fibonacci Supertrend")
This multi-faceted architecture adeptly captures a spectrum of market volatility sensitivities, ensuring a comprehensive assessment of prevailing conditions. Subsequently, the indicator algorithmically synthesizes these disparate Supertrend lines through arithmetic averaging. To achieve optimal signal fidelity and mitigate inherent market noise, this composite average is further refined utilizing an Exponential Moving Average (EMA).
// Calculate average of the three supertends and a smoothed version
superlength = input.int(21, 'Smoothing Length', tooltip='Smoothing Length for Average Supertrend', group="Fibonacci Supertrend")
average_trend = (supertrend1 + supertrend2 + supertrend3) / 3
smoothed_trend = ta.ema(average_trend, superlength)
The resultant ‘Smoothed Trend’ line emerges as a remarkably responsive yet stable trend demarcation, offering demonstrably superior clarity and precision compared to singular Supertrend implementations, particularly within the turbulent dynamics of high-volatility markets.
Elevated Signal Confluence: Integrated Multi-Timeframe (MTF) Validation Suite
MFTA transcends the limitations of conventional trend indicators by incorporating an advanced suite of three independent MTF filters: RSI, MACD, and Volume. These filters function as sophisticated validation protocols, rigorously ensuring that only signals exhibiting a confluence of high-probability factors are brought to the forefront.
1. Granular Lower Timeframe RSI Momentum Filter
The Relative Strength Index (RSI) filter, computed from a user-defined lower timeframe, furnishes critical momentum-based signal validation. By meticulously monitoring RSI dynamics on an accelerated timeframe, traders gain the capacity to evaluate underlying momentum strength with precision, prior to committing to signal execution on the primary chart timeframe.
// --- Lower Timeframe RSI Filter ---
ltf_rsi_filter_enable = input.bool(false, title="Enable RSI Filter", group="MTF Filters", tooltip="Use RSI from lower timeframe as a filter")
ltf_rsi_timeframe = input.timeframe("1", title="RSI Timeframe", group="MTF Filters", tooltip="Timeframe for RSI calculation")
ltf_rsi_length = input.int(14, title="RSI Length", minval=1, group="MTF Filters", tooltip="Length for RSI calculation")
ltf_rsi_threshold = input.int(30, title="RSI Threshold", minval=0, maxval=100, group="MTF Filters", tooltip="RSI value threshold for filtering signals")
2. Convergent Lower Timeframe MACD Trend-Momentum Filter
The Moving Average Convergence Divergence (MACD) filter, also calculated on a lower timeframe basis, introduces a critical layer of trend-momentum convergence confirmation. The bullish signal configuration rigorously mandates that the MACD line be definitively positioned above the Signal line on the designated lower timeframe. This stringent condition ensures a robust indication of converging momentum that aligns synergistically with the prevailing trend identified on the primary timeframe.
// --- Lower Timeframe MACD Filter ---
ltf_macd_filter_enable = input.bool(false, title="Enable MACD Filter", group="MTF Filters", tooltip="Use MACD from lower timeframe as a filter")
ltf_macd_timeframe = input.timeframe("1", title="MACD Timeframe", group="MTF Filters", tooltip="Timeframe for MACD calculation")
ltf_macd_fast_length = input.int(12, title="MACD Fast Length", minval=1, group="MTF Filters", tooltip="Fast EMA length for MACD")
ltf_macd_slow_length = input.int(26, title="MACD Slow Length", minval=1, group="MTF Filters", tooltip="Slow EMA length for MACD")
ltf_macd_signal_length = input.int(9, title="MACD Signal Length", minval=1, group="MTF Filters", tooltip="Signal SMA length for MACD")
3. Definitive Volume Confirmation Filter
The Volume Filter functions as an indispensable arbiter of trade conviction. By establishing a dynamic volume threshold, defined as a percentage relative to the average volume over a user-specified lookback period, traders can effectively ensure that all generated signals are rigorously validated by demonstrably increased trading activity. This pivotal validation step signifies robust market participation, substantially diminishing the potential for spurious or false breakout signals.
// --- Volume Filter ---
volume_filter_enable = input.bool(false, title="Enable Volume Filter", group="MTF Filters", tooltip="Use volume level as a filter")
volume_threshold_percent = input.int(title="Volume Threshold (%)", defval=150, minval=100, group="MTF Filters", tooltip="Minimum volume percentage compared to average volume to allow signal (100% = average)")
These meticulously engineered filters operate in synergistic confluence, requiring all enabled filters to definitively satisfy their pre-defined conditions before a Buy or Sell signal is generated. This stringent multi-layered validation process drastically minimizes the incidence of false positive signals, thereby significantly enhancing entry precision and overall signal reliability.
Intuitive Visual Architecture & Actionable Intelligence
MFTA provides a demonstrably intuitive and visually rich charting environment, meticulously delineating trend direction and momentum through precisely color-coded plots:
Average Supertrend: Thin line, green/red for uptrend/downtrend, immediate directional bias.
Smoothed Supertrend: Bold line, teal/purple for uptrend/downtrend, cleaner, institutionally robust trend.
Dynamic Trend Fill: Green/red fill between Supertrends quantifies trend strength and momentum.
Adaptive Background Coloring: Light green/red background mirrors Smoothed Supertrend direction, holistic trend perspective.
Precision Buy/Sell Signals: ‘BUY’/‘SELL’ labels appear on chart when trend touch and MTF filter confluence are satisfied, facilitating high-conviction trade action.
MFTA indicator applied to BTCUSDT 4-hour chart, showcasing its effectiveness on higher timeframes. The Smoothed Length parameter is increased to 200 for enhanced smoothness on this timeframe, coupled with 1min RSI and Volume filters for signal refinement. This illustrates the indicator's adaptability across different timeframes and market conditions.
Strategic Applications for Institutional Mandates
MFTA’s sophisticated design provides distinct advantages for advanced trading operations and institutional investment mandates. Key strategic applications include:
High-Probability Trend Identification: Fibonacci-averaged Supertrend with MTF filters robustly identifies high-probability trend continuations and reversals, enhancing alpha generation.
Precision Entry/Exit Signals: Volume and momentum-filtered signals enable institutional-grade precision for optimized risk-adjusted returns.
Algorithmic Trading Integration: Clear signal logic facilitates seamless integration into automated trading systems for scalable strategy deployment.
Multi-Asset/Timeframe Versatility: Adaptable parameters ensure applicability across diverse asset classes and timeframes, catering to varied trading mandates.
Enhanced Risk Management: Superior signal fidelity from MTF filters inherently reduces false signals, supporting robust risk management protocols.
Granular Customization and Parameterized Control
MFTA offers unparalleled customization, empowering users to fine-tune parameters for precise alignment with specific trading styles and market conditions. Key adjustable parameters include:
Fibonacci Factors: Adjust Supertrend sensitivity to volatility regimes.
ATR Length: Control volatility responsiveness in Supertrend calculations.
Smoothing Length: Refine Smoothed Trend line responsiveness and noise reduction.
MTF Filter Parameters: Independently configure timeframes, lookback periods, and thresholds for RSI, MACD, and Volume filters for optimal signal filtering.
Disclaimer
MFTA is meticulously engineered for high-quality trend signals; however, no indicator guarantees profit. Market conditions are unpredictable, and trading involves substantial risk. Rigorous backtesting and forward testing across diverse datasets, alongside a comprehensive understanding of the indicator's logic, are essential before live deployment. Past performance is not indicative of future results. MFTA is for informational and analytical purposes only and is not financial or investment advice.
EMA 20/50/100/200Easy to use. 4 EMA into a single chart. Can be used into your free TradingView Version.
How to trade?
When the EMA 20, 50, 100, 200 aligned and price bounces off EMA 20 or 50, take a buy trade.
When the EMA 200, 100, 50 and 20 is aligned and the price bounces off EMA 20 or 50, take a sell trade
Make sure to draw a trend line and take a trade after the breakout!
Predictave buy/sell EMA assist for Ripster INDPredictive buy/sell EMA assist. This was actually made to help **predict** the EMA cross overs that are visual on Ripsters indicator. Simple arrow up(Buy) arrow down(sell). The "Buy" arrow tolerance is adjustable to fine tune against your stock choice. Although this can be used standalone, the predictive and EMA portion was tailored to work in conjunction with Ripsters.
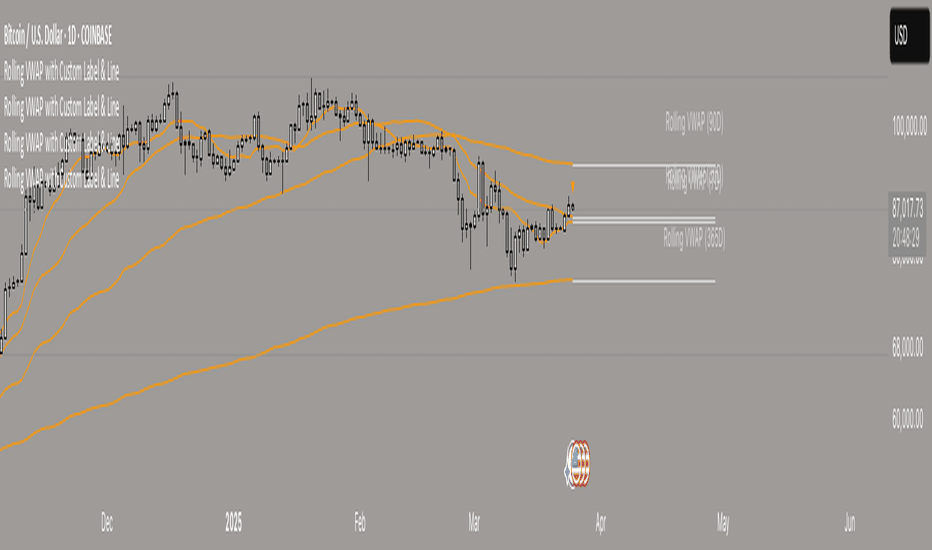
Rolling VWAP with Custom Label & LineRolling VWAP's with clean levels. Personally i like to use 7D rolling as well as 30d, 90 day and 365 day rolling
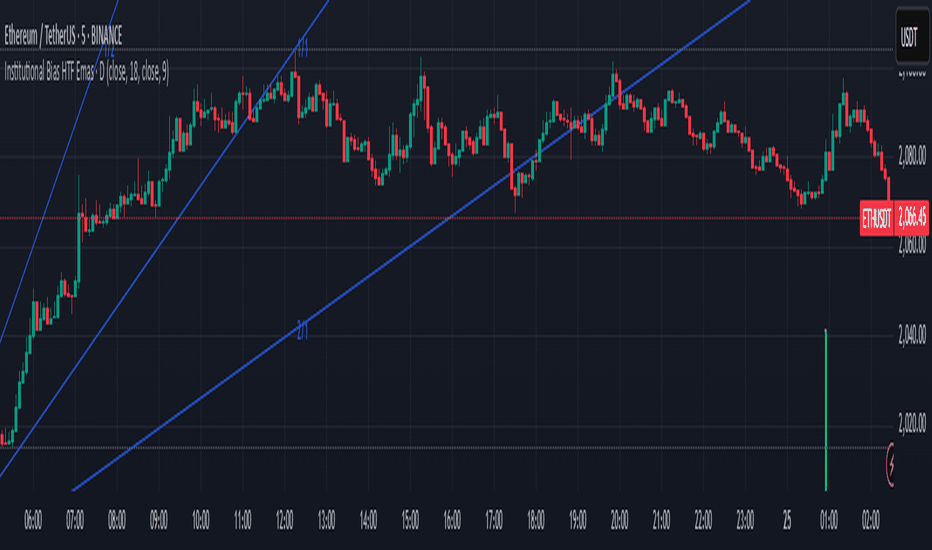
Institutional Bias HTF EmasIt lets you see bias using EMAs from various timeframes. Ideal for free accounts.
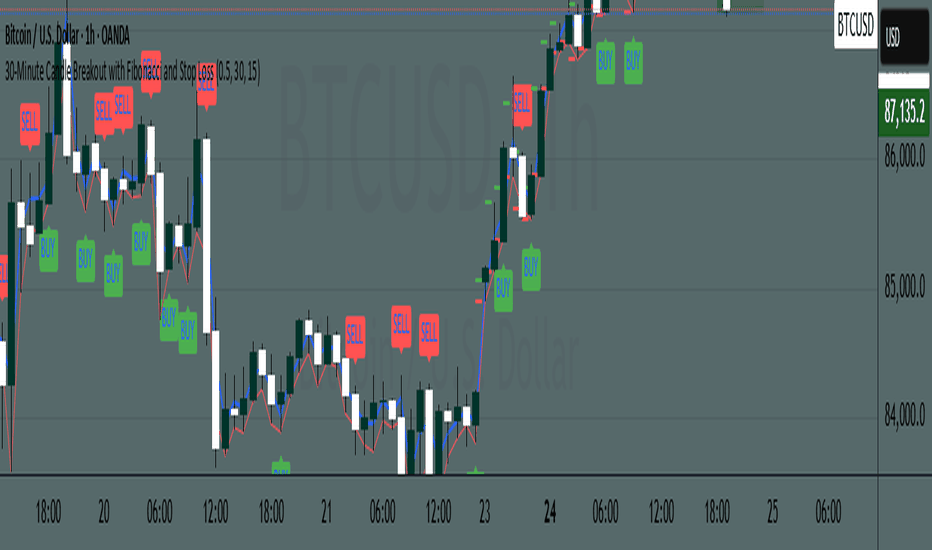
30-Minute Candle Breakout with Fibonacci and Stop Loss a code that just indicates a 30-minute candle.
broken after 15 minutes, if these criteria are present in the candle, choose the candle's top with a line in 30 minutes and its bottom with a line.
Forexsom MA Crossover SignalsA Trend-Following Trading Indicator for TradingView
Overview
This indicator plots two moving averages (MA) on your chart and generates visual signals when they cross, helping traders identify potential trend reversals. It is designed to be simple yet effective for both beginners and experienced traders.
Key Features
✅ Dual Moving Averages – Plots a Fast MA (default: 9-period) and a Slow MA (default: 21-period)
✅ Customizable MA Types – Choose between EMA (Exponential Moving Average) or SMA (Simple Moving Average)
✅ Clear Buy/Sell Signals – Displays "BUY" (green label) when the Fast MA crosses above the Slow MA and "SELL" (red label) when it crosses below
✅ Alerts – Get notified when new signals appear (compatible with TradingView alerts)
✅ Clean Visuals – Easy-to-read moving averages with adjustable colors
How It Works
Bullish Signal (BUY) → Fast MA crosses above Slow MA (suggests uptrend)
Bearish Signal (SELL) → Fast MA crosses below Slow MA (suggests downtrend)
Best Used For
✔ Trend-following strategies (swing trading, day trading)
✔ Confirming trend reversals
✔ Filtering trade entries in combination with other indicators
Customization Options
Adjust Fast & Slow MA lengths
Switch between EMA or SMA for smoother or more responsive signals
Why Use This Indicator?
Simple & Effective – No clutter, just clear signals
Works on All Timeframes – From scalping (1M, 5M) to long-term trading (4H, Daily)
Alerts for Real-Time Trading – Never miss a signal
Forex Fire EMA/MA/RSI StrategyEURUSD
The entry method in the Forex Fire EMA/MA/RSI Strategy combines several conditions across two timeframes. Here's a breakdown of how entries are determined:
Long Entry Conditions:
15-Minute Timeframe Conditions:
EMA 13 > EMA 62 (short-term momentum is bullish)
Price > MA 200 (trading above the major trend indicator)
Fast RSI (7) > Slow RSI (28) (momentum is increasing)
Fast RSI > 50 (showing bullish momentum)
Volume is increasing compared to 20-period average
4-Hour Timeframe Confluence:
EMA 13 > EMA 62 (larger timeframe confirms bullish trend)
Price > MA 200 (confirming overall uptrend)
Slow RSI (28) > 40 (showing bullish bias)
Fast RSI > Slow RSI (momentum is supporting the move)
Additional Precision Requirement:
Either EMA 13 has just crossed above EMA 62 (crossover)
OR price has just crossed above MA 200
Short Entry Conditions:
15-Minute Timeframe Conditions:
EMA 13 < EMA 62 (short-term momentum is bearish)
Price < MA 200 (trading below the major trend indicator)
Fast RSI (7) < Slow RSI (28) (momentum is decreasing)
Fast RSI < 50 (showing bearish momentum)
Volume is increasing compared to 20-period average
4-Hour Timeframe Confluence:
EMA 13 < EMA 62 (larger timeframe confirms bearish trend)
Price < MA 200 (confirming overall downtrend)
Slow RSI (28) < 60 (showing bearish bias)
Fast RSI < Slow RSI (momentum is supporting the move)
Additional Precision Requirement:
Either EMA 13 has just crossed under EMA 62 (crossunder)
OR price has just crossed under MA 200
The key aspect of this strategy is that it requires alignment between the shorter timeframe (15m) and the larger timeframe (4h), which helps filter out false signals and focuses on trades that have strong multi-timeframe support. The crossover/crossunder requirement further refines entries by looking for actual changes in direction rather than just conditions that might have been in place for a long time.
Long Entry/Exit FlagsThis script flags long entry and exit points based on a simple EMA crossover strategy. A green triangle appears when the short EMA crosses above the long EMA (entry), and a red triangle marks when it crosses below (exit). Designed for clean trend-following signals across any timeframe. Alerts are included for both entry and exit conditions.
Volume Weighted MACD + RSI SignalsVolume-Weighted MACD
Takes trading volume into account: strong movements with high volume carry more weight.
Instead of EMA, VWMA is used. The signal length is 12 instead of the standard 9.
The VWMA function returns the volume-weighted moving average of the source over the specified length of bars. It is equivalent to: sma(source * volume, length) / sma(volume, length).
Stacked EMA Candle Colors - Enhanced📊 Stacked EMA Candle Colors – Trend Strength Visualizer
Description:
🚀 Overview:
The Stacked EMA Candle Colors – Trend Strength Visualizer is a simple yet powerful indicator that helps traders identify market trends using Exponential Moving Averages (EMAs). By dynamically coloring candles based on the strength and alignment of multiple EMAs, this tool makes it easier to spot bullish and bearish trends at a glance, without cluttering your chart with multiple EMA lines.
🔹 Key Features:
✅ Four Customizable EMA lengths (adjust in settings)
✅ Candles change color based on EMA stacking (adjustable)
✅ Four-part gradient-based strength visualization for momentum confirmation (adjustable)
✅ Works on all timeframes and asset classes
🎨 How It Works:
When shorter EMAs (e.g., 9, 21) are above longer EMAs (e.g., 50, 200), the trend is bullish, and candles turn green/lime based on momentum strength.
When shorter EMAs are below longer EMAs, the trend is bearish, and candles turn red/pink depending on trend intensity.
If no clear trend is detected, candles remain gray for neutrality.
📈 Ideal for:
✔️ Trend traders who want a clear visual representation of momentum
✔️ Scalpers, day traders, and swing traders looking for quick trend confirmation
✔️ Anyone who wants to enhance their chart readability
🔧 Customization:
Easily adjust the EMA periods in the settings menu to fit your preferred trading strategy!
🚀 Add this indicator to your TradingView chart and spot trends with confidence!
Lower Timeframe *MALower Timeframe Moving Average (MA) Indicator
This indicator calculates a moving average using data from a lower timeframe than the chart's current timeframe.
It provides potentially earlier signals and smoother price action by incorporating more granular price data. It also allows you to keep the same reference frame for your moving average regardless of your currently selected period.
Key Features:
- Uses lower timeframe data to calculate moving averages on higher timeframes
- Supports multiple MA types: SMA, EMA, WMA, VWMA, RMA, and HMA
- Allows selection of various price inputs (close, open, high, low, hl2, hlc3, ohlc4)
- Automatically adjusts MA length based on the ratio between chart timeframe and selected sub-timeframe
15m
5m
full sma This indicator is specifically designed to provide traders with a comprehensive tool that integrates three crucial moving average levels into a single, streamlined solution. By consolidating these key levels, it enhances market analysis efficiency, enabling traders to identify trends, dynamic support and resistance zones, and potential entry or exit points with greater precision. Whether used for trend confirmation, momentum assessment, or strategic trade execution, this indicator serves as an essential component for both novice and professional traders aiming to refine their technical analysis approach.


