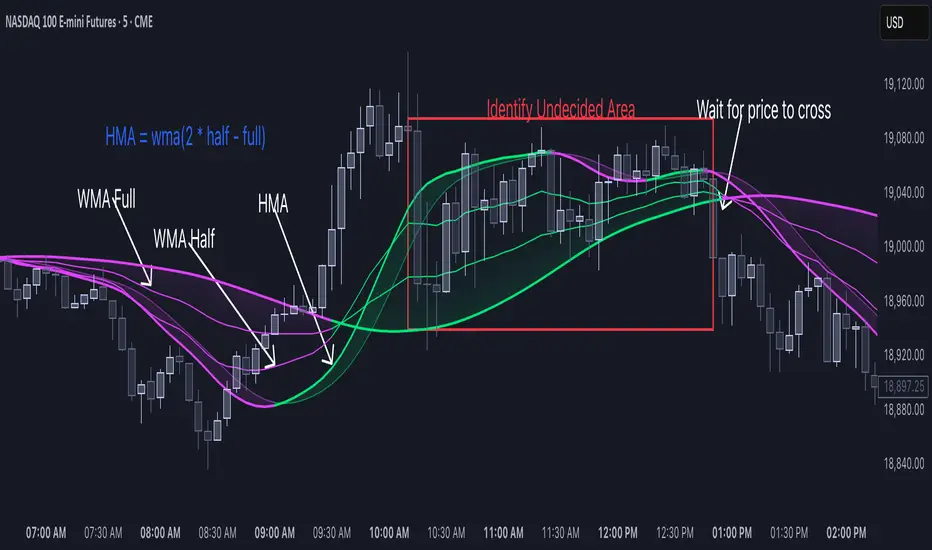
HMA Breakdown [NLR]Hull Moving Average (HMA) is a great trend-following tool — it's smooth, fast, and more responsive than traditional MAs like EMA or SMA. But the problem?
Sometimes it gives signals that look sharp but are misleading — especially in noisy markets or when the price is chopping around.
This script breaks down the inner mechanics of the HMA to give you more context:
Are the inputs to HMA actually diverging?
Is there momentum behind the move?
Is this trend about to reverse or just a pullback?
By plotting the components of HMA — and layering signal bands, color logic, and optional trend overlays — it gives you a visual breakdown of what's really going on under the hood.
What this indicator shows
HMA Trend (Main Line)
The Hull Moving Average (HMA) is plotted in bold, colored red or green based on internal conditions (not just price slope).
WMA Components (Fast & Slow)
Shows the two WMAs used inside the HMA calculation:
WMA Half (faster) — reacts quickly to price
WMA Full (slower) — smoother, less reactive
Their difference and crossover gives you clues on whether momentum is building or fading.
Signal & Band Structure
A calculated upper band and lower band are used to track when HMA is leading or lagging momentum.
When the HMA is below the band, trend may be weakening - this helps you filter false signals.
TMA Candle (Optional Visual)
A synthetic candle shows whether the smoothed average is rising or falling compared to a few candles back.
This is a simple visual cue to spot inflection points in the trend.
EMA Trend Overlay (Optional)
A pair of short-term EMAs built on a smoothed source helps you catch micro-trends or align your entries with the bigger trend.
Can act as an early heads-up or a trend confirmation layer.
What problem it solves
Noisy Signals: Helps filter out weak or fake trend signals often seen in HMA-only systems.
Visual Breakdown: Lets you see how each component of the HMA is behaving — so you’re not flying blind.
Momentum Confirmation: Adds layered confirmation using fast-vs-slow WMA cross, signal bands, and mini trend overlays.
Best Used For:
Trend-following traders who use HMA or WMA strategies
Filtering entries/exits in momentum-based systems
Visually confirming when a trend is real vs fake
Скользящие средние
Advanced Momentum Scanner [QuantAlgo]The Advanced Momentum Scanner is a sophisticated technical indicator designed to identify market momentum and trend direction using multiple exponential moving averages (EMAs), momentum metrics, and adaptive visualization techniques. It is particularly valuable for those looking to identify trading and investing opportunities based on trend changes and momentum shifts across any market and timeframe.
🟢 Technical Foundation
The Advanced Momentum Scanner utilizes a multi-layered approach with four different EMA periods to identify market momentum and trend direction:
Ultra-Fast EMA for quick trend changes detection (default: 5)
Fast EMA for short-term trend analysis (default: 10)
Mid EMA for intermediate confirmation (default: 30)
Slow EMA for long-term trend identification (default: 100)
For momentum detection, the indicator implements a Rate of Change (RoC) calculation to measure price momentum over a specified period. It further enhances analysis by incorporating RSI readings for overbought/oversold conditions, volatility measurements through ATR, and optional volume confirmation. When these elements align, the indicator generates trading signals based on the selected sensitivity mode (Conservative, Balanced, or Aggressive).
🟢 Key Features & Signals
1. Multi-Period Trend Identification
The indicator combines multiple EMAs of different lengths to provide comprehensive trend analysis within the same timeframe, displaying the information through color-coded visual elements on the chart.
When an uptrend is detected, chart elements are colored with the bullish theme color (default: green/teal).
Similarly, when a downtrend is detected, chart elements are colored with the bearish theme color (default: red).
During neutral or indecisive periods, chart elements are colored with a neutral gray color, providing clear visual distinction between trending and non-trending market conditions.
This visualization provides immediate insights into underlying trend direction without requiring separate indicators, helping traders and investors quickly identify the market's current state.
2. Trend Strength Information Panel
The trend panel operates in three different sensitivity modes (Conservative, Aggressive, and Balanced), each affecting how the indicator processes and displays market information.
The Conservative mode prioritizes trend sustainability over frequency, showing only strong trend movements with high probability.
The Aggressive mode detects early trend changes, providing more frequent signals but potentially more false positives.
The Balanced mode offers a middle ground with moderate signal frequency and reliability.
Regardless of the selected mode, the panel displays:
Current trend direction (UPTREND, DOWNTREND, or NEUTRAL)
Trend strength percentage (0-100%)
Early detection signals when applicable
The active sensitivity mode
This comprehensive approach helps traders and investors:
→ Assess the strength of current market trends
→ Identify early potential trend changes before full confirmation
→ Make more informed trading and investing decisions based on trend context
3. Customizable Visualization Settings
This indicator offers extensive visual customization options to suit different trading styles and preferences:
Display options:
→ Fully customizable uptrend, downtrend, and neutral colors
→ Color-coded price bars showing trend direction
→ Dynamic gradient bands visualizing potential trend channels
→ Optional background coloring based on trend intensity
→ Adjustable transparency levels for all visual elements
These visualization settings can be fine-tuned through the indicator's interface, allowing traders and investors to create a personalized chart environment that emphasizes the most relevant information for their strategy.
The indicator also features a comprehensive alert system with notifications for:
New trend formations (uptrend, downtrend, neutral)
Early trend change signals
Momentum threshold crossovers
Other significant market conditions
Alerts can be customized and delivered through TradingView's notification system, making it easy to stay informed of important market developments even when you are away from the charts.
🟢 Practical Usage Tips
→ Trend Analysis and Interpretation: The indicator visualizes trend direction and strength directly on the chart through color-coding and the information panel, allowing traders and investors to immediately identify the current market context. This information helps in assessing the potential for continuation or reversal.
→ Signal Generation Strategies: The indicator generates potential trading signals based on trend direction, momentum confirmation, and selected sensitivity mode. Users can choose between Conservative (fewer but more reliable signals), Balanced (moderate approach), or Aggressive (more frequent but potentially less reliable signals).
→ Multi-Period Trend Assessment: Through its layered EMA approach, the indicator enables users to understand trend conditions across different lookback periods within the same timeframe. This helps in identifying the dominant trend and potential turning points.
🟢 Pro Tips
Adjust EMA periods based on your timeframe:
→ Lower values for shorter timeframes and more frequent signals
→ Higher values for higher timeframes and more reliable signals
Fine-tune sensitivity mode based on your trading style:
→ "Conservative" for position trading/long-term investing and fewer false signals
→ "Balanced" for swing trading/medium-term investing with moderate signal frequency
→ "Aggressive" for scalping/day trading and catching early trend changes
Look for confluence between components:
→ Strong trend strength percentage and direction in the information panel
→ Overall market context aligning with the expected direction
Use for multiple trading approaches:
→ Trend following during strong momentum periods
→ Counter-trend trading at band extremes during overextension
→ Early trend change detection with sensitivity adjustments
→ Stop loss placement using dynamic bands
Combine with:
→ Volume indicators for additional confirmation
→ Support/resistance analysis for strategic entry/exit points
→ Multiple timeframe analysis for broader market context

Grok CCI with DMF and 20 DMA FilterCCI Indicator that generates Buy and Sell signals, filtered with Dynamic money flow and a 14 Day moving average.
Shout out to RezzaHmt www.tradingview.com
for his Dynamic money flow Indicator.
This is still a work in progress.
Add it twice to your chart: One the main chart ( Uncheck all check boxes except the DMA and the Buy and Sell under style.)
One below the chart (Uncheck the Buy and Sell boxes and the Blue CCI box)

King Crypto Crossover BotThe Simple SMA Crossover Bot is a streamlined yet robust algorithmic signal generator, architected to detect dynamic trend inflection points using dual-period simple moving average convergence and divergence.
Leveraging the intersection logic of short-term and long-term moving averages, this system highlights potential breakout and reversal zones by precisely identifying crossover and crossunder events — critical junctures where bullish or bearish momentum transitions often begin.
Designed for traders who value clarity and precision, the bot deploys high-visibility chart markers and configurable real-time alert conditions, enabling seamless integration with webhook-based automation systems. This makes it ideal for hybrid manual-automated trading strategies or full automation when paired with third-party trade execution layers.
Whether used standalone or as part of a broader multi-indicator framework, this crossover engine offers a solid foundation for systematic trading strategies in crypto, forex, or equities markets.

TRAMA - Trend Regularity Adaptive Moving AverageThe TRAMA Line is an advanced, adaptive moving average that adjusts its speed based on market volatility. It’s designed to react quickly to price momentum shifts while filtering out noise — making it perfect for scalping, intraday, and swing trading.
What Makes It Special:
📊 Adaptive Sensitivity: Speeds up during high momentum, slows down during consolidation.
🎯 More responsive than traditional EMAs or SMAs, giving early signals without excessive false alarms.
🔄 Works great as a dynamic trend filter — price staying above = uptrend, below = downtrend.
🧠 Based on price movement regularity, which helps detect clean pullbacks and trend continuations.
In Your Indicator:
TRAMA acts as the main trend line to detect:
Trend direction
Pullbacks
Reversals
Combined with MACD, RSI, and ATR, it helps determine whether a move is likely to continue or reverse.

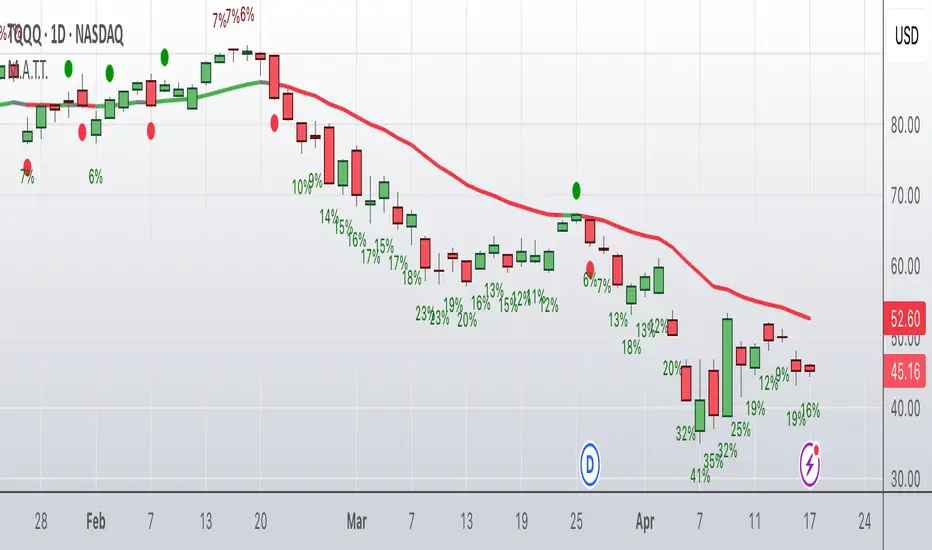
Moving Average Trend ToolsI. How M.A.T.T. Adds Value to the TradingView Community:
The "Moving Average Trend Tools" (M.A.T.T.) is a versatile Pine Script v6 indicator that empowers traders with clear trend analysis, reliable trade signals, and real-time insights. Its intuitive design and robust features make it a valuable addition to the TradingView Community Scripts by catering to traders of all levels. Here’s why it stands out:
Clear Trend Visualization: M.A.T.T. plots a moving average (MA) with dynamic coloring—green for rising, red for falling, and gray for flat—based on a user-defined lookback period. This simplifies trend interpretation, helping traders quickly assess market momentum.
Reliable Trade Signals : The script identifies price crossovers above or below the MA, plotting green circles for bullish crosses and red for bearish, confirmed on closed bars to prevent repainting. These signals guide entry and exit points for trend-following or reversal strategies.
Real-Time Extension Detection : M.A.T.T. calculates percentage price deviations from the MA, displaying real-time labels when thresholds (e.g., 6%) are exceeded. This highlights overextended moves, ideal for spotting reversals or pullbacks, with alerts to keep traders informed.
Extensive Customization : Traders can tailor the MA type (SMA, EMA, WMA, HMA), length, colors, line width, and label sizes. This flexibility supports diverse strategies across markets like stocks, forex, and crypto, from scalping to swing trading.
Automated Alerts : Alert conditions for crossovers and extensions integrate seamlessly with TradingView’s system, enabling traders to stay updated without constant chart monitoring.
M.A.T.T. combines trend analysis, signal generation, and overextension detection into a single, user-friendly tool. Its accessibility, reliability, and educational value for Pine Script learners make it a compelling contribution to the community.
II. What M.A.T.T. Does, How It Works, and Its Originality:
What It Does :
M.A.T.T. enhances trend analysis and trade decision-making through three core features:
Dynamic MA Visualization: Plots a customizable MA (SMA, EMA, WMA, or HMA) with trend-based coloring to reflect rising, falling, or flat market conditions.
Price Crossover Signals : Marks bullish (green circles) and bearish (red circles) crossovers, confirmed on closed bars, with alerts for trade opportunities.
Price Extension Labels : Displays real-time percentage deviations of price from the MA, with alerts when user-defined thresholds are breached, signaling potential reversals.
How It Works :
M.A.T.T. leverages Pine Script v6 for precise calculations and user-friendly outputs:
Inputs: Users select MA type, length, lookback period, colors, and thresholds for extensions, plus label styles and sizes for customization.
MA Calculation : A switch function computes the chosen MA (e.g., ta.ema(close, 21) for EMA). Trend direction is determined using ta.rising or ta.falling over the lookback period, coloring the MA accordingly.
Crossover Logic : Bullish crossovers (close > ma and close < ma ) and bearish crossovers (close < ma and close > ma ) are plotted as circles on confirmed bars (barstate.isconfirmed) to ensure reliability. Alerts trigger only on the first bar of a crossover.
Extension Logic : Percentage deviations are calculated as ((price - ma) / ma) * 100, using the high for above-MA extensions and low for below. Labels appear in real-time when thresholds are exceeded, with alerts on transitions to avoid noise.
Why It’s Original
M.A.T.T. distinguishes itself through a unique blend of features and thoughtful design:
All-in-One Design : It integrates dynamic MA coloring, non-repainting crossover signals, and real-time extension detection, addressing trend identification, trade signals, and overextension warnings in one tool—unlike most MA indicators that focus on a single aspect.
Real-Time Extension Labels : Displaying percentage deviations with customizable thresholds is a rare feature, ideal for volatile markets and not commonly found in standard scripts.
Non-Repainting Signals : Confirmed crossover signals enhance reliability for live trading, setting M.A.T.T. apart from less rigorous indicators.
Optimized Alert Condtions : Alerts trigger only on transitions (e.g., first bar of a crossover or extension), reducing noise and improving usability.
Visual and Functional Flexibility : Support for four MA types, extensive customization, and a clean interface (dynamic colors, tiny circles, clear labels) make it adaptable and user-friendly.
While MA plotting or crossovers exist elsewhere, M.A.T.T.’s seamless integration, real-time extension detection, alert conditions, and focus on reliability and customization create a distinctive, practical tool. Its balance of simplicity and sophistication makes it a unique asset for the TradingView community.
CVD (Cumulative Volume Delta)
Cumulative Volume Delta
Use a moving average with three different
I thought about determining the volatility and direction of the price of the stock price and finding a place to break through.
I made some Mistake coz I'm new corder
I'm reposting this simple script due to house rule violation. (Whatever can haha) 😁
I'm erasing all the comments in my native language that I had in my script... I thought it would make the User uncomfortable, so I locked the code, and I thought maybe that's the problem
Anyway, I'm sorry 😅
Jack's ADX with 5TF TABLEUpdated the table to show 5 timeframes.
When trend momentum aligns for added confirmation

EMA6–EMA18 Trend Signal SystemThis is a dual-timeframe trend-following indicator designed for intraday traders.
It combines exponential moving averages (EMAs) from two timeframes:
1-hour EMA6 and EMA18 are used to define the major trend direction.
If EMA6 > EMA18 on the hourly chart, the background turns green (indicating an uptrend).
If EMA6 < EMA18, the background turns red (indicating a downtrend).
Entry signals are triggered only on the 15-minute chart:
A long signal appears when EMA6 crosses above EMA18 during an hourly uptrend.
A short signal appears when EMA6 crosses below EMA18 during an hourly downtrend.
Signal arrows are plotted directly on the chart:
Green triangle up = Long signal
Red triangle down = Short signal
Both EMA6 and EMA18 are plotted for visual reference.
This setup helps align lower timeframe entries with higher timeframe trend confirmation, offering traders more precise entry points and reducing noise.
—
The script is intended for use on 15-minute charts and works best in trending markets.
© All rights reserved. Author: hank552

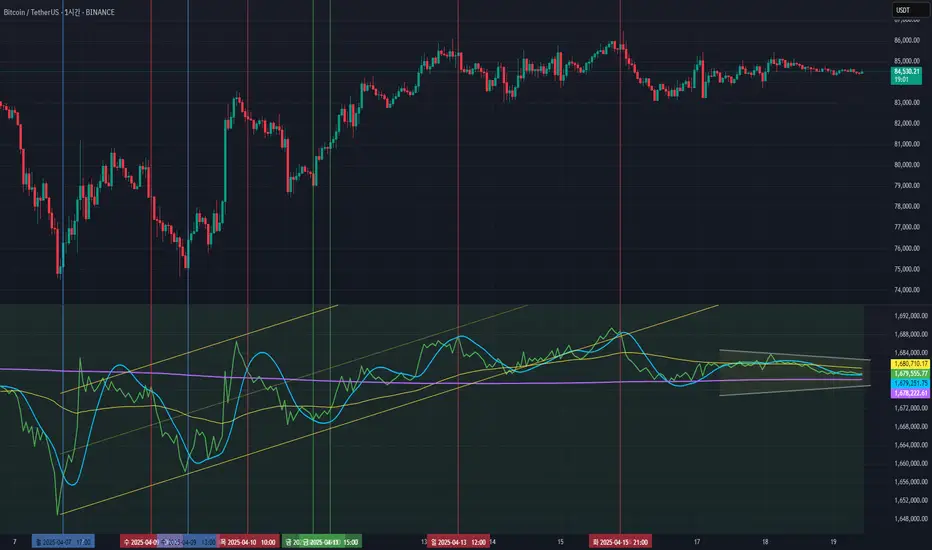
Wavelet Smoothed Moving Average (TechnoBlooms)Wavelet Smoothed Moving Average (WSMA) is a part of the Quantum Price Theory (QPT) Series of indicators.
Overview:
The Wavelet Smoothed Moving Average (WSMA) is a trend-following indicator inspired by multi-level Haar Wavelet decomposition. Rather than using traditional wavelet basis functions, it emulates the core wavelet concept of multi-resolution analysis using nested simple moving averages (SMA).
How It Works:
WSMA applies three levels of smoothing:
• Level 1: SMA on price (base smoothing)
• Level 2: SMA on Level 1 output (further denoising)
• Level 3: SMA on Level 2 output (final approximation)
Why Use WSMA:
• Multi-Level Smoothing: Captures price structure across multiple time scales, unlike single-length MAs.
• Noise Reduction: Filters out short-term volatility and focuses on the underlying trend.
• Low Lag, High Clarity: Unlike traditional moving averages that react slowly or miss subtle shifts, WSMA’s layered smoothing delivers cleaner and more adaptive trend detection.
Unique Value:
• Wavelet-Inspired Design: Mimics core wavelet decomposition logic without the complexity of downsampling or basis functions.
• Perfect for Trend Confirmation: The final line (a3) can act as a trend filter, while the detail levels can help identify momentum shifts and volatility bursts.
• Fits Into Quantum Price Theory: As part of the QPT framework, WSMA bridges scientific theory with trading application, giving traders a deeper understanding of market structure and signal compression.

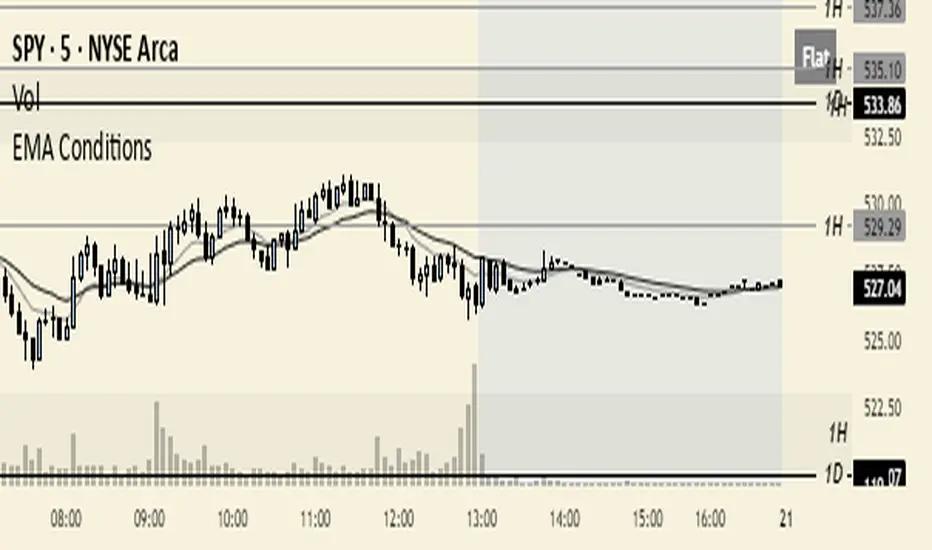
EMA ConditionsThis indicator was developed with the intention to display current market conditions according to the EMAs. There's a little box in the top right to display the conditions. I wanted to design something that shows already established market conditions, which is why I chose to use EMAs and candle closes as the source for identifying market conditions.
Personally, I scalp momentum in trending market conditions, so having an already established trend lets me know when it's appropriate for me to apply my edge on my lower time frame. I use a 5m time frame for my setups and this is where I apply this indicator. I designed the indicator to function off any time frame, so you can use this indicator with whatever time frame you want.
There are 5 conditions that I've set in place for this indicator, they're as follows:
1. Bullish conditions are met when price has closed 3+ consecutive candles over both EMAs (9 and 20 EMAs by default, but you can also choose what EMAs you want).
2. Bearish conditions are met when price has closed 3+ consecutive candles below both EMAs.
3. Reversal conditions are met when EMAs have crossed, and it will show those reversal conditions for the following 4 bars after the EMA cross over has taken place. Once there have been 4 bars closed, it will then show whatever condition is currently present.
4. Wait conditions are met when price is above/below (depending on direction of trend) the 9 ema.
- So in a bull trend, if price is below the 9 ema, it'll show "Wait"
5. Flat conditions are met when both EMAs are showing minimal changes in value over a specified number of candles. This indicates that EMAs are moving sideways and volatility is low. Likely in range bound or chop environments.
- The Flat threshold is adjustable. I have it set to 0.03% with a candle look back of 2 bars. This works the best for my edge, but you can set them to what you want.
The Flat and Wait conditions will override all other conditions. The Reversal conditions will override both Bullish and Bearish conditions. This way, when the indicator is showing Bullish or Bearish conditions, you'll know that nothing else is present.
Since I only trade in trending market conditions, I only trade when Bullish or Bearish conditions are met. If anything else is there then I'm not looking for my setups at that time. But you can use this however you'd like. If you like trading ranges, then trade when EMAs show flat. If you want to fade reversals and trade mean reversion, wait for a reversal condition to show and then look to fade that move. Get creative with it and with your edge. Don't put yourself in a box.
This indicator was made using Grok AI since I have no clue how to write code. I'll make the script available for everyone, so you can make adjustments yourself and do your own thing with it if you want.
If you have any questions or suggestions on how to improve the indicator, feel free to contact me on X: x.com
Anchored VWAP - RTH + ON + Previous VWAPRegular trading hours Anchored VWAP, Overnight Anchored VWAP, and Prior Day VWAP as Price Level

MTF Trend Fusion - V2MTF Trend Fusion - V2 (Pine Script® v5)
Description
This indicator is developed to support trading decisions by performing trend analysis based on multiple timeframes. An EMA (Exponential Moving Average) is calculated for three different timeframes (15 minutes, 1 hour, and 4 hours). Each of these EMAs is visualized separately, and buy and sell signals are generated based on these indicators. It provides users with information about trend direction and strong buying/selling opportunities.
Features
EMA Calculations: Three EMAs are calculated and plotted for different timeframes (15 minutes, 1 hour, 4 hours).
Trend Direction Detection: The trend direction is determined based on whether the price is above or below the three EMAs.
Trend Strength: The trend strength is calculated based on price movement relative to the EMAs.
Signals:
Buy Signal: When the price is above all the EMAs in all timeframes, a buy signal is generated.
Sell Signal: When the price is below all the EMAs in all timeframes, a sell signal is generated.
Background Color: The background color changes based on trend strength (green, lime, teal, red, etc.).
Usage
EMA Length: The length of the EMA to be calculated by the indicator is defined. The default value is 50.
Timeframes:
Timeframe 1: 15 minutes (tf1)
Timeframe 2: 1 hour (tf2)
Timeframe 3: 4 hours (tf3)
Buy and Sell Signals:
Buy Signal: A buy signal is generated when the price is above the EMAs in all three timeframes.
Sell Signal: A sell signal is generated when the price is below the EMAs in all three timeframes.
Background Color:
Green: Strong uptrend.
Lime: Medium strength uptrend.
Teal: Weak uptrend.
Red: Strong downtrend.
Maroon: Medium strength downtrend.
Gray: Uncertain trend.
Benefits to the User
Multiple Timeframe Analysis: This indicator uses EMAs calculated across three different timeframes, increasing the accuracy of trading decisions.
Easy Trend Detection: It's easy to determine whether the price is above or below the EMAs, allowing clear identification of the trend direction.
Signal Generation: Buy and sell signals are generated based on the trend strength, helping users make more accurate decisions.
Visual Aids: Background colors and signals are visually easy to track, enabling quick decision-making.
Code Explanations
EMA Calculations:
pinescript
Kopyala
Düzenle
ema1 = request.security(syminfo.tickerid, tf1, ta.ema(price, emaLength))
This code snippet calculates the EMA for the specified timeframe (tf1).
Trend Direction Detection:
pinescript
Kopyala
Düzenle
isAbove1 = price >= ema1
This checks if the price is greater than or equal to the EMA1.
Background Color Change: The background color is assigned based on trend strength:
pinescript
Kopyala
Düzenle
if aboveCount == 3
bgColor := color.new(color.green, 70)
When the trend is upward in all three timeframes, the background turns green.
Signal Generation: Buy and sell signals are generated based on specific conditions:
pinescript
Kopyala
Düzenle
bullishSignal = aboveCount == 3
bearishSignal = belowCount == 3
Alerts and Notifications
Buy Signal: A notification message titled "📈 Buy Signal" is sent to the user.
Sell Signal: A notification message titled "📉 Sell Signal" is sent to the user.
Use Cases of the Indicator
Trading Strategies: This indicator is especially useful in trend-following strategies. The EMAs and trend signals help identify entry and exit points.
Advanced Trading Decisions: Thanks to the multiple timeframe analysis, users get a broader perspective, rather than relying on just one timeframe.
Automated Trading: It can be integrated into automated trading strategies by using Pine Script's alert conditions.
Important Notes
Data Latency: Pine Script works only with available data. Therefore, the speed of data transitions can impact trading decisions.
Optimization: The indicator should be tested on longer timeframes. Caution is advised when using it for short-term trading.
This documentation can be shared with others or made public in compliance with TradingView policies.

MTF Trend Fusion - V1📌 MTF Trend Fusion - V1
Multi-Timeframe (MTF) Trend Indicator
🔍 Description: What Does It Do?
This indicator helps you visually analyze the overall market trend by combining Exponential Moving Averages (EMA) calculated on three different timeframes. It determines the trend direction by checking whether the price is above or below the EMAs from all selected timeframes.
The trend direction is clearly visualized through background color:
Green Background: Price is above the EMA on all three timeframes (bullish trend)
Red Background: Price is below the EMA on all three timeframes (bearish trend)
This approach aims to provide a more reliable trend confirmation by filtering out short-term misleading signals.
⚙️ How It Works
The script takes input from the user for three different timeframes and one EMA length. It calculates EMAs on those timeframes and determines the trend as follows:
If the price is above EMA1, EMA2, and EMA3 → Bullish signal
If the price is below EMA1, EMA2, and EMA3 → Bearish signal
In all other cases (mixed structure) → No signal
The background color is adjusted accordingly. All three EMAs are also plotted on the chart with different colors.
🛠️ How to Use
After activating the script, use the settings panel to select your desired three timeframes and the EMA length.
Regardless of your main chart's timeframe, this indicator analyzes the trend structure based on the selected timeframes.
You can quickly interpret the trend direction through the colored background.
🧠 Approach and Interpretation
This indicator helps you evaluate trend direction from a broader perspective using multi-timeframe (MTF) analysis. It focuses on understanding the overall direction rather than short-term price movements.
It can be particularly useful for:
Trend-following strategies
As a filter tool
Lower timeframe traders to see the higher timeframe trend direction
⚠️ Warnings & Recommendations
This is an indicator, not a strategy. It should not be used alone for buy/sell decisions.
Remember that EMA values are recalculated on different timeframes, which may introduce a delay effect.
Optimal settings may vary across markets and assets. Optimization is recommended.
📈 Default Settings
EMA Length: 50
Timeframe 1: 15 Minutes
Timeframe 2: 60 Minutes (1 Hour)
Timeframe 3: 240 Minutes (4 Hours)
💡 Why This Script?
This script goes beyond a simple EMA structure and offers a powerful tool for trend filtering. It reduces contradictions caused by different timeframes and provides stronger decision support.
With the combined EMA data:
Trend direction becomes clearer
False signals are filtered
The decision-making process is simplified
📌 Note: This indicator does not provide investment advice. It is designed to support your own analysis.

PG Mean revision price to vwma and MAsHere's a concise breakdown for your users:
- Selection of Moving Average Type:- Choose VWMA, EMA, or SMA, along with the source (e.g., closing price) and length for the calculation.
- Price-MA Difference Calculation:- Calculates the difference between the closing price and the selected moving average.
- Additional Moving Averages:- Applies three customizable moving averages (MA1, MA2, MA3) to the price-MA difference.
- Dynamic Plotting:- Plots the price-MA difference in red, and overlays the moving averages (blue, orange, purple). MA1 can be dynamically colored red/green based on its trend.
- Zero Reference Line:- Includes a horizontal line at zero for easy visual reference.
This tool helps analyze price trends and deviations for better trading decisions!

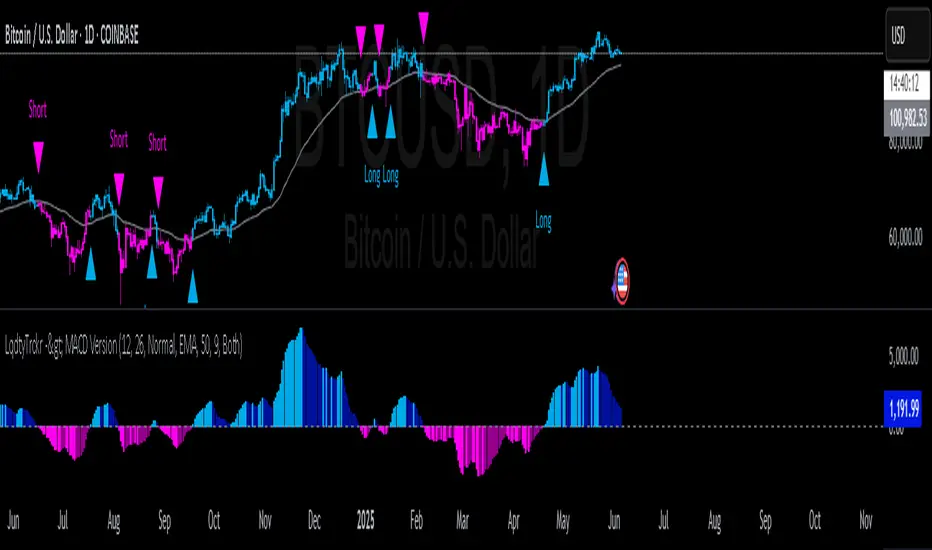
MACD Liquidity Tracker SystemMACD Liquidity Tracker System
🔹 Enhanced MACD with candle coloring, entry markers, and customizable signal logic.
🧠 Features:
This tool combines a color-coded MACD histogram with signal-based candle colors and small shape markers (🔼🔽) for clear market momentum and entry visualization.
📊 Visuals:
MACD Histogram (Sub-panel):
4 dynamic colors to show momentum direction:
🔹 Bright Blue = MACD > 0 & rising (strong bullish)
🔹 Dark Blue = MACD > 0 & falling (weakening bullish)
🔹 Bright Magenta = MACD < 0 & falling (strong bearish)
🔹 Dark Magenta = MACD < 0 & rising (weakening bearish)
Price Candles (Main Chart):
🔹 Bright Blue = Active Long signal
🔹 Bright Magenta = Active Short signal
Entry Markers:
🔼 Blue triangle (below candle) = Start of Long
🔽 Magenta triangle (above candle) = Start of Short
⚙️ System Types (select in settings):
Normal:
🔹 Long = MACD > 0
🔹 Short = MACD < 0
Fast: (Based on histogram color)
🔹 Long = Bright Blue OR Dark Magenta
🔹 Short = Dark Blue OR Bright Magenta
Safe:
🔹 Long = Only Bright Blue
🔹 Short = All other colors
🔔 Alerts:
Alerts trigger only on the first bar of a new Long/Short signal.
Easy to set up using TradingView’s alert system.
📌 How to Use:
Add the indicator to your chart
Open settings and select a System Type
Adjust MACD parameters if needed
Use histogram color + candle color for momentum and signal confirmation
Set alerts for clean entries if desired
💡 Ideal for traders seeking visual clarity and flexible MACD-based strategies.
EMA Crossover Strategy with Trailing Stop and AlertsPowerful EMA Crossover Strategy with Dynamic Trailing Stop and Real-Time Alerts
This strategy combines the simplicity and effectiveness of EMA crossovers with a dynamic trailing stop-loss mechanism for robust risk management.
**Key Features:**
* **EMA Crossover Signals:** Identifies potential trend changes using customizable short and long period Exponential Moving Averages.
* **Trailing Stop-Loss:** Automatically adjusts the stop-loss level as the price moves favorably, helping to protect profits and limit downside risk. The trailing stop percentage is fully adjustable.
* **Visual Buy/Sell Signals:** Clear buy (green upward label) and sell (red downward label) signals are plotted directly on the price chart.
* **Customizable Inputs:** Easily adjust the lengths of the short and long EMAs, as well as the trailing stop percentage, to optimize the strategy for different assets and timeframes.
* **Real-Time Alerts:** Receive instant alerts for buy and sell signals, ensuring you don't miss potential trading opportunities.
**How to Use:**
1. Add the strategy to your TradingView chart.
2. Customize the "Short EMA Length," "Long EMA Length," and "Trailing Stop Percentage" in the strategy's settings.
3. Enable alerts in TradingView to receive notifications when buy or sell signals are generated.
This strategy is intended to provide automated trading signals based on EMA crossovers with built-in risk management. Remember to backtest thoroughly on your chosen instruments and timeframes before using it for live trading.
#EMA
#Crossover
#TrailingStop
#Strategy
#TradingView
#TechnicalAnalysis
#Alerts
#TradingStrategy

网格交易v1.0### Strategy Function Overview
**Grid Trading Framework:**
- Set up 11 grid buy levels evenly distributed between `maxPrice` and `minPrice`.
- Fund allocation increases progressively with each lower grid level (weights 1–11), resulting in more buying at lower prices.
- The grid range is controlled by the `range1` parameter (default: -10%).
**Semi-Final and Final DCA (Dollar-Cost Averaging) Buys:**
- A larger buy order is triggered when the price drops to the `semifinal` level (default: -12%).
- The largest buy order is triggered when the price drops to the `final` level (default: -15%).
**Take-Profit Mechanism:**
- **Primary Take-Profit:** All holdings are sold for profit when the average entry price rises by `tp%`.
- **First Order Trailing Take-Profit:** If only the first order has been executed, a dynamic trailing take-profit is set based on ATR.
**Visualization Elements:**
- **Grid Lines and Labels:** Show the price and quantity at each buy level.
- **Price Lines:** Indicate the highest grid price, the current average entry price, and the take-profit target.
- **Event Markers:** Flag for start time, 🛑 for semi-final trigger, and 🚀 for final trigger.

3 EMAs w G/D Cross// This script plots three Exponential Moving Averages (EMAs): 20, 50, and 200.
// It highlights key trend signals by detecting:
// 🔹 Golden Cross – when the 50 EMA crosses above the 200 EMA (bullish signal)
// 🔹 Death Cross – when the 50 EMA crosses below the 200 EMA (bearish signal)
//
// A green cross will appear above the bar for a Golden Cross,
// and a red cross will appear below the bar for a Death Cross.
//
// These crossovers are commonly used to identify long-term trend shifts in the market.
// Suitable for trend-following strategies and identifying entry/exit zones.
//
// Script developed for educational and analytical use on TradingView. bu BusMart

MAEngineLibLibrary "MAEngineLib"
ma_sma(source, length)
Parameters:
source (float)
length (int)
ma_ema(source, length)
Parameters:
source (float)
length (simple int)
ma_dema(source, length)
Parameters:
source (float)
length (simple int)
ma_tema(source, length)
Parameters:
source (float)
length (simple int)
ma_wma(source, length)
Parameters:
source (float)
length (int)
ma_hma(source, length)
Parameters:
source (float)
length (simple int)
ma_vwma(source, length)
Parameters:
source (float)
length (int)
ma_kijun(length)
Parameters:
length (int)
ma_alma(source, length)
Parameters:
source (float)
length (int)
ma_kama(source, length)
Parameters:
source (float)
length (int)
ma_hullmod(source, length)
Parameters:
source (float)
length (int)
selectMA(type, source, length)
Parameters:
type (string)
source (float)
length (simple int)

DEMA Trend Oscillator Strategy📌 Overview
The DEMA Trend Oscillator Strategy is a dynamic trend-following approach based on the Normalized DEMA Oscillator SD.
It adapts in real-time to market volatility with the goal of improving entry accuracy and optimizing risk management.
⚠️ This strategy is provided for educational and research purposes only.
Past performance does not guarantee future results.
🎯 Strategy Objectives
The main goal of this strategy is to respond quickly to sudden price movements and trend reversals,
by combining momentum-based signals with volatility filters.
It is designed to be user-friendly for traders of all experience levels.
✨ Key Features
Normalized DEMA Oscillator: A momentum indicator that normalizes DEMA values on a 0–100 scale, allowing intuitive identification of trend strength
Two-Bar Confirmation Filter: Requires two consecutive bullish or bearish candles to reduce noise and enhance entry reliability
ATR x2 Trailing Stop: In addition to fixed stop-loss levels, a trailing stop based on 2× ATR is used to maximize profits during strong trends
📊 Trading Rules
Long Entry:
Normalized DEMA > 55 (strong upward momentum)
Candle low is above the upper SD band
Two consecutive bullish candles appear
Short Entry:
Normalized DEMA < 45 (downward momentum)
Candle high is below the lower SD band
Two consecutive bearish candles appear
Exit Conditions:
Take-profit at a risk-reward ratio of 1.5
Stop-loss triggered if price breaks below (long) or above (short) the SD band
Trailing stop activated based on 2× ATR to secure and extend profits
💰 Risk Management Parameters
Symbol & Timeframe: Any (AUDUSD 5M example)
Account size (virtual): $3000
Commission: 0.4PIPS(0.0004)
Slippage: 2 pips
Risk per trade: 5%
Number of trades (backtest):534
All parameters can be adjusted based on broker specifications and individual trading profiles.
⚙️ Trading Parameters & Considerations
Indicator: Normalized DEMA Oscillator SD
Parameter settings:
DEMA Period (len_dema): 40
Base Length: 20
Long Threshold: 55
Short Threshold: 45
Risk-Reward Ratio: 1.5
ATR Multiplier for Trailing Stop: 2.0
🖼 Visual Support
The chart displays the following visual elements:
Upper and lower SD bands (±2 standard deviations)
Entry signals shown as directional arrows
🔧 Strategy Improvements & Uniqueness
This strategy is inspired by “Normalized DEMA Oscillator SD” by QuantEdgeB,
but introduces enhancements such as a two-bar confirmation filter and an ATR-based trailing stop.
Compared to conventional trend-following strategies, it offers superior noise filtering and profit optimization.
✅ Summary
The DEMA Trend Oscillator Strategy is a responsive and practical trend-following method
that combines momentum detection with adaptive risk management.
Its visual clarity and logical structure make it a powerful and repeatable tool
for traders seeking consistent performance in trending markets.
⚠️ Always apply appropriate risk management. This strategy is based on historical data and does not guarantee future results.

Attrition Scalper - MTF# Attrition Scalper MTF Update
## What's Changed
Compared to previous Attrition Scalper versions, the channel and lines are now calculated using multi-timeframe (MTF) confluence with weighted averages.
The indicator is updated to PineScript V6.
I've removed redundant logic, inefficient buy/sell and high/low signals, and linear regression calculations to create a cleaner, more streamlined version that's both easier to use and provides a better foundation for future developments.
Using these lines every day has quickly made me realize that one line in one timeframe is usually in confluence with another line in another timeframe, and that price zone is usually much more reliable as a proper support/resistance or a mean reversion scalp zone.
The new logic checks one timeframe lower and one timeframe higher than the current timeframe the user is viewing and performs a weighted average calculation of 0.618 × lower TF + 1.0 × current TF + 0.786 × higher TF before plotting the lines.
Timeframes higher than weekly or lower than 5 minutes don't use MTF and instead just show the normal lines and the channel for that single timeframe similar to previous Attrition Scalper V2.
## Understanding the Lines
The Attrition Scalper generates several key reference lines that can help identify trade opportunities:
### Primary Reference Lines
- **Middle VIDYA and EVWMA (Middle Band)**: Usually represents the "mean" or equilibrium price. Price tends to gravitate back to this area during consolidation.
- **Green/Red VIDYA Lines**: These color-changing lines are your higher priority/reliable support/resistance levels.
### Fibonacci Extension Lines
- **Blue Lower Fibonacci Lines (0.618, 1.618, 2.618)**: Secondary support/resistance zones. While less significant than the VIDYA lines, these still provide valuable reference points for potential bounces.
- **Yellow 4.236 Fibonacci Lines**: These represent significant price overextension. When price reaches or exceeds these levels, expect a mean reversion move soon. These are the highest trust lines.
## Trading Applications
### Overextension & Mean Reversion
When price pushes above/below the yellow 4.236 Fibonacci line:
- This indicates an overextended market condition
- Probability of mean reversion increases significantly
- Consider counter-trend positions back toward the middle band
- Set targets near the middle VIDYA/EVWMA lines
- Higher timeframes = Higher reliability
- Don't panic and trust the process
### Support & Resistance Trading
- **Primary S/R Zones (Green/Red VIDYA)**: These are your highest probability bounce/rejection points. Pay special attention when price approaches these levels, especially on the first test.
- **Secondary S/R Zones (Blue Fib Lines)**: Use these as supplementary confirmation or for tighter stop placement or basic entries/TPs when laddering in and out.
## Best Practices
1. **Wait for Candle Close**: Trading signals are most reliable after a candle has fully closed above/below significant lines. Don't just take an instant long/short position when price goes above/below the outer yellow 4.236 fib line; wait for confirmation and candle close. Don't be sad if you miss an opportunity just because you waited—it's better this way in the long run.
2. **Respect Momentum**: Don't fight strong momentum just because price reached a line; wait for signs of reversal. Price almost always retraces, but it can be a small retracement only to inside the channel instead of going all the way back to the mean if the market is trending, OR it can stay overextended for an extended period of time (usually few candles max though). Sudden spikes all the way to the overextended zone are almost always a better position to take as a mean reversion play compared to long drawn out single direction trends. Don't fight the trend; take very small quick scalps given the opportunity.
3. **Use Confirmation Combined with Volume**: Look for rejection candles, engulfing patterns, or double tops/bottoms at key levels before entering. Strong volume at key lines increases the probability of a meaningful reaction. For example, at the end of an uptrend, if you see the price has spiked and is now overextended (out of the channel and above all the lines) and you see volume also spiking, that's almost always the top, at least for a while.
5. **Consider Volatility**: During high volatility, price may overshoot lines a lot (although very rare) before reversing; be patient and wait for confirmation. It could also be a news event, so always check before entering a position.
