Borjas Tarh Horizontals S/RBorjas Tarh Horizontals
Automatically Plot Horizontals Support and Resistance.
In the Setting, you should optimize the values according to each time frame of the ticker.
Pivot Length : Number of bars to use to calculate pivot
Max Breaks : Maximum number of times a line can be broken before it's invalidated
Max Distance % : Maximum distance PA can move away from line before it's invalidated
Frontrun/Overshoot Threshold % : If PA reverses within this distance of an existing S&R line, consider it a Frontrun / Overshoot
You can copy it and make it better.
Hashem

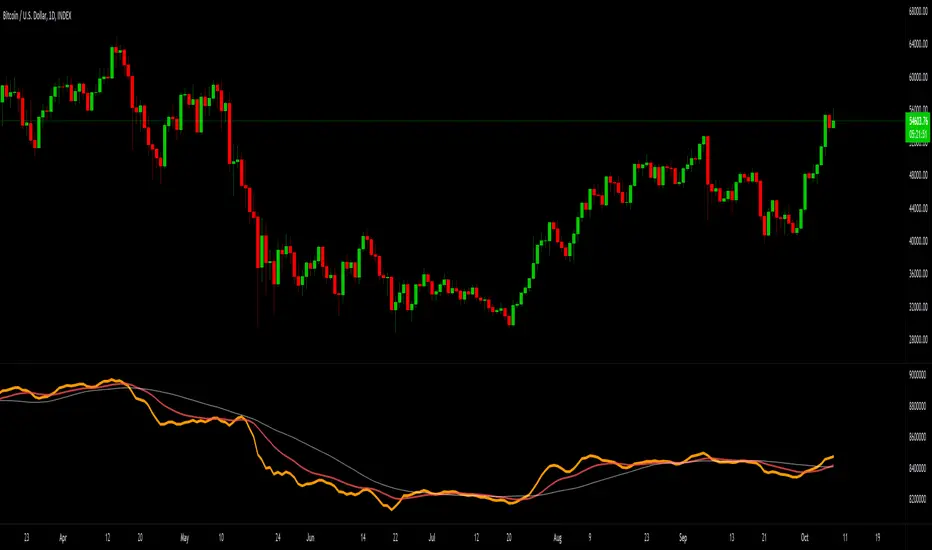
Hashem Correlation CoefficientCorrelation Coefficient
Core Code from: www.tradingview.com
This indicator Show Correlation between the Current Ticker & timeframe and a Customizable Ticker. After adding the indicator you can change the second ticker in the settings.
The Correlation Coeff is between -1 to 1 which 1 means 100% correlation and -1 means -100% correlation ( Inverse Correlation ).
The color of the area changes when:
Blue : CC > 0.5
Aqua : CC > 0.75
Purple : CC < -0.5
Red : CC < -0.75

Hashem OBV+EMA/MAThe On Balance Volume indicator (OBV) is used to measure buying and selling pressure.
It is a cumulative indicator meaning that on days where price went up, that day's volume is added to the cumulative OBV total. If price went down, then that day's volume is subtracted from the OBV total.
The OBV value is then plotted as a line for easy interpretation. OBV is primarily used to confirm or identify overall price Trends or to anticipate price movements after Divergences .
In addition to OBV, EMA and SMA are included. the EMA is used for Support and Resistances for the OBV. and the SMA is used by its Slope (can be S/R as well).
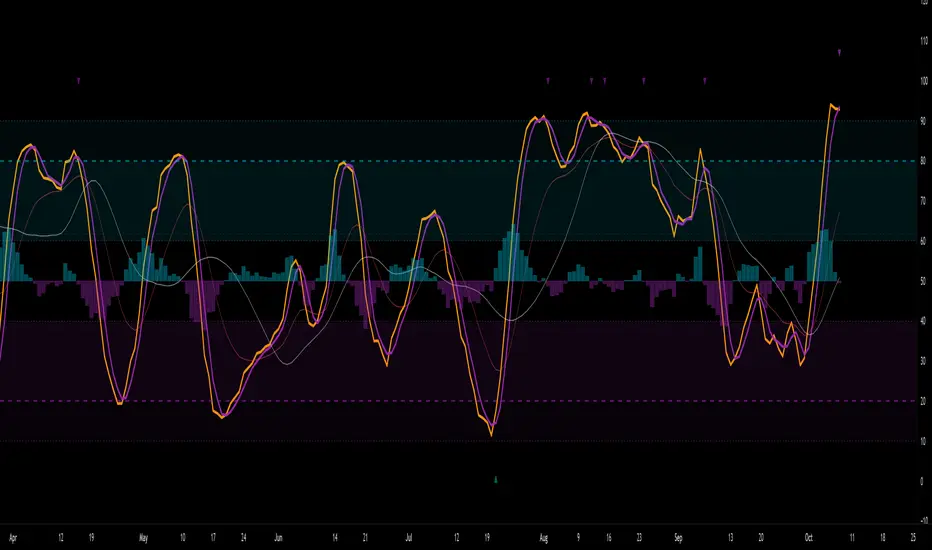
Hashem Extended Stochastic (V2)Extended Stochastic with All Zones. From Neutral to Danger Zones.
The Most Complete and Extended Stochastic Indicator.