Cash Flow YieldsCash Flow Yields Indicator
This indicator offers a straightforward way to visualize a company’s cash flow metrics—Free Cash Flow (FCF), Operating Cash Flow (OCF), and Capital Expenditures (CapEx)—as yields relative to its market capitalization. With the flexibility to switch between Trailing Twelve Months (TTM) and Quarterly data, it’s perfect for spotting financial efficiency trends at a glance. Values are plotted as dynamic lines with smart color coding and labeled for clarity.
Features:
TTM & Quarterly Data: Toggle between financial periods to suit your analysis.
Color-Coded Lines: Green for positive OCF, teal for positive FCF, and blue for CapEx. Red and maroon kick in when values turn negative.
Yield Perspective: See FCF, OCF, and CapEx as percentages of market cap, making it easy to compare cash flow strength across companies.
Clear Labels: The latest values pop up on the chart, positioned to the right of the last bar.
Simple & Intuitive: No clutter - just clean lines and numbers to help you focus on what matters.
To use it, add it to your chart and toggle between TTM or Quarterly to see trends. FCF should roughly equal OCF minus CapEx. Adjust your view to focus on companies with strong FCF yields for potential opportunities.
This indicator is freely available and open-source on TradingView for everyone to use. Enjoy!
Фундаментальный анализ

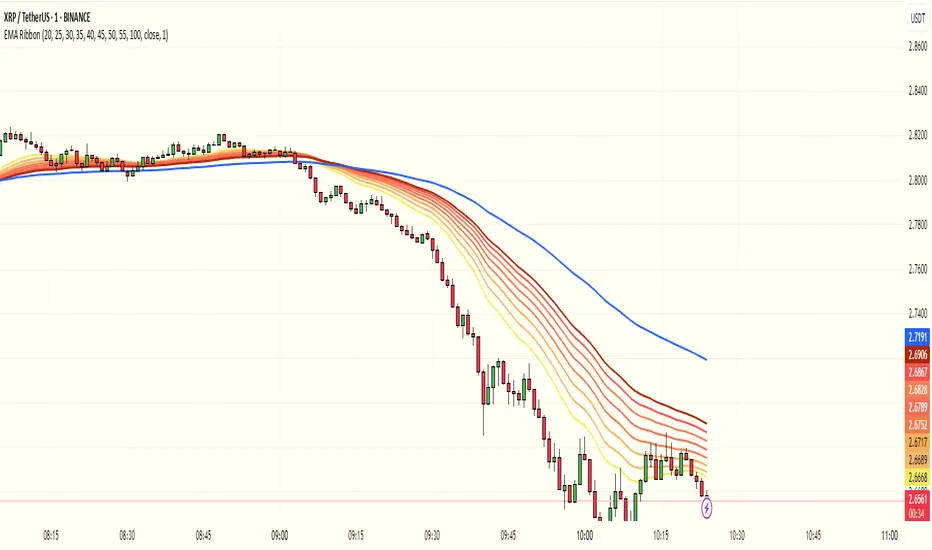
EMA Ribbon with 100 MA BY TIJUThe EMA Ribbon with 100 MA is a powerful and visually intuitive indicator designed to help traders identify trends, momentum, and potential support/resistance levels using multiple Exponential Moving Averages (EMAs). By plotting a series of EMAs with varying periods, the script creates a "ribbon" effect on the chart, making it easier to spot trend direction and strength at a glance.
Key Features:
Multiple EMAs for Trend Analysis:
The script plots 8 EMAs with periods ranging from 20 to 55, creating a gradient ribbon effect.
The 100-period EMA is added as a thick blue line, acting as a key level for long-term trend analysis.
Customizable Periods:
Each EMA period is fully customizable, allowing traders to tailor the indicator to their preferred trading style and timeframe.
Visual Clarity:
The EMAs are color-coded, making it easy to distinguish between different periods and identify the overall trend direction.
Dynamic Support/Resistance:
The EMAs act as dynamic support and resistance levels, helping traders identify potential entry and exit points.
Drop Candles Feature:
The script includes an option to drop the first N candles, ensuring cleaner calculations and avoiding false signals during the initial periods.
How to Use:
Trend Identification:
Uptrend: When the shorter-period EMAs are stacked above the longer-period EMAs, it indicates a strong uptrend.
Downtrend: When the longer-period EMAs are stacked above the shorter-period EMAs, it indicates a strong downtrend.
Consolidation: When the EMAs are intertwined, it suggests a sideways or weak trend.
Support/Resistance Levels:
Use the EMAs as dynamic support/resistance levels. For example, in an uptrend, the price may bounce off the lower EMAs.
100-Period EMA:
The 100-period EMA (thick blue line) acts as a key level for long-term trend analysis. A price above this line suggests a bullish bias, while a price below suggests a bearish bias.
Customization:
Adjust the EMA periods and colors to suit your trading strategy.
Use the Drop first N candles option to avoid false signals during the initial periods.
Example Use Cases:
Trend Following:
Enter long positions when the price is above the EMA ribbon and the EMAs are stacked in an uptrend.
Enter short positions when the price is below the EMA ribbon and the EMAs are stacked in a downtrend.
Dynamic Support/Resistance:
Use the EMAs as dynamic support/resistance levels for setting stop-loss or take-profit targets.
Confirmation Tool:
Combine the EMA Ribbon with other indicators (e.g., RSI, MACD) to confirm trade signals.
Settings:
MA-1 to MA-8 Periods: Adjust the periods for the 8 EMAs (default: 20, 25, 30, 35, 40, 45, 50, 55).
MA-100 Period: Adjust the period for the 100 EMA (default: 100).
Source: Choose the price source for the EMAs (default: Close).
Drop First N Candles: Drop the first N candles to avoid false signals (default: 1).
Why Use EMA Ribbon ?
Versatility: Suitable for all trading styles (scalping, day trading, swing trading) and timeframes.
Visual Appeal: The color-coded ribbon makes it easy to interpret the trend at a glance.
Customizable: Tailor the indicator to your specific trading strategy.
Dynamic Levels: Use the EMAs as dynamic support/resistance levels for better risk management.
Enhanced Doji Candle StrategyYour trading strategy is a Doji Candlestick Reversal Strategy designed to identify potential market reversals using Doji candlestick patterns. These candles indicate indecision in the market, and when detected, your strategy uses a Simple Moving Average (SMA) with a short period of 20 to confirm the overall market trend. If the price is above the SMA, the trend is considered bullish; if it's below, the trend is bearish.
Once a Doji is detected, the strategy waits for one or two consecutive confirmation candles that align with the market trend. For a bullish confirmation, the candles must close higher than their opening price without significant bottom wicks. Conversely, for a bearish confirmation, the candles must close lower without noticeable top wicks. When these conditions are met, a trade is entered at the market price.
The risk management aspect of your strategy is clearly defined. A stop loss is automatically placed at the nearest recent swing high or low, with a tighter distance of 5 pips to allow for more trading opportunities. A take-profit level is set using a 2:1 reward-to-risk ratio, meaning the potential reward is twice the size of the risk on each trade.
Additionally, the strategy incorporates an early exit mechanism. If a reversal Doji forms in the opposite direction of your trade, the position is closed immediately to minimize losses. This strategy has been optimized to increase trade frequency by loosening the strictness of Doji detection and confirmation conditions while still maintaining sound risk management principles.
The strategy is coded in Pine Script for use on TradingView and uses built-in indicators like the SMA for trend detection. You also have flexible parameters to adjust risk levels, take-profit targets, and stop-loss placements, allowing you to tailor the strategy to different market conditions.

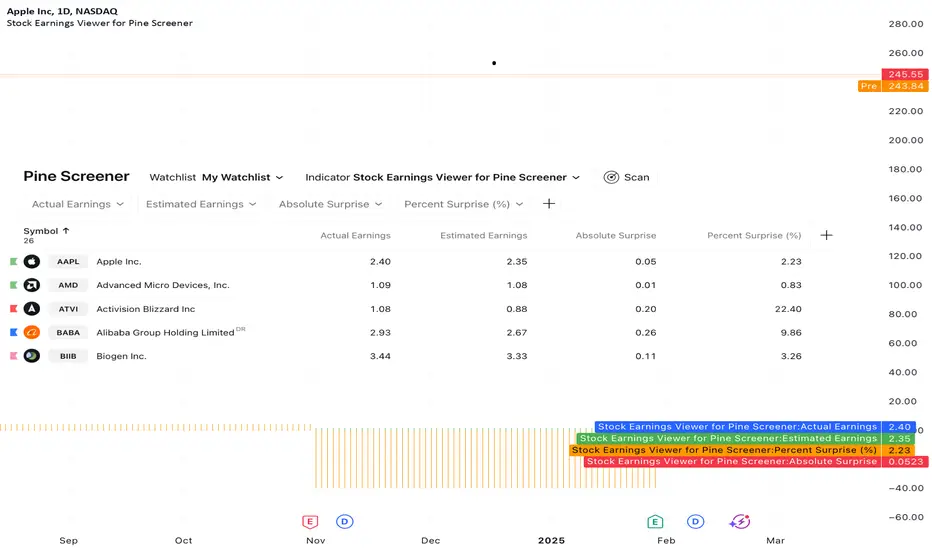
Stock Earnings Viewer for Pine ScreenerThe script, titled "Stock Earnings Viewer with Surprise", fetches actual and estimated earnings, calculates absolute and percent surprise values, and presents them for analysis. It is intended to use in Pine Screener, as on chart it is redundant.
How to Apply to Pine Screener
Favorite this script
Open pine screener www.tradingview.com
Select "Stock Earnings Viewer with Surprise" in "Choose indicator"
Click "Scan"
Data
Actual Earnings: The reported earnings per share (EPS) for the stock, sourced via request.earnings().
Estimated Earnings: Analyst-predicted EPS, accessed with field=earnings.estimate.
Absolute Surprise: The difference between actual and estimated earnings (e.g., actual 1.2 - estimated 1.0 = 0.2).
Percent Surprise (%): The absolute surprise as a percentage of estimated earnings (e.g., (0.2 / 1.0) * 100 = 20%). Note: This may return NaN or infinity if estimated earnings are zero, due to division by zero.
Practical Use
This screener script allows users to filter stocks based on earnings metrics. For example, you could screen for stocks where Percent Surprise > 15 to find companies exceeding analyst expectations significantly, or use Absolute Surprise < -0.5 to identify underperformers.
EPS Line Indicator - cristianhkrOverview
The EPS Line Indicator displays the Earnings Per Share (EPS) of a publicly traded company directly on a TradingView chart. It provides a historical trend of EPS over time, allowing investors to track a company's profitability per share.
Key Features
📊 Plots actual EPS data for the selected stock.
📅 Updates quarterly as new EPS reports are released.
🔄 Smooths missing values by holding the last reported EPS.
🔍 Helps track long-term profitability trends.
How It Works
The script retrieves quarterly EPS using request.financial(syminfo.tickerid, "EARNINGS_PER_SHARE", "Q", barmerge.gaps_off).
If EPS data is missing for a given period, the last available EPS value is retained to maintain continuity.
The EPS values are plotted as a continuous green line on the chart.
A baseline at EPS = 0 is included to easily identify profitable vs. loss-making periods.
How to Use This Indicator
If the EPS line is trending upwards 📈 → The company is growing earnings per share, a strong sign of profitability.
If the EPS line is declining 📉 → The company’s EPS is shrinking, which may indicate financial weakness.
If EPS is negative (below zero) ❌ → The company is reporting losses per share, which can be a warning sign.
Limitations
Only works with stocks that report EPS data (not applicable to cryptocurrencies or commodities).
Does not adjust for stock splits or other corporate actions.
Best used on daily, weekly, or monthly charts for clear earnings trends.
Conclusion
This indicator is a powerful tool for investors who want to visualize earnings per share trends directly on a price chart. By showing how EPS evolves over time, it helps assess a company's profitability trajectory, making it useful for both fundamental analysis and long-term investing.
🚀 Use this indicator to track EPS growth and make smarter investment decisions!

CAPE / Shiller PE Ratio - cristianhkrThe Cyclically Adjusted Price-to-Earnings Ratio (CAPE Ratio), also known as the Shiller P/E Ratio, is a long-term valuation measure for stocks. It was developed by Robert Shiller and smooths out earnings fluctuations by using an inflation-adjusted average of the last 10 years of earnings.
This TradingView Pine Script indicator calculates the CAPE Ratio for a specific stock by:
Fetching historical Earnings Per Share (EPS) data using request.earnings().
Adjusting the EPS for inflation by dividing it by the Consumer Price Index (CPI).
Computing the 10-year (40-quarter) moving average of the inflation-adjusted EPS.
Calculating the CAPE Ratio as (Stock Price) / (10-year Average EPS adjusted for inflation).
Plotting the CAPE Ratio on the chart with a reference line at CAPE = 20, a historically significant threshold.

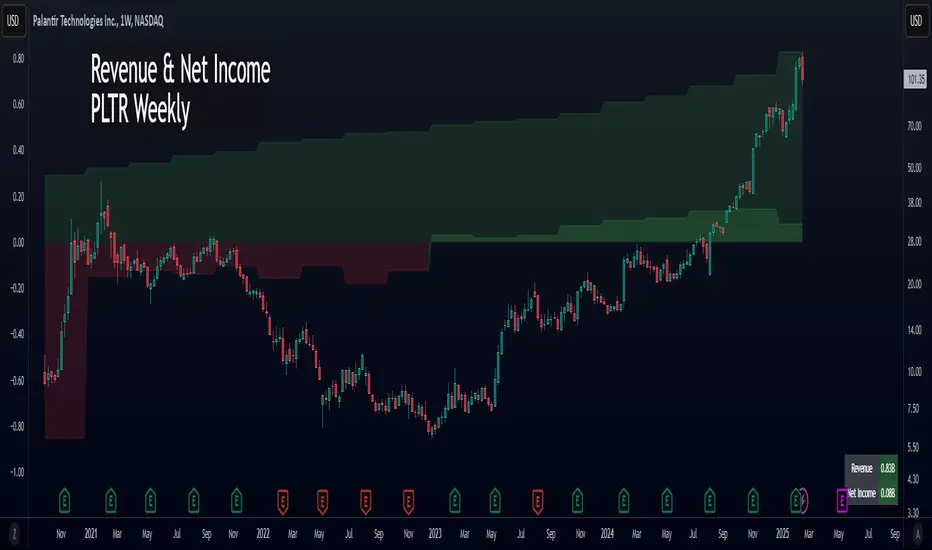
Revenue & Net IncomeRevenue & Net Income Indicator
This indicator provides a clear visual representation of a company's revenue and net income, with the flexibility to switch between Trailing Twelve Months (TTM) and Quarterly data. Values are automatically converted into billions and displayed in both an area chart and a dynamic table.
Features:
TTM & Quarterly Data: Easily toggle between financial periods.
Intuitive Visuals: Semi-transparent area charts make trends easy to spot.
Smart Number Formatting: Revenue below 1B is shown with two decimals (e.g., "0.85B"), while larger values use one decimal (e.g., "1.2B").
Customizable Table: Displays the most recent revenue and net income figures, with adjustable position and text size.
Light Mode: Switch table text to black with a white header for better readability on light backgrounds.
This indicator is freely available and open-source on TradingView for all. It is designed to help traders enhance their market analysis and strategic decision-making.
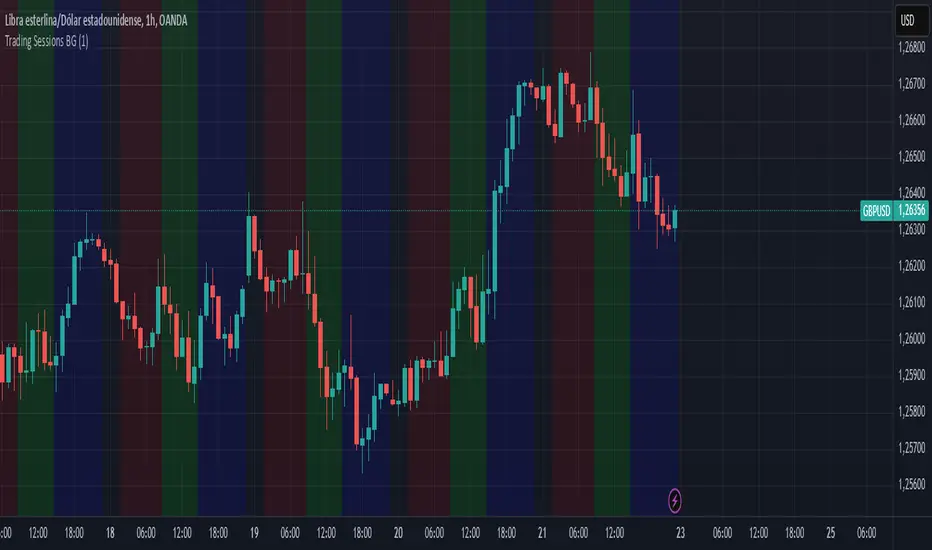
Trading Sessions Background ColorTrading Sessions Background Color
This indicator provides a visual representation of the major trading sessions — Asia, London, and USA — by applying distinct background colors to the chart. It allows traders to easily identify active market hours and session overlaps.
Features:
Customizable Sessions: Users can modify time ranges, and colors according to their preferences.
Predefined Major Trading Sessions: The indicator includes Asia, London, and USA sessions by default.
Time Zone Adjustment: A configurable UTC offset ensures accurate session display.
Clear Visual Differentiation: Background colors indicate when each session is active.
Usage Instructions:
Apply the indicator to a TradingView chart.
Adjust session settings and time zone offset as needed.
The chart background will update dynamically to reflect the active trading session.
Monthly Buy IndicatorIt shows us the the total balance when buying monthly, ploting the total invested amount and total current balance along the time.
Opening the Data Window, it displays the profit (%) and the number of trades.
The "Allow Fractional Purchase" flag can be used to check the the performance of the ticker, disregarding how much the monthly amount is set vs the price of the ticker.
The trades are considering buying the available amount on the 1st candle of each month, at the Open price. The "Total Balance" considers the close price of each candle.

RV- Intrinsic Value AnalyzerWhy These Metrics Matter in IVA Pro (Intrinsic Value Analyzer)?
The IVA Pro consolidates key valuation, profitability, and efficiency metrics into a single, easy-to-read table. These indicators provide a comprehensive view of a company’s financial health, helping traders and investors make informed decisions based on growth potential, profitability, and valuation. The color-coded signals (green for strong, orange for moderate, and red for weak values) simplify fundamental analysis and enable quick comparisons across different stocks.
Key Fundamental Parameters in IVA Pro
Market Capitalization (Market Cap): Measures a company's total market value, helping assess size, stability, and growth potential.
Earnings Yield (TTM): Indicates how much profit a company generates relative to its stock price—useful for comparing against bonds and other assets.
Return on Capital Employed (ROCE): Shows how efficiently a company generates profits using its capital—a key profitability metric.
Return on Equity (ROE): Evaluates how well a company uses shareholder funds to generate earnings.
Price-to-Earnings Ratio (PE): Helps determine whether a stock is overvalued or undervalued based on earnings.
Price-to-Book Ratio (PB): Assesses if a stock is trading above or below its net asset value—useful for asset-heavy industries.
Price-to-Sales Ratio (PS): Helps evaluate revenue potential, particularly for growth-stage companies.
PEG Ratio: Enhances PE ratio by factoring in earnings growth—ideal for identifying undervalued growth stocks.
Forward PE Ratio: Provides a future-looking valuation based on projected earnings.
Forward PS Ratio: Helps evaluate future revenue potential and overall stock valuation.

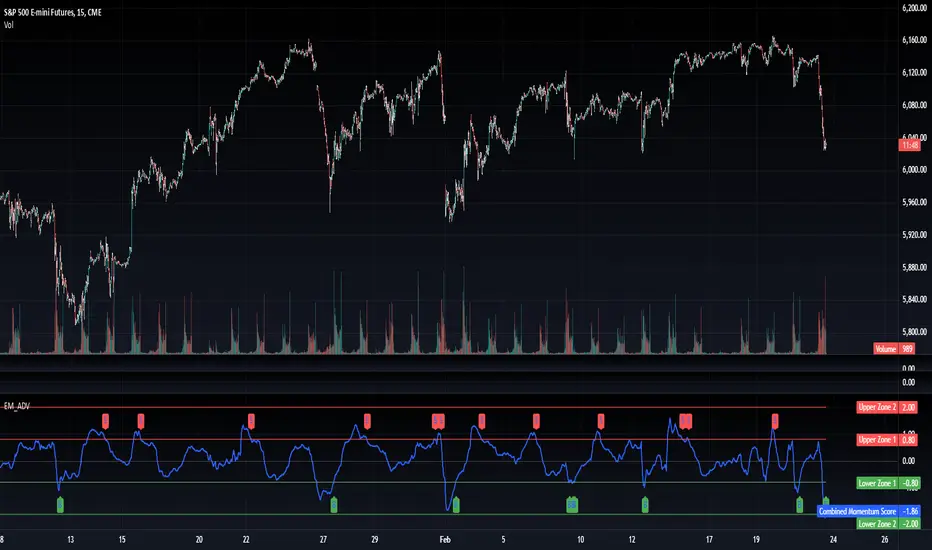
TradFi Fundamentals: Enhanced Macroeconomic Momentum Trading Introduction
The "Enhanced Momentum with Advanced Normalization and Smoothing" indicator is a tool that combines traditional price momentum with a broad range of macroeconomic factors. I introduced the basic version from a research paper in my last script. This one leverages not only the price action of a security but also incorporates key economic data—such as GDP, inflation, unemployment, interest rates, consumer confidence, industrial production, and market volatility (VIX)—to create a comprehensive, normalized momentum score.
Previous indicator
Explanation
In plain terms, the indicator calculates a raw momentum value based on the change in price over a defined lookback period. It then normalizes this momentum, along with several economic indicators, using a method chosen by the user (options include simple, exponential, or weighted moving averages, as well as a median absolute deviation (MAD) approach). Each normalized component is assigned a weight reflecting its relative importance, and these weighted values are summed to produce an overall momentum score.
To reduce noise, the combined momentum score can be further smoothed using a user-selected method.
Signals
For generating trade signals, the indicator offers two modes:
Zero Cross Mode: Signals occur when the smoothed momentum line crosses the zero threshold.
Zone Mode: Overbought and oversold boundaries (which are user defined) provide signals when the momentum line crosses these preset limits.
Definition of the Settings
Price Momentum Settings:
Price Momentum Lookback: The number of days used to compute the percentage change in price (default 50 days).
Normalization Period (Price Momentum): The period over which the price momentum is normalized (default 200 days).
Economic Data Settings:
Normalization Period (Economic Data): The period used to normalize all economic indicators (default 200 days).
Normalization Method: Choose among SMA, EMA, WMA, or MAD to standardize both price and economic data. If MAD is chosen, a multiplier factor is applied (default is 1.4826).
Smoothing Options:
Apply Smoothing: A toggle to enable further smoothing of the combined momentum score.
Smoothing Period & Method: Define the period and type (SMA, EMA, or WMA) used to smooth the final momentum score.
Signal Generation Settings:
Signal Mode: Select whether signals are based on a zero-line crossover or by crossing user-defined overbought/oversold (OB/OS) zones.
OB/OS Zones: Define the upper and lower boundaries (default upper zones at 1.0 and 2.0, lower zones at -1.0 and -2.0) for zone-based signals.
Weights:
Each component (price momentum, GDP, inflation, unemployment, interest rates, consumer confidence, industrial production, and VIX) has an associated weight that determines its contribution to the overall score. These can be adjusted to reflect different market views or risk preferences.
Visual Aspects
The indicator plots the smoothed combined momentum score as a continuous blue line against a dotted zero-line reference. If the Zone signal mode is selected, the indicator also displays the upper and lower OB/OS boundaries as horizontal lines (red for overbought and green for oversold). Buy and sell signals are marked by small labels ("B" for buy and "S" for sell) that appear at the bottom or top of the chart when the score crosses the defined thresholds, allowing traders to quickly identify potential entry or exit points.
Conclusion
This enhanced indicator provides traders with a robust approach to momentum trading by integrating traditional price-based signals with a suite of macroeconomic indicators. Its normalization and smoothing techniques help reduce noise and mitigate the effects of outliers, while the flexible signal generation modes offer multiple ways to interpret market conditions. Overall, this tool is designed to deliver a more nuanced perspective on market momentum.
Cryptolabs Global Liquidity Cycle Momentum IndicatorCryptolabs Global Liquidity Cycle Momentum Indicator (LMI-BTC)
This open-source indicator combines global central bank liquidity data with Bitcoin price movements to identify medium- to long-term market cycles and momentum phases. It is designed for traders who want to incorporate macroeconomic factors into their Bitcoin analysis.
How It Works
The script calculates a Liquidity Index using balance sheet data from four central banks (USA: ECONOMICS:USCBBS, Japan: FRED:JPNASSETS, China: ECONOMICS:CNCBBS, EU: FRED:ECBASSETSW), augmented by the Dollar Index (TVC:DXY) and Chinese 10-year bond yields (TVC:CN10Y). This index is:
- Logarithmically scaled (math.log) to better represent large values like central bank balances and Bitcoin prices.
- Normalized over a 50-period range to balance fluctuations between minimum and maximum values.
- Compared to prior-year values, with the number of bars dynamically adjusted based on the timeframe (e.g., 252 for 1D, 52 for 1W), to compute percentage changes.
The liquidity change is analyzed using a Chande Momentum Oscillator (CMO) (period: 24) to measure momentum trends. A Weighted Moving Average (WMA) (period: 10) acts as a signal line. The Bitcoin price is also plotted logarithmically to highlight parallels with liquidity cycles.
Usage
Traders can use the indicator to:
- Identify global liquidity cycles influencing Bitcoin price trends, such as expansive or restrictive monetary policies.
- Detect momentum phases: Values above 50 suggest overbought conditions, below -50 indicate oversold conditions.
- Anticipate trend reversals by observing CMO crossovers with the signal line.
It performs best on higher timeframes like daily (1D) or weekly (1W) charts. The visualization includes:
- CMO line (green > 50, red < -50, blue neutral), signal line (white), Bitcoin price (gray).
- Horizontal lines at 50, 0, and -50 for improved readability.
Originality
This indicator stands out from other momentum tools like RSI or basic price analysis due to:
- Unique Data Integration: Combines four central bank datasets, DXY, and CN10Y as macroeconomic proxies for Bitcoin.
- Dynamic Prior-Year Analysis: Calculates liquidity changes relative to historical values, adjustable by timeframe.
- Logarithmic Normalization: Enhances visibility of extreme values, critical for cryptocurrencies and macro data.
This combination offers a rare perspective on the interplay between global liquidity and Bitcoin, unavailable in other open-source scripts.
Settings
- CMO Period: Default 24, adjustable for faster/slower signals.
- Signal WMA: Default 10, for smoothing the CMO line.
- Normalization Window: Default 50 periods, customizable.
Users can modify these parameters in the Pine Editor to tailor the indicator to their strategy.
Note
This script is designed for medium- to long-term analysis, not scalping. For optimal results, combine it with additional analyses (e.g., on-chain data, support/resistance levels). It does not guarantee profits but supports informed decisions based on macroeconomic trends.
Data Sources
- Bitcoin: INDEX:BTCUSD
- Liquidity: ECONOMICS:USCBBS, FRED:JPNASSETS, ECONOMICS:CNCBBS, FRED:ECBASSETSW
- Additional: TVC:DXY, TVC:CN10Y

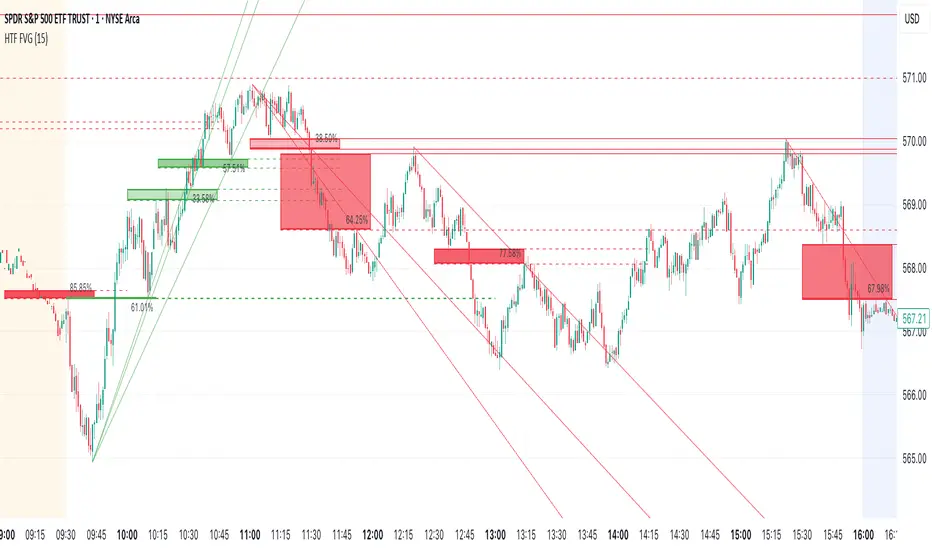
Higher Time Frame Fair Value Gap [ZeroHeroTrading]A fair value gap (FVG) highlights an imbalance area between market participants, and has become popular for technical analysis among price action traders.
A bullish (respectively bearish) fair value gap appears in a triple-candle pattern when there is a large candle whose previous candle’s high (respectively low) and subsequent candle’s low (respectively high) do not fully overlap the large candle. The space between these wicks is known as the fair value gap.
The following script aims at identifying higher timeframe FVG's within a lower timeframe chart. As such, it offers a unique perspective on the formation of FVG's by combining the multiple timeframe data points in the same context.
You can change the indicator settings as you see fit to achieve the best results for your use case.
Features
It draws higher timeframe bullish and bearish FVG's on the chart.
For bullish (respectively bearish) higher timeframe FVG's, it adds the buying (respectively selling) pressure as a percentage ratio of the up (respectively down) volume of the second higher timeframe bar out of the total up (respectively down) volume of the first two higher timeframe bars.
It adds a right extended trendline from the most recent lowest low (respectively highest high) to the top (respectively bottom) of the higher timeframe bullish (respectively bearish) FVG.
It detects and displays higher timeframe FVG's as early as one starts forming.
It detects and displays lower timeframe (i.e. chart's timeframe) FVG's upon confirmation.
It allows for skipping inside first bars when evaluating FVG's.
It allows for dismissing higher timeframe FVG's if there is no update for any period of the chart's timeframe. For instance, this can occur at lower timeframes during low trading activity periods such as extended hours.
Settings
Higher Time Frame FVG dropdown: Selects the higher timeframe to run the FVG detection on. Default is 15 minutes. It must be higher than, and a multiple of, the chart's timeframe.
Higher Time Frame FVG color select: Selects the color of the text to display for higher timeframe FVG's. Default is black.
Show Trend Line checkbox: Turns on/off trendline display. Default is on.
Show Lower Time Frame FVG checkbox: Turns on/off lower timeframe (i.e. chart's timeframe) FVG detection. Default is on.
Show Lower Time Frame FVG color select: Selects the color of the border for lower timeframe (i.e. chart's timeframe) FVG's. Default is white.
Include Inside Bars checkbox: Turns on/off the inclusion of inside first bars when evaluating FVG's. Default is on.
With Consistent Updates checkbox: Turns on/off consistent updates requirement. Default is on.
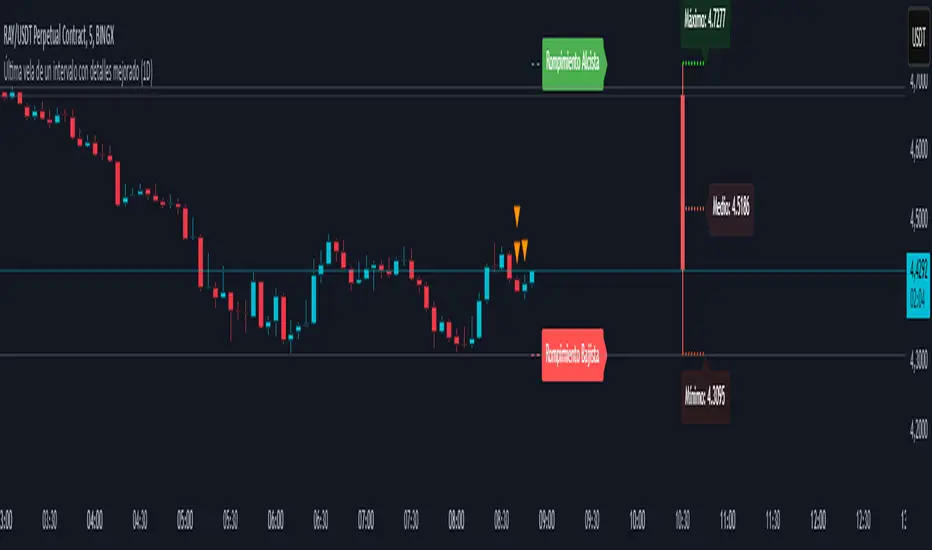
Enhanced Interval Candle with Breakout Detection and Detailed InThis indicator visualizes the last candle of a user-defined time interval (e.g., 1 hour, 4 hours, 1 day) on the current chart, providing enhanced details and breakout detection. It fetches the open, high, low, and close prices of the interval candle and draws a stylized representation of it, offset to the right of the current bar. The candle body and wicks are colored according to whether the interval candle closed bullishly (green) or bearishly (red). In addition to the candle itself, the indicator displays horizontal dotted lines representing the high, low, and midpoint of the interval candle, along with labels showing their exact values. These labels are dynamically updated as the interval candle changes. Furthermore, the script detects and visualizes breakouts of the interval candle's high or low. When the current price closes above the interval high, a green dashed line and a "Bullish Breakout" label are displayed. Conversely, when the current price closes below the interval low, a red dashed line and a "Bearish Breakout" label are shown. The breakout lines and labels are also dynamically updated. This indicator helps traders easily track the price action of a higher timeframe candle and spot potential breakouts based on that candle's range. The user can configure the time interval to suit their trading needs.
TradFi Fundamentals: Momentum Trading with Macroeconomic DataIntroduction
This indicator combines traditional price momentum with key macroeconomic data. By retrieving GDP, inflation, unemployment, and interest rates using security calls, the script automatically adapts to the latest economic data. The goal is to blend technical analysis with fundamental insights to generate a more robust momentum signal.
Original Research Paper by Mohit Apte, B. Tech Scholar, Department of Computer Science and Engineering, COEP Technological University, Pune, India
Link to paper
Explanation
Price Momentum Calculation:
The indicator computes price momentum as the percentage change in price over a configurable lookback period (default is 50 days). This raw momentum is then normalized using a rolling simple moving average and standard deviation over a defined period (default 200 days) to ensure comparability with the economic indicators.
Fetching and Normalizing Economic Data:
Instead of manually inputting economic values, the script uses TradingView’s security function to retrieve:
GDP from ticker "GDP"
Inflation (CPI) from ticker "USCCPI"
Unemployment rate from ticker "UNRATE"
Interest rates from ticker "USINTR"
Each series is normalized over a configurable normalization period (default 200 days) by subtracting its moving average and dividing by its standard deviation. This standardization converts each economic indicator into a z-score for direct integration into the momentum score.
Combined Momentum Score:
The normalized price momentum and economic indicators are each multiplied by user-defined weights (default: 50% price momentum, 20% GDP, and 10% each for inflation, unemployment, and interest rates). The weighted components are then summed to form a comprehensive momentum score. A horizontal zero line is plotted for reference.
Trading Signals:
Buy signals are generated when the combined momentum score crosses above zero, and sell signals occur when it crosses below zero. Visual markers are added to the chart to assist with trade timing, and alert conditions are provided for automated notifications.
Settings
Price Momentum Lookback: Defines the period (in days) used to compute the raw price momentum.
Normalization Period for Price Momentum: Sets the window over which the price momentum is normalized.
Normalization Period for Economic Data: Sets the window over which each macroeconomic series is normalized.
Weights: Adjust the influence of each component (price momentum, GDP, inflation, unemployment, and interest rate) on the overall momentum score.
Conclusion
This implementation leverages TradingView’s economic data feeds to integrate real-time macroeconomic data into a momentum trading strategy. By normalizing and weighting both technical and economic inputs, the indicator offers traders a more holistic view of market conditions. The enhanced momentum signal provides additional context to traditional momentum analysis, potentially leading to more informed trading decisions and improved risk management.
The next script I release will be an improved version of this that I have added my own flavor to, improving the signals.

Blockchain Fundamentals: Liquidity Cycle MomentumLiquidity Cycle Momentum Indicator
Overview:
This indicator analyzes global liquidity trends by calculating a unique Liquidity Index and measuring its year-over-year (YoY) percentage change. It then applies a momentum oscillator to the YoY change, providing insights into the cyclical momentum of liquidity. The indicator incorporates a limited historical data workaround to ensure accurate calculations even when the chart’s history is short.
Features Breakdown:
1. Limited Historical Data Workaround
Function: The limit(length) function adjusts the lookback period when there isn’t enough historical data (i.e., near the beginning of the chart), ensuring that calculations do not break due to insufficient data.
2. Global Liquidity Calculation
Data Sources:
TVC:CN10Y (10-year yield from China)
TVC:DXY (US Dollar Index)
ECONOMICS:USCBBS (US Central Bank Balance Sheet)
FRED:JPNASSETS (Japanese assets)
ECONOMICS:CNCBBS (Chinese Central Bank Balance Sheet)
FRED:ECBASSETSW (ECB assets)
Calculation Methodology:
A ratio is computed (cn10y / dxy) to adjust for currency influences.
The Liquidity Index is then derived by multiplying this ratio with the sum of the other liquidity components.
3. Year-over-Year (YoY) Percent Change
Computation:
The indicator determines the number of bars that approximately represent one year.
It then compares the current Liquidity Index to its value one year ago, calculating the YoY percentage change.
4. Momentum Oscillator on YoY Change
Oscillator Components:
1. Calculated using the Chande Momentum Oscillator (CMO) applied to the YoY percent change with a user-defined momentum length.
2. A weighted moving average (WMA) that smooths the momentum signal.
3. Overbought and Oversold zones
Signal Generation:
Buy Signal: Triggered when the momentum crosses upward from an oversold condition, suggesting a potential upward shift in liquidity momentum.
Sell Signal: Triggered when crosses below an overbought condition, indicating potential downward momentum.
State Management:
The indicator maintains a state variable to avoid repeated signals, ensuring that a new buy or sell signal is only generated when there’s a clear change in momentum.
5. Visual Presentation and Alerts
Plots:
The oscillator value and signalline are plotted for visual analysis.
Overbought and oversold levels are marked with dashed horizontal lines.
Signal Markers:
Buy and sell signals are marked with green and maroon circles, respectively.
Background Coloration:
Optionally, the chart’s background bars are colored (yellow for buy signals and fuchsia for sell signals) to enhance visual cues when signals are triggered.
Conclusion
In summary, the Liquidity Cycle Momentum Indicator provides a robust framework to analyze liquidity trends by combining global liquidity data, YoY changes, and momentum oscillation. This makes it an effective tool for traders and analysts looking to identify cyclical shifts in liquidity conditions and potential turning points in the market.

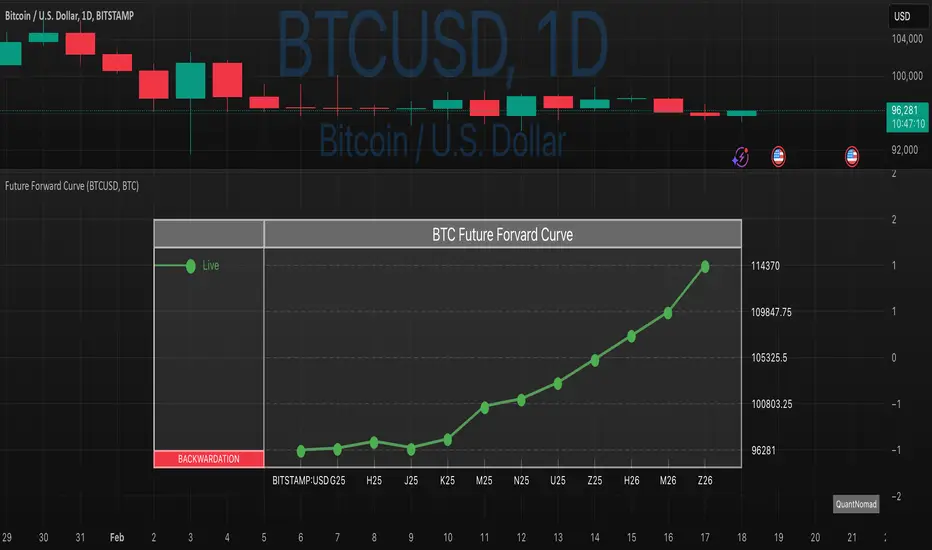
Forward Curve Visualization ToolProvide the spot symbol and the futures product root, and the script automatically scans all relevant contracts for you—no more tedious manual searches. The result is a clean, intuitive chart showing the live forward curve in real time.
It also detects contango or backwardation conditions (based on spot < F1 < F2 < F3).
Future Features:
Plot historical snapshots of the curve (1 day, 1 week, or 1 month ago) to understand market trends over time.
Display additional metrics such as annualized basis, cost of carry (CoC), and even volume or open interest for deeper insights.
If you trade futures and watch the forward curve, this script will give you the actionable data you need and get more ideas or features you’d like to see. Let’s build them together!
Disclaimer
Please remember that past performance may not be indicative of future results.
Due to various factors, including changing market conditions, the strategy may no longer perform as well as in historical backtesting.
This post and the script don’t provide any financial advice.
Blockchain Fundamentals: Liquidity & BTC YoYLiquidity & BTC YoY Indicator
Overview:
This indicator calculates the Year-over-Year (YoY) percentage change for two critical metrics: a custom Liquidity Index and Bitcoin's price. The Liquidity Index is derived from a blend of economic and forex data representing the M2 money supply, while the BTC price is obtained from a reliable market source. A dedicated limit(length) function is implemented to handle limited historical data, ensuring that the YoY calculations are available immediately—even when the chart's history is short.
Features Breakdown:
1. Limited Historical Data Workaround
- Functionality: limit(length) The function dynamically adjusts the lookback period when there isn’t enough historical data. This prevents delays in displaying YoY metrics at the beginning of the chart.
2. Liquidity Calculation
- Data Sources: Combines multiple data streams:
USM2, ECONOMICS:CNM2, USDCNY, ECONOMICS:JPM2, USDJPY, ECONOMICS:EUM2, USDEUR
- Formula:
Liquidity Index = USM2 + (CNM2 / USDCNY) + (JPM2 / USDJPY) + (EUM2 / USDEUR)
[b3. Bitcoin Price Calculation
- Data Source: Retrieves Bitcoin's price from BITSTAMP:BTCUSD on the user-selected timeframe for its historical length.
4. Year-over-Year (YoY) Percent Change Calculation
- Methodology:
- The indicator uses a custom function, to autodetect the proper number of bars, based on the selected timeframe.
- It then compares the current value to that from one year ago for both the Liquidity Index and BTC price, calculating the YoY percentage change.
5. Visual Presentation
- Plotting:
- The YoY percentage changes for Liquidity (plotted in blue) and BTC price (plotted in orange) are clearly displayed.
- A horizontal zero line is added for visual alignment, making it easier to compare the two copies of the metric. You add one copy and only display the BTC YoY. Then you add another copy and only display the M2 YoY.
-The zero lines are then used to align the scripts to each other by interposing them. You scale each chart the way you like, then move each copy individually to align both zero lines on top of each other.
This indicator is ideal for analysts and investors looking to monitor macroeconomic liquidity trends alongside Bitcoin's performance, providing immediate insights.

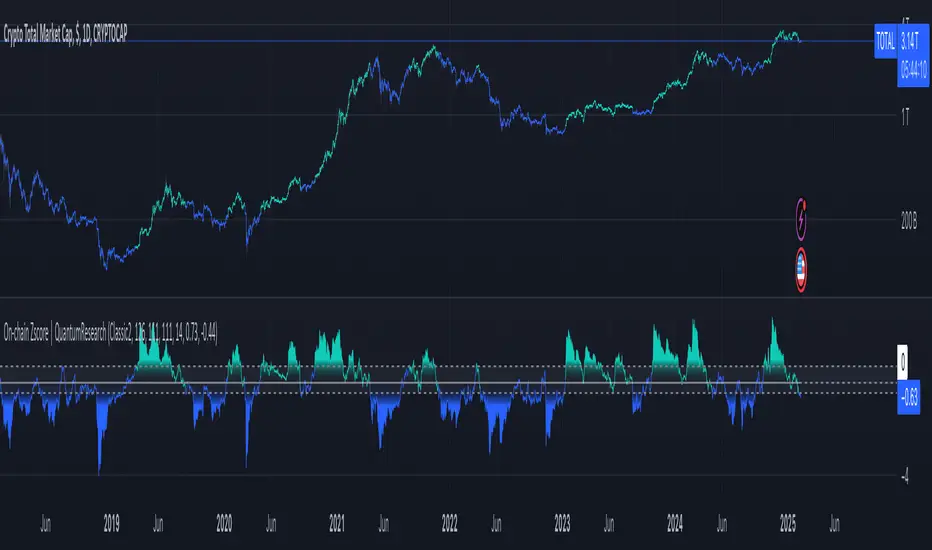
On-chain Zscore | QuantumResearchQuantumResearch On-chain Zscore Indicator
The On-chain Zscore Indicator by QuantumResearch is a cutting-edge tool designed for traders and analysts who leverage on-chain metrics to assess Bitcoin’s market conditions. This indicator calculates a composite Z-score using three key on-chain metrics: NUPL (Net Unrealized Profit/Loss), SOPR (Spent Output Profit Ratio), and MVRV (Market Value to Realized Value). By normalizing these values through standard deviations, the indicator provides a dynamic, data-driven approach to identifying overbought and oversold conditions, improving market timing and decision-making.
1. Overview
This indicator integrates multiple on-chain metrics to:
Assess Market Cycles – Utilize Z-score normalization to detect potential tops and bottoms.
Smooth Volatility – Apply EMA and standard deviation filtering to refine signals.
Identify Buy & Sell Signals – Use adaptive thresholds to highlight market extremes.
Provide Visual Clarity – Color-coded bar signals and background fills for intuitive analysis.
2. How It Works
A. Z-score Calculation
What is a Z-score? – The Z-score measures how far a data point deviates from its historical mean in terms of standard deviations. This helps in identifying statistical extremes.
Zscore(source,mean,std)=>
zscore = (source-mean)/std
zscore
Standard Deviation Normalization – Each on-chain metric (NUPL, SOPR, MVRV) is individually standardized before being combined into a final score.
B. On-Chain Components
NUPL Z-score – Measures unrealized profits and losses relative to market cycles.
SOPR Z-score – Evaluates profit-taking behavior on spent outputs.
MVRV Z-score – Assesses whether Bitcoin is overvalued or undervalued based on market cap vs. realized cap.
C. Composite On-chain Score
The indicator computes an average Z-score of the three on-chain metrics to create a composite market assessment.
Adaptive thresholds (default: 0.73 for bullish signals, -0.44 for bearish signals) dynamically adjust based on market conditions.
3. Visual Representation
This indicator features color-coded elements and dynamic threshold visualization:
Bar Colors
Green Bars – Bullish conditions when Z-score exceeds the upper threshold.
Red Bars – Bearish conditions when Z-score drops below the lower threshold.
Gray Bars – Neutral market conditions.
Threshold Bands & Background Fill
Upper Band (Overbought) – Default threshold set at 0.73.
Middle Band – Neutral zone at 0.
Lower Band (Oversold) – Default threshold set at -0.44.
4. Customization & Parameters
This indicator is highly configurable, allowing traders to fine-tune settings based on their strategy:
On-Chain Z-score Settings
NUPL Z-score Length – Default: 126 periods
SOPR Z-score Length – Default: 111 periods
MVRV Z-score Length – Default: 111 periods
Signal Thresholds
Upper Threshold (Bullish Zone) – Default: 0.73
Lower Threshold (Bearish Zone) – Default: -0.44
Color & Visual Settings
Choose from eight customizable color modes to suit personal preferences.
5. Trading Applications
The On-chain Zscore Indicator is versatile and can be applied in various market scenarios:
Macro Trend Analysis – Identify long-term market tops and bottoms using normalized on-chain metrics.
Momentum Confirmation – Validate price action trends with SOPR & MVRV behavior.
Market Timing – Use deviation thresholds to enter at historically significant price zones.
Risk Management – Avoid overextended markets by watching for extreme Z-score readings.
6. Final Thoughts
The QuantumResearch On-chain Zscore Indicator provides a unique approach to market evaluation by combining three critical on-chain metrics into a single, normalized score.
By standardizing Bitcoin’s market behavior, this tool helps traders and investors make informed decisions based on historical statistical extremes.
Backtesting and validation are essential before using this indicator in live trading. While it enhances market analysis, it should be used alongside other tools and strategies.
Disclaimer: No indicator can guarantee future performance. Always use appropriate risk management and perform due diligence before trading.
Global Liquidity IndexThis custom indicator provides a composite measure of global liquidity by combining key central bank balance sheet data with additional liquidity proxies. The script aggregates asset data from major economies—including the United States, Japan, China, and the Eurozone—converting non-USD values into U.S. dollars using real-time exchange rates. It then subtracts selected liability measures (such as reverse repurchase agreements and other adjustments) to approximate net central bank liquidity.
Key features include:
• Multi-Regional Coverage:
Incorporates data from the U.S. Federal Reserve, Bank of Japan, Chinese central bank proxies, and the European Central Bank, allowing you to gauge liquidity across major global markets.
• Dynamic Currency Conversion:
Uses live exchange rates (JPY/USD, CNY/USD, EUR/USD) to ensure that all regional figures are consistently expressed in U.S. dollars.
• Customizable Weighting:
Assign adjustable weights to each region’s data, so you can reflect economic size or your own view of their relative importance.
• Additional Liquidity Proxies:
Optionally integrates measures for global money supply and global credit/repo activity (or other proxies of your choice) with user-defined scaling factors.
• User-Friendly Configuration:
All key parameters—including weights and scaling factors—are available as inputs, making the indicator flexible and easy to tailor to your analysis needs.
This indicator is designed for traders and analysts seeking a broad view of global monetary conditions. Whether you’re tracking shifts in central bank policies or assessing global market liquidity, the Global Liquidity Index provides an insightful, customizable tool to help you visualize and interpret liquidity trends over time.

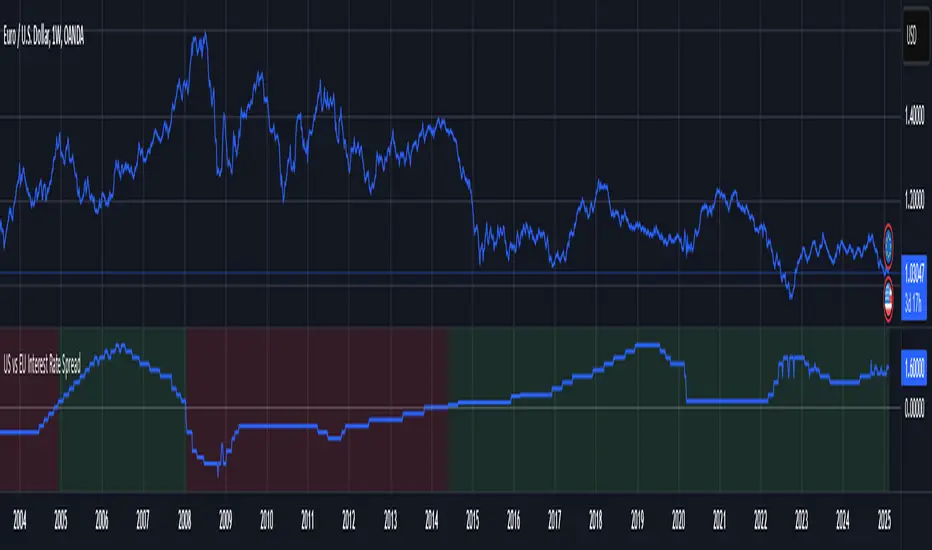
US vs EU Interest Rate SpreadThis script plots the difference (Spread) between the US-Interest Rate (Symbol USINTR) and the EU Interest Rate (Symbol: EUINTR) and plots it in a seperate pane. Areas where the background is green are times were the spread was positive (US interest rate higher than EU interest rate), a red background indicates a higher EU interest rate than US interest rate.
Blockchain Fundamentals: Global LiquidityGlobal Liquidity Indicator Overview
This indicator provides a comprehensive technical analysis of liquidity trends by deriving a Global Liquidity metric from multiple data sources. It applies a suite of technical indicators directly on this liquidity measure, rather than on price data. When this metric is expanding Bitcoin and crypto tends to bullish conditions.
Features:
1. Global Liquidity Calculation
Data Integration: Combines multiple market data sources using a ratio-based formula to produce a unique liquidity measure.
Custom Metric: This liquidity metric serves as the foundational input for further technical analysis.
2. Timeframe Customization
User-Selected Period: Users can select the data timeframe (default is 2 months) to ensure consistency and flexibility in analysis.
3. Additional Technical Indicators
RSI, Momentum, ROC, MACD, and Stochastic:
Each indicator is computed using the Global Liquidity series rather than price.
User-selectable toggles allow for enabling or disabling each individual indicator as desired.
4. Enhanced MACD Visualization
Dynamic Histogram Coloring:
The MACD histogram color adjusts dynamically: brighter hues indicate rising histogram values while darker hues indicate falling values.
When the histogram is above zero, green is used; when below zero, red is applied, offering immediate visual insight into momentum shifts.
Conclusion
This indicator is an enlightening tool for understanding liquidity dynamics, aiding in macroeconomic analysis and investment decision-making by highlighting shifts in liquidity conditions and market momentum.

Turtle Soup Model [PhenLabs]📊 Turtle Soup Model
Version: PineScript™ v6
Description
The Turtle Soup Model is an innovative technical analysis tool that combines market structure analysis with inter-market comparison and gap detection. Unlike traditional structure indicators, it validates market movements against a comparison symbol (default: ES1!) to identify high-probability trading opportunities. The indicator features a unique “soup pattern” detection system, comprehensive gap analysis, and real-time structure breaks visualization.
Innovation Points:
First indicator to combine structure analysis with gap detection and inter-market validation
Advanced memory management system for efficient long-term analysis
Sophisticated pattern recognition with multi-market confirmation
Real-time structure break detection with comparative validation
🔧 Core Components
Structure Analysis: Advanced pivot detection with inter-market validation
Gap Detection: Sophisticated gap identification and classification system
Inversion Patterns: “Soup pattern” recognition for reversal opportunities
Visual System: Dynamic rendering of structure levels and gaps
Alert Framework: Multi-condition notification system
🚨 Key Features 🚨
The indicator provides comprehensive analysis through:
Structure Levels: Validated support and resistance zones
Gap Patterns: Identification of significant market gaps
Inversion Signals: Detection of potential reversal points
Real-time Comparison: Continuous inter-market analysis
Visual Alerts: Dynamic structure break notifications
📈 Visualization
Structure Lines: Color-coded for highs and lows
Gap Boxes: Visual representation of gap zones
Inversion Patterns: Clear marking of potential reversal points
Comparison Overlay: Inter-market divergence visualization
Alert Indicators: Visual signals for structure breaks
💡Example
📌 Usage Guidelines
The indicator offers multiple customization options:
Structure Settings:
Pivot Period: Adjustable for different market conditions
Comparison Symbol: Customizable reference market
Visual Style: Configurable colors and line widths
Gap Analysis:
Signal Mode: Choice between close and wick-based signals
Box Rendering: Automatic gap zone visualization
Middle Line: Reference point for gap measurements
✅ Best Practices:
🚨Use comparison symbol from related market🚨
Monitor both structure breaks and gap inversions
Combine signals for higher probability trades
Pay attention to inter-market divergences
⚠️ Limitations
Requires comparison symbol data
Performance depends on market correlation
Best suited for liquid markets
What Makes This Unique
Inter-market Validation: Uses comparison symbol for signal confirmation
Gap Integration: Combines structure and gap analysis
Soup Pattern Detection: Identifies specific reversal patterns
Dynamic Structure Management: Automatically updates and removes invalid levels
Memory-Efficient Design: Optimized for long-term chart analysis
🔧 How It Works
The indicator processes market data through three main components:
1. Structure Analysis:
Detects pivot points with comparison validation
Tracks structure levels with array management
Identifies and processes structure breaks
2. Gap Analysis:
Identifies significant market gaps
Processes gap inversions
Manages gap zones visualization
3. Pattern Recognition:
Detects “soup” patterns
Validates with comparison market
Generates structure break signals
💡 Note: The indicator performs best when used with correlated comparison symbols and appropriate timeframe selection. Its unique inter-market validation system provides additional confirmation for traditional structure-based trading strategies.