Global M2 sandboxThis indicator aggregates global sources of liquidity to use as a proxy for the global money supply and allows an offsetting number of days to be implemented to use as a leading indicator.
// EUROZONE Data
EUM2D = request.security("ECONOMICS:EUM2*FX:EURUSD", "D", close, lookahead=barmerge.lookahead_on)
// North America Data
USM2D = request.security("ECONOMICS:USM2", "D", close, lookahead=barmerge.lookahead_on)
CAM2D = request.security("ECONOMICS:CAM2*FX_IDC:CADUSD", "D", close, lookahead=barmerge.lookahead_on)
// Non-EU Europe Data
CHM2D = request.security("ECONOMICS:CHM2*FX_IDC:CHFUSD", "D", close, lookahead=barmerge.lookahead_on)
GBM2D = request.security("ECONOMICS:GBM2*FX:GBPUSD", "D", close, lookahead=barmerge.lookahead_on)
FIPOP = request.security("ECONOMICS:FIM2/FX_IDC:USDFIM", "D", close, lookahead=barmerge.lookahead_on)
RUM2D = request.security("ECONOMICS:RUM2*FX_IDC:RUBUSD", "D", close, lookahead=barmerge.lookahead_on)
// Pacific Data
NZM2D = request.security("ECONOMICS:NZM2*FX_IDC:NZDUSD", "D", close, lookahead=barmerge.lookahead_on)
// Asia Data
CNM2D = request.security("ECONOMICS:CNM2*FX_IDC:CNYUSD", "D", close, lookahead=barmerge.lookahead_on)
TWM2D = request.security("ECONOMICS:TWM2*FX_IDC:TWDUSD", "D", close, lookahead=barmerge.lookahead_on)
HKM2D = request.security("ECONOMICS:HKM2*FX_IDC:HKDUSD", "D", close, lookahead=barmerge.lookahead_on)
INM2D = request.security("ECONOMICS:INM2*FX_IDC:INRUSD", "D", close, lookahead=barmerge.lookahead_on)
JPM2D = request.security("ECONOMICS:JPM2*FX_IDC:JPYUSD", "D", close, lookahead=barmerge.lookahead_on)
PHM2D = request.security("ECONOMICS:PHM2*FX_IDC:PHPUSD", "D", close, lookahead=barmerge.lookahead_on)
SGM2D = request.security("ECONOMICS:SGM2*FX_IDC:SGDUSD", "D", close, lookahead=barmerge.lookahead_on)
// Latin America Data
BRM2D = request.security("ECONOMICS:BRM2*FX_IDC:BRLUSD", "D", close, lookahead=barmerge.lookahead_on)
COM2D = request.security("ECONOMICS:COM2*FX_IDC:COPUSD", "D", close, lookahead=barmerge.lookahead_on)
MXM2D = request.security("ECONOMICS:MXM2*FX_IDC:MXNUSD", "D", close, lookahead=barmerge.lookahead_on)
// Middle East Data
AEM2D = request.security("ECONOMICS:AEM2*FX_IDC:AEDUSD", "D", close, lookahead=barmerge.lookahead_on)
TRM2D = request.security("ECONOMICS:TRM2*FX_IDC:TRYUSD", "D", close, lookahead=barmerge.lookahead_on)
// Africa Data
ZAM2D = request.security("ECONOMICS:ZAM2*FX_IDC:ZARUSD", "D", close, lookahead=barmerge.lookahead_on)
// Calculate Global Money Supply M2
total = (EUM2D + USM2D + CAM2D + CHM2D + GBM2D + FIPOP + RUM2D + NZM2D + CNM2D + TWM2D + HKM2D + INM2D + JPM2D + PHM2D + SGM2D + BRM2D + COM2D + MXM2D + AEM2D + TRM2D + ZAM2D) / 1000000000000
Forecasting

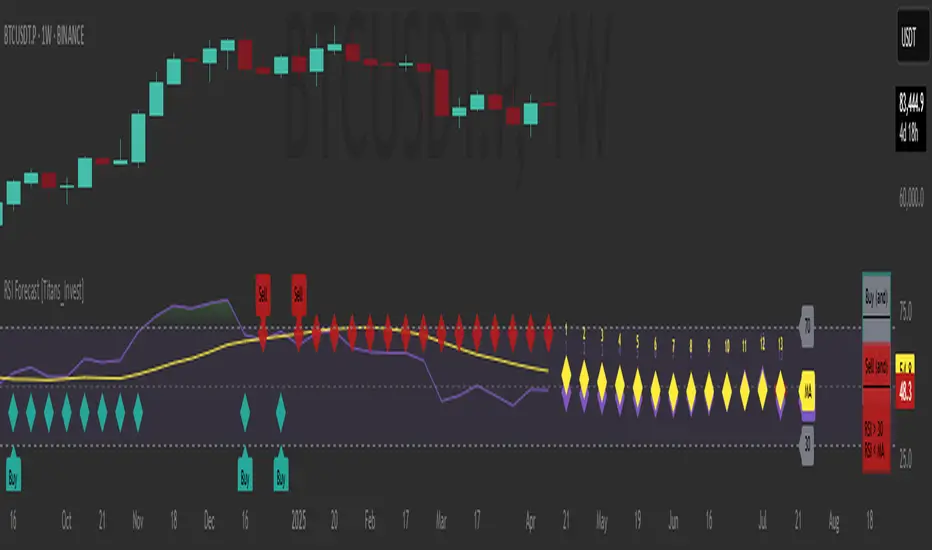
RSI Forecast [Titans_Invest]RSI Forecast
Introducing one of the most impressive RSI indicators ever created – arguably the best on TradingView, and potentially the best in the world.
RSI Forecast is a visionary evolution of the classic RSI, merging powerful customization with groundbreaking predictive capabilities. While preserving the core principles of traditional RSI, it takes analysis to the next level by allowing users to anticipate potential future RSI movements.
Real-Time RSI Forecasting:
For the first time ever, an RSI indicator integrates linear regression using the least squares method to accurately forecast the future behavior of the RSI. This innovation empowers traders to stay one step ahead of the market with forward-looking insight.
Highly Customizable:
Easily adapt the indicator to your personal trading style. Fine-tune a variety of parameters to generate signals perfectly aligned with your strategy.
Innovative, Unique, and Powerful:
This is the world’s first RSI Forecast to apply this predictive approach using least squares linear regression. A truly elite-level tool designed for traders who want a real edge in the market.
⯁ SCIENTIFIC BASIS LINEAR REGRESSION
Linear Regression is a fundamental method of statistics and machine learning, used to model the relationship between a dependent variable y and one or more independent variables 𝑥.
The general formula for a simple linear regression is given by:
y = β₀ + β₁x + ε
Where:
y = is the predicted variable (e.g. future value of RSI)
x = is the explanatory variable (e.g. time or bar index)
β0 = is the intercept (value of 𝑦 when 𝑥 = 0)
𝛽1 = is the slope of the line (rate of change)
ε = is the random error term
The goal is to estimate the coefficients 𝛽0 and 𝛽1 so as to minimize the sum of the squared errors — the so-called Random Error Method Least Squares.
⯁ LEAST SQUARES ESTIMATION
To minimize the error between predicted and observed values, we use the following formulas:
β₁ = /
β₀ = ȳ - β₁x̄
Where:
∑ = sum
x̄ = mean of x
ȳ = mean of y
x_i, y_i = individual values of the variables.
Where:
x_i and y_i are the means of the independent and dependent variables, respectively.
i ranges from 1 to n, the number of observations.
These equations guarantee the best linear unbiased estimator, according to the Gauss-Markov theorem, assuming homoscedasticity and linearity.
⯁ LINEAR REGRESSION IN MACHINE LEARNING
Linear regression is one of the cornerstones of supervised learning. Its simplicity and ability to generate accurate quantitative predictions make it essential in AI systems, predictive algorithms, time series analysis, and automated trading strategies.
By applying this model to the RSI, you are literally putting artificial intelligence at the heart of a classic indicator, bringing a new dimension to technical analysis.
⯁ VISUAL INTERPRETATION
Imagine an RSI time series like this:
Time →
RSI →
The regression line will smooth these values and extend them n periods into the future, creating a predicted trajectory based on the historical moment. This line becomes the predicted RSI, which can be crossed with the actual RSI to generate more intelligent signals.
⯁ SUMMARY OF SCIENTIFIC CONCEPTS USED
Linear Regression Models the relationship between variables using a straight line.
Least Squares Minimizes the sum of squared errors between prediction and reality.
Time Series Forecasting Estimates future values based on historical data.
Supervised Learning Trains models to predict outputs from known inputs.
Statistical Smoothing Reduces noise and reveals underlying trends.
⯁ WHY THIS INDICATOR IS REVOLUTIONARY
Scientifically-based: Based on statistical theory and mathematical inference.
Unprecedented: First public RSI with least squares predictive modeling.
Intelligent: Built with machine learning logic.
Practical: Generates forward-thinking signals.
Customizable: Flexible for any trading strategy.
⯁ CONCLUSION
By combining RSI with linear regression, this indicator allows a trader to predict market momentum, not just follow it.
RSI Forecast is not just an indicator — it is a scientific breakthrough in technical analysis technology.
⯁ Example of simple linear regression, which has one independent variable:
⯁ In linear regression, observations ( red ) are considered to be the result of random deviations ( green ) from an underlying relationship ( blue ) between a dependent variable ( y ) and an independent variable ( x ).
⯁ Visualizing heteroscedasticity in a scatterplot against 100 random fitted values using Matlab:
⯁ The data sets in the Anscombe's quartet are designed to have approximately the same linear regression line (as well as nearly identical means, standard deviations, and correlations) but are graphically very different. This illustrates the pitfalls of relying solely on a fitted model to understand the relationship between variables.
⯁ The result of fitting a set of data points with a quadratic function:
_______________________________________________________________________
🥇 This is the world’s first RSI indicator with: Linear Regression for Forecasting 🥇_______________________________________________________________________
_________________________________________________
🔮 Linear Regression: PineScript Technical Parameters 🔮
_________________________________________________
Forecast Types:
• Flat: Assumes prices will remain the same.
• Linreg: Makes a 'Linear Regression' forecast for n periods.
Technical Information:
ta.linreg (built-in function)
Linear regression curve. A line that best fits the specified prices over a user-defined time period. It is calculated using the least squares method. The result of this function is calculated using the formula: linreg = intercept + slope * (length - 1 - offset), where intercept and slope are the values calculated using the least squares method on the source series.
Syntax:
• Function: ta.linreg()
Parameters:
• source: Source price series.
• length: Number of bars (period).
• offset: Offset.
• return: Linear regression curve.
This function has been cleverly applied to the RSI, making it capable of projecting future values based on past statistical trends.
______________________________________________________
______________________________________________________
⯁ WHAT IS THE RSI❓
The Relative Strength Index (RSI) is a technical analysis indicator developed by J. Welles Wilder. It measures the magnitude of recent price movements to evaluate overbought or oversold conditions in a market. The RSI is an oscillator that ranges from 0 to 100 and is commonly used to identify potential reversal points, as well as the strength of a trend.
⯁ HOW TO USE THE RSI❓
The RSI is calculated based on average gains and losses over a specified period (usually 14 periods). It is plotted on a scale from 0 to 100 and includes three main zones:
• Overbought: When the RSI is above 70, indicating that the asset may be overbought.
• Oversold: When the RSI is below 30, indicating that the asset may be oversold.
• Neutral Zone: Between 30 and 70, where there is no clear signal of overbought or oversold conditions.
______________________________________________________
______________________________________________________
⯁ ENTRY CONDITIONS
The conditions below are fully flexible and allow for complete customization of the signal.
______________________________________________________
______________________________________________________
🔹 CONDITIONS TO BUY 📈
______________________________________________________
• Signal Validity: The signal will remain valid for X bars .
• Signal Sequence: Configurable as AND or OR .
📈 RSI Conditions:
🔹 RSI > Upper
🔹 RSI < Upper
🔹 RSI > Lower
🔹 RSI < Lower
🔹 RSI > Middle
🔹 RSI < Middle
🔹 RSI > MA
🔹 RSI < MA
📈 MA Conditions:
🔹 MA > Upper
🔹 MA < Upper
🔹 MA > Lower
🔹 MA < Lower
📈 Crossovers:
🔹 RSI (Crossover) Upper
🔹 RSI (Crossunder) Upper
🔹 RSI (Crossover) Lower
🔹 RSI (Crossunder) Lower
🔹 RSI (Crossover) Middle
🔹 RSI (Crossunder) Middle
🔹 RSI (Crossover) MA
🔹 RSI (Crossunder) MA
🔹 MA (Crossover) Upper
🔹 MA (Crossunder) Upper
🔹 MA (Crossover) Lower
🔹 MA (Crossunder) Lower
📈 RSI Divergences:
🔹 RSI Divergence Bull
🔹 RSI Divergence Bear
📈 RSI Forecast:
🔮 RSI (Crossover) MA Forecast
🔮 RSI (Crossunder) MA Forecast
______________________________________________________
______________________________________________________
🔸 CONDITIONS TO SELL 📉
______________________________________________________
• Signal Validity: The signal will remain valid for X bars .
• Signal Sequence: Configurable as AND or OR .
📉 RSI Conditions:
🔸 RSI > Upper
🔸 RSI < Upper
🔸 RSI > Lower
🔸 RSI < Lower
🔸 RSI > Middle
🔸 RSI < Middle
🔸 RSI > MA
🔸 RSI < MA
📉 MA Conditions:
🔸 MA > Upper
🔸 MA < Upper
🔸 MA > Lower
🔸 MA < Lower
📉 Crossovers:
🔸 RSI (Crossover) Upper
🔸 RSI (Crossunder) Upper
🔸 RSI (Crossover) Lower
🔸 RSI (Crossunder) Lower
🔸 RSI (Crossover) Middle
🔸 RSI (Crossunder) Middle
🔸 RSI (Crossover) MA
🔸 RSI (Crossunder) MA
🔸 MA (Crossover) Upper
🔸 MA (Crossunder) Upper
🔸 MA (Crossover) Lower
🔸 MA (Crossunder) Lower
📉 RSI Divergences:
🔸 RSI Divergence Bull
🔸 RSI Divergence Bear
📉 RSI Forecast:
🔮 RSI (Crossover) MA Forecast
🔮 RSI (Crossunder) MA Forecast
______________________________________________________
______________________________________________________
🤖 AUTOMATION 🤖
• You can automate the BUY and SELL signals of this indicator.
______________________________________________________
______________________________________________________
⯁ UNIQUE FEATURES
______________________________________________________
Linear Regression: (Forecast)
Signal Validity: The signal will remain valid for X bars
Signal Sequence: Configurable as AND/OR
Condition Table: BUY/SELL
Condition Labels: BUY/SELL
Plot Labels in the Graph Above: BUY/SELL
Automate and Monitor Signals/Alerts: BUY/SELL
Linear Regression (Forecast)
Signal Validity: The signal will remain valid for X bars
Signal Sequence: Configurable as AND/OR
Condition Table: BUY/SELL
Condition Labels: BUY/SELL
Plot Labels in the Graph Above: BUY/SELL
Automate and Monitor Signals/Alerts: BUY/SELL
______________________________________________________
📜 SCRIPT : RSI Forecast
🎴 Art by : @Titans_Invest & @DiFlip
👨💻 Dev by : @Titans_Invest & @DiFlip
🎑 Titans Invest — The Wizards Without Gloves 🧤
✨ Enjoy!
______________________________________________________
o Mission 🗺
• Inspire Traders to manifest Magic in the Market.
o Vision 𐓏
• To elevate collective Energy 𐓷𐓏
Market Sessions by BASSWELLThis TradingView indicator visually highlights major global trading sessions (Tokyo, London, New York) directly on intraday charts. It provides a clear, color-coded display of session activity and key statistics to help traders better understand session dynamics and overlaps.
✅ Key Features:
Visual Session Boxes: Draws background boxes for each session with configurable colors.
Session Names: Displays the name of each session as a label above the session box.
Open/Close Lines: Optionally shows dashed lines at session open and close prices.
Average Price Line: Plots the average session price as a dotted line.
Tick Range Display: Calculates and shows the high-low range in ticks.
Time Zone Support: Fully timezone-aware via IANA definitions (e.g. "Europe/London").
Overlap Handling: Automatically dims older sessions when a new one starts for visual clarity.
🔧 Configurable Parameters:
Show/hide each session individually.
Set session times and timezones.
Customize label visibility and box contents.
Adjust session colors with transparency.
Includes basic visual styling for better chart readability.
⚠️ Note: Works only on intraday timeframes. Daily/weekly/monthly charts are not supported.

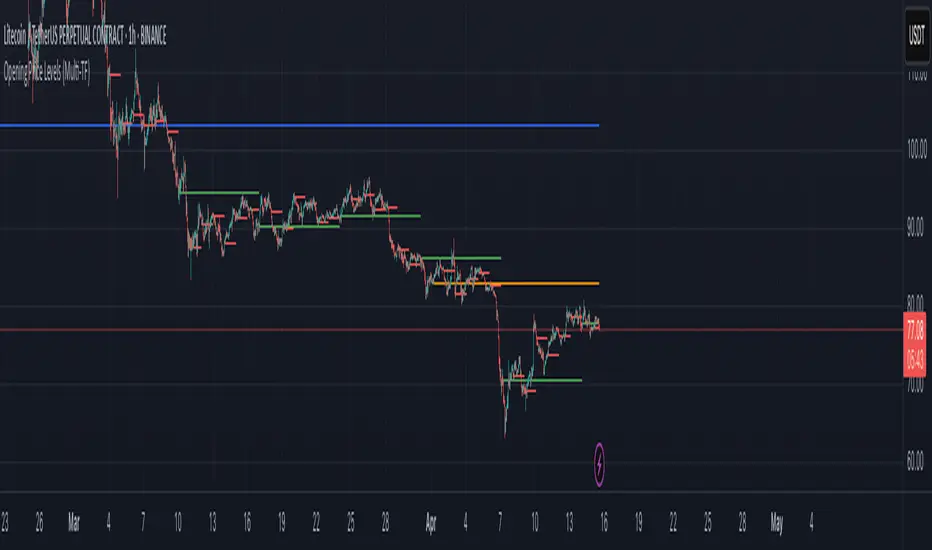
Opening Price LevelsOpening Price Levels
This simple and effective indicator automatically draws horizontal lines at the opening price of each major period:
Year
Quarter
Month
Week
Day
Each line extends until the end of its respective period, helping you quickly identify and react to key institutional price levels and market structure shifts.
🔧 Features:
Toggle visibility for each timeframe (Year, Quarter, Month, Week, Day)
Clean visual presentation using plot.style_linebr, ensuring no overlapping or vertical jumps
Automatically adapts to your chart’s timeframe and session settings
This tool is great for both discretionary and systematic traders who want to add more context and structure to their analysis.

Opening Price Levels (by Period)This indicator draws clean horizontal lines at the opening prices of key time periods: Year, Quarter, Month, Week, and Day.
Each line is plotted only within its own time range, so there's no visual clutter or vertical jumps between periods.
Perfect for traders who want to:
Identify and react to institutional levels.
Track price behavior relative to major opens.
Keep charts clean and easy to read.
Features:
✅ Toggle visibility for each period (Year, Quarter, Month, Week, Day).
🎯 Accurate open levels, aligned with your chart's timeframe and session settings.
✨ Clean segments — each line only spans its original period.
Global Liquidity IndexGlobal Liquidity Index
This indicator tracks worldwide liquidity by aggregating global M2 money supply, the U.S. Treasury General Account (TGA), the Federal Reserve’s Reverse Repo (RRP) facility, and major central bank balance sheets. It offers insight into the overall liquidity environment, often a key driver of risk asset performance.

Gold Price with Time ShiftOverview
The "Gold Price with Time Shift" indicator allows you to visualize the Gold price (XAUUSD) with a customizable time shift, enabling you to lag or lead the data by a specified number of bars. Whether you're analyzing historical trends or projecting Gold’s price into the future, this indicator provides a flexible tool to align Gold price movements with other market indicators or events.
Features
Customizable Time Shift: Shift the Gold price backward (lag) or forward (lead) by a user-defined number of bars. Positive values lag the data, while negative values project it into the future.
Future Projection: When leading the Gold price (negative time shift), the indicator extends the chart into the future, displaying the last known price as a flat projection for easy comparison.
Daily Timeframe: Fetches Gold price data on a daily timeframe, ensuring consistency for long-term analysis.
User-Friendly Inputs: Easily adjust the Gold ticker and time shift via the settings panel to suit your analysis needs.

Indian Market Price LevelsScript to mark levels in Indian market to look for levels in market that including supports and resistance in the market

Combined EMA/Smiley & DEM System## 🔷 General Overview
This script creates an advanced technical analysis system for TradingView, combining multiple Exponential Moving Averages (EMAs), Simple Moving Averages (SMAs), dynamic Fibonacci levels, and ATR (Average True Range) analysis. It presents the results clearly through interactive, real-time tables directly on the chart.
---
## 🔹 Indicator Structure
The script consists of two main parts:
### **1. EMA & SMA Combined System with Fibonacci**
- **Purpose:**
Provides visual insights by comparing multiple EMA/SMA periods and identifying significant dynamic price levels using Fibonacci ratios around a calculated "Golden" line.
- **Components:**
- **Moving Averages (MAs)**:
- 20 EMAs (periods from 20 to 400)
- 20 SMAs (also from 20 to 400)
- **Golden Line:**
Calculated as the average of all EMAs and SMAs.
- **Dynamic Fibonacci Levels:**
Key ratios around the Golden line (0.5, 0.618, 0.786, 1.0, 1.272, 1.414, 1.618, 2.0) dynamically adjust based on market conditions.
- **Fibonacci Labels:**
Labels are shown next to Fibonacci lines, indicating their numeric value clearly on the chart.
- **Table (Top Right Corner):**
- Displays:
- **Input:** EMA/SMA periods sorted by their current average price levels.
- **AVG:** The average of corresponding EMA & SMA pairs.
- **EMA & SMA Values:** Individual EMA/SMA values clearly marked.
- **Dynamic Highlighting:** Highlights the row whose average (EMA+SMA)/2 is closest to the current price, helping identify immediate price action significance.
- **Sorting Logic:**
Each EMA/SMA pair is dynamically sorted based on their average values. Color coding (red/green) is used:
- **Green:** EMA/SMA pairs with shorter periods when their average is lower.
- **Red:** EMA/SMA pairs with longer periods when their average is lower.
- **Star (⭐):** Represents the "Golden" average clearly.
---
### **2. DEM System (Dynamic EMA/ATR Metrics)**
- **Purpose:**
Provides detailed ATR statistics to assess market volatility clearly and quickly.
- **Components:**
- **Moving Averages:**
- SMA lines: 25, 50, 100, 200.
- **Bollinger Bands:**
- Based on 20-period SMA of highs and standard deviation of lows.
- **ATR Analysis:**
- ATR calculations for multiple periods (1-day, 10, 20, 30, 40, 50).
- **ATR Premium:** Average ATR of all calculated periods, providing an overarching volatility indicator.
- **ATR Table (Bottom Right Corner):**
- Displays clearly structured ATR values and percentages relative to the current close price:
- Columns: **ATR Period**, **Value**, and **% of Close**.
- Rows: Each specific ATR (1D, 10, 20, 30, 40, 50), plus ATR premium.
- The ATR premium is highlighted in yellow to signify its importance clearly.
---
## 🔹 Key Features and Logic Explained
- **Dynamic EMA/SMA Sorting:**
The script computes the average of each EMA/SMA pair and sorts them dynamically on each bar, highlighting their relative importance visually. This allows traders to easily interpret the strength of current support/resistance levels based on moving averages.
- **Closest EMA/SMA Pair to Current Price:**
Calculates the absolute difference between the current price and all EMA/SMA averages, highlighting the closest one for quick reference.
- **Fibonacci Ratios:**
- Dynamically calculated Fibonacci levels based on the "Golden" EMA/SMA average give clear visual guidance for potential targets, supports, and resistances.
- Labels are continuously updated and placed next to levels for clarity.
- **ATR Volatility Analysis:**
- Provides immediate insight into market volatility with absolute and relative (percentage-based) ATR values.
- ATR premium summarizes volatility across multiple timeframes clearly.
---
## 🔹 Practical Use Case:
- Traders can quickly identify support/resistance and critical price zones through EMA/SMA and Fibonacci combinations.
- Useful in assessing immediate volatility, guiding stop-loss and take-profit levels through detailed ATR metrics.
- The dynamic highlighting in tables provides intuitive, real-time decision support for active traders.
---
## 🔹 How to Use this Script:
1. **Adjust EMA & SMA Lengths** from indicator settings if different periods are preferred.
2. **Monitor dynamic Fibonacci levels** around the "Golden" average to identify possible reversal or continuation points.
3. **Check EMA/SMA table:** Rows highlighted indicate immediate significance concerning current market price.
4. **ATR table:** Use volatility metrics for better risk management.
---
## 🔷 Conclusion
This advanced Pine Script indicator efficiently combines multiple EMAs, SMAs, dynamic Fibonacci retracement levels, and volatility analysis using ATR into a comprehensive real-time analytical tool, enhancing traders' decision-making capabilities by providing clear and actionable insights directly on the TradingView chart.

3M-10Y Yield Spread3M-10Y Yield Spread Indicator Description
What It Is:
This indicator calculates the difference (spread) between the 3-month and 10-year US Treasury yields, plotted as a line with a zero reference. The background turns red when the spread inverts (falls below zero), signaling when the 3-month yield exceeds the 10-year yield.
What It Helps Understand:
Economic Health: An inverted yield curve (spread < 0) often predicts recessions, as it reflects market expectations of future economic slowdown, typically preceding downturns by 6-18 months.
Fed Policy Impact: Fed rate hikes can push short-term yields (like the 3-month) higher, potentially causing inversion if long-term yields (10-year) don’t rise as much due to growth concerns. Conversely, Fed rate cuts can lower short-term yields, steepening the curve (spread > 0), signaling economic stimulus or recovery expectations.

Quarters Theory Levels (Yotov Style)John Alex Sagwe's Quarters Theory Levels Script
This Pine Script, developed by John Alex Sagwe, is based on the concept of the "Quarters Theory" popularized by Illan Yotov. It aims to help traders identify key levels in the market using whole, half, and quarter-level calculations. The script plots major whole levels, half levels, and quarter levels above and below the current price, allowing traders to visualize potential price points where significant market action might occur.
The customizable parameters allow you to:
Set the base level and step size (for quarter levels),
Adjust the number of levels above and below the current price to be displayed,
Toggle between showing whole, half, or quarter levels,
Use price alerts when the market price nears these levels.
Whether you’re a novice or an experienced trader, this script can help you integrate the Quarters Theory into your trading strategy. It’s designed to be flexible and user-friendly, helping you visualize key market levels with ease.
Developed by: John Alex Sagwe, an avid trader and Pine Script enthusiast.
H4 Cross + LTF Candle Alignment (Short Lines)H4 Cross + LTF Candle Alignment (Short Lines)
This indicator identifies potential trade opportunities by combining two key conditions:
The current H4 candle crosses above or below the previous H4 candle's high or low.
On a lower timeframe (like 5 minutes), the price shows two consecutive candles moving in the same direction (bullish for long, bearish for short).
Once these conditions align, a short entry line is drawn on the chart and an alert is triggered, providing an early signal for potential price movements. Perfect for traders looking to capture trend continuation with a clear visual marker and timely alerts.

Global M2 Money+ Supply Input Lead (USD)Global M2 Money Supply + INR+CAD Input Lead (USD)
This indicator calculates the global M2 money supply in USD by aggregating M2 data from multiple economies, converted to USD using their respective exchange rates. It overlays the scaled M2 data on the chart with a user-defined time shift to analyze potential correlations with asset prices, such as Bitcoin. The indicator is designed to help traders assess global liquidity trends with a customizable lead or lag.
Countries Included:
Eurozone (EUM2)
North America: United States (USM2), Canada (CAM2)
Non-EU Europe: Switzerland (CHM2), United Kingdom (GBM2), Finland (FIM2), Russia (RUM2)
Pacific: New Zealand (NZM2)
Asia: China (CNM2), Taiwan (TWM2), Hong Kong (HKM2), India (INM2), Japan (JPM2), Philippines (PHM2), Singapore (SGM2)
Latin America: Brazil (BRM2), Colombia (COM2), Mexico (MXM2)
Middle East: United Arab Emirates (AEM2), Turkey (TRM2)
Africa: South Africa (ZAM2)
Input for Lead/Lag:
Time Shift (days): Adjust this input to shift the M2 data forward (positive values) or backward (negative values) on the chart. For example, setting a lead of 85 days shifts the M2 data 85 days into the future, helping traders analyze potential leading indicators for price movements.

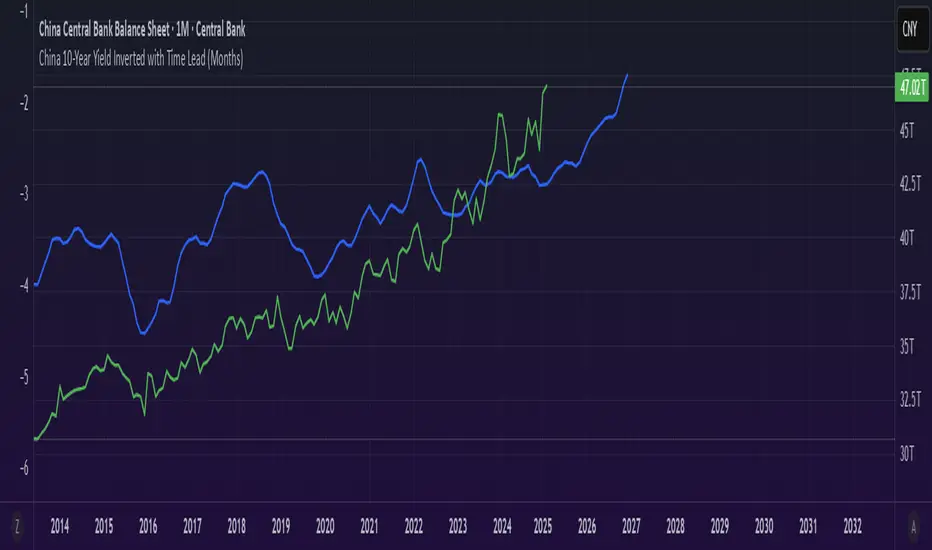
PBOC Balance Sheet (Approx USD Trillions)This indicator displays the People's Bank of China (PBOC) Balance Sheet in approximate USD trillions, converted from CNY data (ECONOMICS:CNCBBS) using a fixed exchange rate of 1 USD ≈ 7 CNY. The data is smoothed with a 3-month SMA and plotted as a black line in a separate pane, with a reference line at 6.0 USD trillions. Ideal for analyzing long-term macroeconomic trends and correlations with other financial metrics like bond yields or asset prices, it includes error handling for missing data to ensure reliable visualization.

China 10-Year Yield Inverted with Time Lead (Months)The "China 10-Year Yield Inverted with Time Lead (Months)" indicator is a Pine Script tool for TradingView that displays the inverted China 10-Year Government Bond Yield (sourced from TVC:CN10Y) with a user-defined time lead or lag in months. The yield is inverted by multiplying it by -1, making a rising yield appear as a downward movement and vice versa, which helps visualize inverse correlations with other assets. Users can input the number of months to shift the yield forward (lead) or backward (lag), with the shift calculated based on the chart’s timeframe (e.g., 20 bars per month on daily charts). The indicator plots the shifted, inverted yield as a blue line in a separate pane, with a zero line for reference, enabling traders to analyze leading or lagging relationships with other financial data, such as the PBOC Balance Sheet or Bitcoin price.
Mongoose Yield Spread Dashboard v5 – Labeled, Alerted, ReadableCurveGuard: Mongoose Edition
Track the macro tide before it turns.
This tool visualizes the three most-watched U.S. Treasury yield curve spreads:
2s10s (10Y - 2Y)
5s30s (30Y - 5Y)
3M10Y (10Y - 3M)
Each spread is plotted with dynamic color logic, inversion alerts, and floating labels. Background shading highlights historical inversion zones to help spot macro regime shifts in real time.
✅ Alert-ready
✅ Dark mode optimized
✅ Floating labels
✅ Clean layout for fast macro insight
📌 For educational and informational purposes only.
This script does not provide financial advice or trade recommendations.

FVG, Swing, Target, D/W/M High Low Detector Basic by Trader Riaz"FVG, Swing, Target, D/W/M High Low Detector Basic by Trader Riaz " is a powerful TradingView indicator designed to enhance your trading strategy by identifying key market structures and levels. This all-in-one tool detects Fair Value Gaps (FVGs), Swing Highs/Lows, and previous Day, Previous Week, and Previous Month Highs/Lows, helping traders make informed decisions with ease.
Key Features:
Bullish & Bearish FVG Detection: Highlights Fair Value Gaps with customizable colors, labels, and extension options.
Swing Highs & Lows: Automatically detects and marks Swing Highs and Lows with adjustable display settings and extensions.
Next Target Levels: Identifies potential price targets based on market direction (rising or falling).
Daily, Weekly, and Monthly High/Low Levels: Displays previous day, week, and month highs/lows with customizable colors.
Customizable Settings: Fully adjustable inputs for colors, number of levels to display, and extension periods.
Clean Visuals: Intuitive and non-intrusive design with dashed lines, labels, and tooltips for better chart readability.
This indicator is ideal for traders looking to identify key price levels, improve market structure analysis, and enhance their trading strategies.
Happy Trading,
Trader Riaz

Global M2 10-Week Lead (for bitcoin)This script displays a combined view of the Global M2 Money Supply, converted to USD and adjusted with a configurable forward lead (default 10 weeks). It is designed to help visualize macro liquidity trends and anticipate potential impacts on Bitcoin price movements across any timeframe.
🔹 Main Features:
- Aggregates M2 data from 18 countries and regions including the USA, Eurozone, China, Japan, and more.
- All M2 values are converted to USD using respective exchange rates.
- Customizable “Slide Weeks Forward” setting lets you project global liquidity data into the future.
- Works on all timeframes by adjusting the projection logic dynamically.
- Toggle each country’s data on or off to customize the liquidity model.
💡 Use Case:
Global liquidity is often a leading indicator for major asset classes. This tool helps traders and analysts assess macro-level trends and their potential influence on Bitcoin by looking at changes in M2 money supply worldwide.
💡 Inspired By:
This tool mimics the Global M2 10-Week Lead liquidity indicator often referenced by Raoul Pal of Real Vision and Global Macro Investor, used for macro analysis and Bitcoin movement prediction.
📊 Note:
All economic and FX data is sourced from TradingView’s built-in datasets (ECONOMICS and FX_IDC). Data availability may vary depending on your plan.

OverUnder Yield Spread🗺️ OverUnder is a structural regime visualizer , engineered to diagnose the shape, tone, and trajectory of the yield curve. Rather than signaling trades directly, it informs traders of the world they’re operating in. Yield curve steepening or flattening, normalizing or inverting — each regime reflects a macro pressure zone that impacts duration demand, liquidity conditions, and systemic risk appetite. OverUnder abstracts that complexity into a color-coded compression map, helping traders orient themselves before making risk decisions. Whether you’re in bonds, currencies, crypto, or equities, the regime matters — and OverUnder makes it visible.
🧠 Core Logic
Built to show the slope and intent of a selected rate pair, the OverUnder Yield Spread defaults to 🇺🇸US10Y-US2Y, but can just as easily compare global sovereign curves or even dislocated monetary systems. This value is continuously monitored and passed through a debounce filter to determine whether the curve is:
• Inverted, or
• Steepening
If the curve is flattening below zero: the world is bracing for contraction. Policy lags. Risk appetite deteriorates. Duration gets bid, but only as protection. Stocks and speculative assets suffer, regardless of positioning.
📍 Curve Regimes in Bull and Bear Contexts
• Flattening occurs when the short and long ends compress . In a bull regime, flattening may reflect long-end demand or fading growth expectations. In a bear regime, flattening often precedes or confirms central bank tightening.
• Steepening indicates expanding spread . In a bull context, this may signal healthy risk appetite or early expansion. In a bear or crisis context, it may reflect aggressive front-end cuts and dislocation between short- and long-term expectations.
• If the curve is steepening above zero: the world is rotating into early expansion. Risk assets behave constructively. Bond traders position for normalization. Equities and crypto begin trending higher on rising forward expectations.
🖐️ Dynamically Colored Spread Line Reflects 1 of 4 Regime States
• 🟢 Normal / Steepening — early expansion or reflation
• 🔵 Normal / Flattening — late-cycle or neutral slowdown
• 🟠 Inverted / Steepening — policy reversal or soft landing attempt
• 🔴 Inverted / Flattening — hard contraction, credit stress, policy lag
🍋 The Lemon Label
At every bar, an anchored label floats directly on the spread line. It displays the active regime (in plain English) and the precise spread in percent (or basis points, depending on resolution). Colored lemon yellow, neither green nor red, the label is always legible — a design choice to de-emphasize bias and center the data .
🎨 Fill Zones
These bands offer spatial, persistent views of macro compression or inversion depth.
• Blue fill appears above the zero line in normal (non-inverted) conditions
• Red fill appears below the zero line during inversion
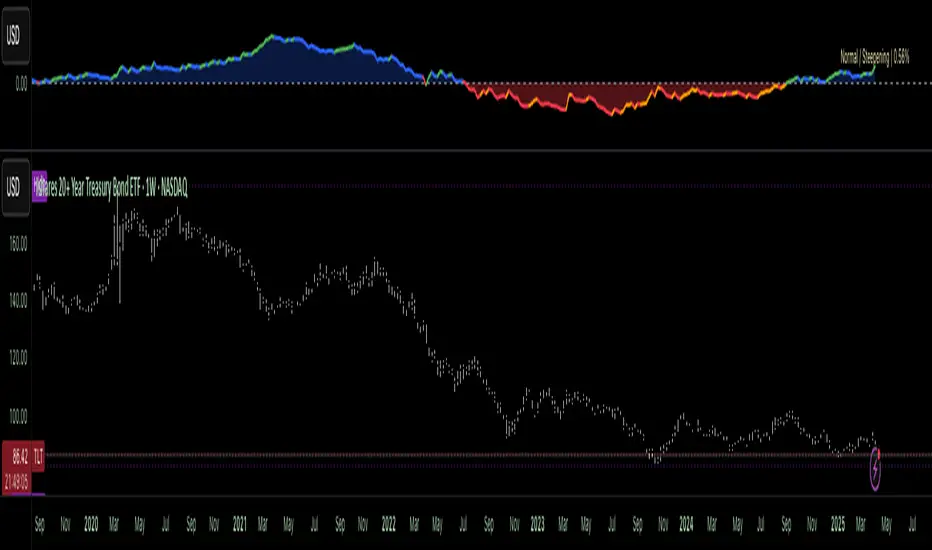
🧪 Sample Reading: 1W chart of TLT
OverUnder reveals a multi-year arc of structural inversion and regime transition. From mid-2021 through late 2023, the spread remains decisively inverted, signaling persistent flattening and credit stress as bond prices trended sharply lower. This prolonged inversion aligns with a high-volatility phase in TLT, marked by lower highs and an accelerating downtrend, confirming policy lag and macro tightening conditions.
As of early 2025, the spread has crossed back above the zero baseline into a “Normal / Steepening” regime (annotated at +0.56%), suggesting a macro inflection point. Price action remains subdued, but the shift in yield structure may foreshadow a change in trend context — particularly if follow-through in steepening persists.
🎭 Different Traders Respond Differently:
• Bond traders monitor slope change to anticipate policy pivots or recession signals.
• Equity traders use regime shifts to time rotations, from growth into defense, or from contraction into reflation.
• Currency traders interpret curve steepening as yield compression or divergence depending on region.
• Crypto traders treat inversion as a liquidity vacuum — and steepening as an early-phase risk unlock.
🛡️ Can It Compare Different Bond Markets?
Yes — with caveats. The indicator can be used to compare distinct sovereign yield instruments, for example:
• 🇫🇷FR10Y vs 🇩🇪DE10Y - France vs Germany
• 🇯🇵JP10Y vs 🇺🇸US10Y - BoJ vs Fed policy curves
However:
🙈 This no longer visualizes the domestic yield curve, but rather the differential between rate expectations across regions
🙉 The interpretation of “inversion” changes — it reflects spread compression across nations , not within a domestic yield structure
🙊 Color regimes should then be viewed as relative rate positioning , not absolute curve health
🙋🏻 Example: OverUnder compares French vs German 10Y yields
1. 🇫🇷 Change the long-duration ticker to FR10Y
2. 🇩🇪 Set the short-duration ticker to DE10Y
3. 🤔 Interpret the result as: “How much higher is France’s long-term borrowing cost vs Germany’s?”
You’ll see steepening when the spread rises (France decoupling), flattening when the spread compresses (convergence), and inversions when Germany yields rise above France’s — historically rare and meaningful.
🧐 Suggested Use
OverUnder is not a signal engine — it’s a context map. Its value comes from situating any trade idea within the prevailing yield regime. Use it before entries, not after them.
• On the 1W timeframe, OverUnder excels as a macro overlay. Yield regime shifts unfold over quarters, not days. Weekly structure smooths out rate volatility and reveals the true curvature of policy response and liquidity pressure. Use this view to orient your portfolio, define directional bias, or confirm long-duration trend turns in assets like TLT, SPX, or BTC.
• On the 1D timeframe, the indicator becomes tactically useful — especially when aligning breakout setups or trend continuations with steepening or flattening transitions. Daily views can also identify early-stage regime cracks that may not yet be visible on the weekly.
• Avoid sub-daily use unless you’re anchoring a thesis already built on higher timeframe structure. The yield curve is a macro construct — it doesn’t oscillate cleanly at intraday speeds. Shorter views may offer clarity during event-driven spikes (like FOMC reactions), but they do not replace weekly context.
Ultimately, OverUnder helps you decide: What kind of world am I trading in? Use it to confirm macro context, avoid fighting the curve, and lean into trades aligned with the broader pressure regime.
RSI + MA + Divergence + SnR + Price levelOverview
This indicator combines several technical analysis tools to give traders a comprehensive view based on the RSI indicator. Its main features include:
RSI & Moving Averages on RSI:
RSI: Calculates the RSI based on the closing price (or a user-selected source) with a configurable period (default is 14).
EMA and WMA: Computes and plots an Exponential Moving Average (EMA with a period of 9) and a Weighted Moving Average (WMA with a period of 45) on the RSI, helping to smooth out signals and better identify trends.
Price Ladder Based on RSI:
Draws horizontal lines at specified target RSI levels (from targetRSI1 to targetRSI7, default levels ranging from 20 to 80).
Calculates a target price based on the price change relative to the averaged gains and losses, providing an estimated price level when the RSI reaches those critical levels.
Divergence Detection:
Identifies divergence between price and RSI:
Bullish Divergence: Detected when the price forms a lower low but RSI fails to confirm with a corresponding lower low, with the RSI falling under a configurable threshold (d_below).
Bearish Divergence: Detected when the price forms a higher high while the RSI does not, with the RSI exceeding a configurable upper threshold (d_upper).
Optionally displays labels on the chart to alert the trader when divergence signals are detected.
Auto Support & Resistance on RSI:
Automatically calculates and plots support and resistance lines based on the RSI over different lookback periods (e.g., 34, 89, 200 bars).
Helps traders identify key RSI levels where price reversals or breakouts might occur.
Benefits for the Trader
This indicator is designed to assist traders in their decision-making process by integrating multiple technical analysis elements:
Identifying Market Trends:
By combining the RSI with its moving averages (EMA, WMA), traders can better assess market trends and the strength of these trends, thereby improving trade entry accuracy.
Early Reversal Signals via Divergence:
Divergence signals (both bullish and bearish) can help forecast potential reversals in the market, allowing traders to adjust their strategies timely.
Determining RSI-Based Support/Resistance Levels:
Automatic identification of support and resistance levels on the RSI provides key areas where a price reversal or breakout may occur, assisting traders in setting stop-loss and take-profit levels strategically.
Price Target Forecasting with the Price Ladder:
The target price labels calculated at important RSI levels provide insights into potential price objectives, aiding in risk management and profit planning.
Flexible Configuration:
Traders can customize key parameters such as the RSI period, lengths for EMA and WMA, target RSI levels, divergence conditions, and support/resistance settings. This flexibility allows the indicator to adapt to different trading styles and strategies.
How to read data
Some use-cases
Used to estimate price according to the RSI level.
When you trade using RSI, you want to set your stop-loss or take-profit levels based on RSI. By looking at the price ladder, you know the corresponding price level to enter a trade.
Used to determine the entry zone.
RSI often reacts to its own previously established support/resistance levels. Use the Auto SnR feature to identify those zones.
Used to determine the trend.
RSI and its moving averages help identify the price trend:
Uptrend: 3 lines separate and point upward.
Downtrend: 3 lines separate and point downward.
Use WMA45 to determine the trend:
Uptrend: WMA45 is moving upward or trading above the 50 level.
Downtrend: WMA45 is moving downward or trading below the 50 level.
Sideways: WMA45 is trading around the 50 level.
Use EMA9 to confirm the trend: A crossover of EMA9 through WMA45 confirms the formation of a new trend.
Configuration
The script allows users to configure a number of important parameters to suit their analytical preferences:
RSI Settings:
RSI Length (rsiLengthInput): The number of periods used to compute the RSI (default is 14, adjustable as needed).
RSI Source (rsiSourceInput): Select the price source (default is the closing price).
RSI Color (rsiClr): The color used to display the RSI line.
Moving Averages on RSI:
EMA Length (emaLength): The period for calculating the EMA on RSI (default is 9).
WMA Length (wmaLength): The period for calculating the WMA on RSI (default is 45).
EMA Color (emaClr) and WMA Color (wmaClr): Customize the colors of the EMA and WMA lines.
Price Ladder Settings:
Toggle Price Ladder (showPrice): Enable or disable the display of the price ladder.
Target RSI Levels: targetRSI1 through targetRSI7: RSI values at which target prices are calculated (default values range from 20, 30, 40, 50, 60, 70 to 80).
Price Label Color (priceColor): The text color for displaying the target price labels.
Divergence Settings:
Divergence Toggle (calculateDivergence): Option to enable or disable divergence calculation and display.
Divergence Conditions:
d_below: RSI level below which bullish divergence is considered.
d_upper: RSI level above which bearish divergence is considered.
Display Divergence Labels (showDivergenceLabel): Option to display labels on the chart when divergence is detected.
Auto Support & Resistance on RSI:
Toggle Auto S&R (enableAutoSnR): Enable or disable automatic plotting of support and resistance levels.
Lookback Periods for Support/Resistance:
L1_lookback: Lookback period for level 1 (e.g., 34 bars).
L2_lookback: Lookback period for level 2 (e.g., 89 bars).
L3_lookback: Lookback period for level 3 (e.g., 200 bars).
Support and Resistance Colors:
rsiSupportClr: Color for the support line.
rsiResistanceClr: Color for the resistance line.
Alerts:
Divergence Alerts: Alert conditions are set up to notify the trader when bullish or bearish divergence is detected, aiding in timely decision-making.

Dkoderweb repainting issue fix strategyHarmonic Pattern Recognition Trading Strategy
This TradingView strategy called "Dkoderweb repainting issue fix strategy" is designed to identify and trade harmonic price patterns with optimized entry and exit points using Fibonacci levels. The strategy implements various popular harmonic patterns including Bat, Butterfly, Gartley, Crab, Shark, ABCD, and their anti-patterns.
Key Features
Pattern Recognition: Identifies 17+ harmonic price patterns including standard and anti-patterns
Fibonacci-Based Entries and Exits: Uses customizable Fibonacci levels for precision entries, take profits, and stop losses
Alternative Timeframe Analysis: Option to use higher timeframes for pattern identification
Heiken Ashi Support: Optional use of Heiken Ashi candles instead of regular candlesticks
Visual Indicators:
Pattern visualization with ZigZag indicator
Buy/sell signal markers
Color-coded background to highlight active trade zones
Customizable Fibonacci level display
How It Works
The strategy uses a ZigZag-based pattern identification system to detect pivot points
When a valid harmonic pattern forms, the strategy calculates the optimal entry window using the specified Fibonacci level (default 0.382)
Entries trigger when price returns to the entry window after pattern completion
Take profit and stop loss levels are automatically set based on customizable Fibonacci ratios
Visual alerts notify you of entries and exits
The strategy tracks active trades and displays them with background color highlights
Customizable Settings
Trade size
Entry window Fibonacci level (default 0.382)
Take profit Fibonacci level (default 0.618)
Stop loss Fibonacci level (default -0.618)
Alert messages for entries and exits
Display options for specific Fibonacci levels
Alternative timeframe selection
This strategy is designed to fix repainting issues that are common in harmonic pattern strategies, ensuring more reliable signals and backtesting results.

Dkoderweb repainting issue fix indicator# Harmonic Pattern Trading Indicator for TradingView
This indicator, called "Dkoderweb repainting issue fix indicator," is designed to identify and trade harmonic chart patterns in financial markets. It uses Fibonacci relationships between price points to detect various patterns like Bat, Butterfly, Gartley, Crab, Shark, and others.
## Key Features:
- **Pattern Recognition**: Automatically identifies over a dozen harmonic patterns including standard and anti-patterns
- **Customizable Settings**: Options to use Heikin Ashi candles and alternate timeframes
- **Fibonacci Levels**: Configurable display of key Fibonacci retracement levels
- **Entry and Exit Signals**: Clear buy/sell signals with visual triangles above/below bars
- **Trade Management**: Automatic take-profit and stop-loss levels based on Fibonacci relationships
- **Visual Aids**: Color-coded backgrounds to highlight active trade zones
- **Alert System**: Customizable alert messages for trade entries and exits
## How It Works:
The indicator uses a zigzag function to identify significant price pivots, then analyzes the relationships between these pivots to detect specific harmonic patterns. When a valid pattern forms and price reaches the entry zone (defined by a Fibonacci level), the indicator generates a trade signal.
Each pattern has specific Fibonacci ratio requirements between its points, and the indicator continuously scans for these relationships. Trade management is handled automatically with predefined take-profit and stop-loss levels.
This version specifically addresses repainting issues that are common in pattern-detection indicators, making it more reliable for both backtesting and live trading.
