Global M2 Money Supply // Days Offset =Implementation of Colin Crypto M2 money supply indicator which seems to lead BTC movement.
Forecasting

US30 RSI Seasonal Long Strategy (1D)The best months of the last 10 years of the US30 are shown here
Green weaker months with a win ratio of 70% red strong months with a win ratio of 90% or more
An EMA and an RSI are used as entry signals

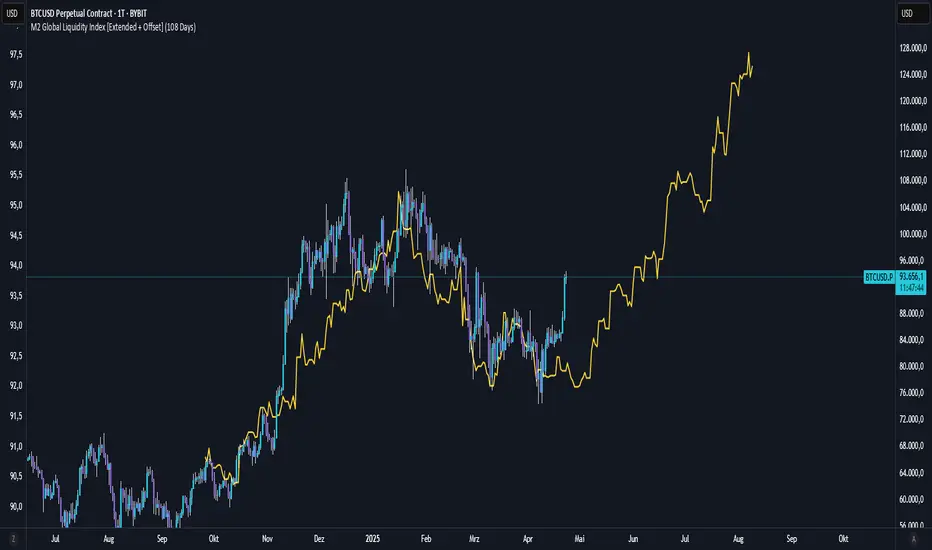
M2 Global Liquidity Index [Extended + Offset]M2 Global Liquidity Index
This indicator visualizes global M2 money supply, weighted in USD, based on major economic regions.
Features:
Standard Mode: Includes M2 data from the USA, China, Eurozone, Japan, and the UK.
Extended Mode: Adds Switzerland, Canada, India, Russia, Brazil, South Korea, Mexico, and South Africa.
Offset Function: Adjustable time lag (78 or 108 days) to analyze the delayed impact of liquidity on financial markets.
Use Case:
Designed to help identify global liquidity cycles and assess potential turning points in financial markets. Rising global liquidity generally supports risk assets like equities and crypto, while declining liquidity can put downward pressure on these markets.
Technical Details:
Non-USD M2 values are converted using real-time FX rates.
All values are displayed in trillions of USD (Tn).
Note:
Not all countries release M2 data in real-time or at the same frequency. Minor delays and discrepancies may occur.
Example:
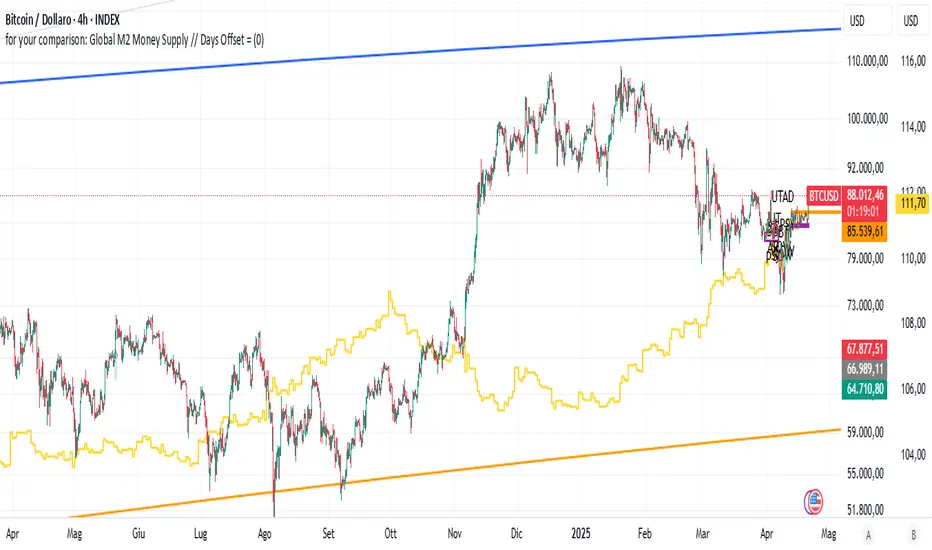
for your comparison: Global M2 Money Supply // Days Offset =📈 Global M2 Money Supply Overlay – Offset Adjustable
This script plots an aggregated, FX-adjusted global M2 money supply index directly on your TradingView chart. It pulls M2 data from multiple global regions—including North America, Europe, Asia, Latin America, and more—and normalizes it for comparison in USD terms.
You can apply a custom time offset to the M2 line using the settings, allowing you to test potential leading or lagging correlations between global liquidity and market price action (e.g., Bitcoin, equities, commodities).
💡 Ideal for macro traders, long-term investors, and anyone interested in liquidity-driven market behavior.
Features:
Combines M2 data from 20+ countries and currency zones
FX-adjusted for consistency in USD terms
Offset slider to shift M2 data forward or backward in time
Scaled to trillions for readability
Plots directly on the main chart for visual comparison
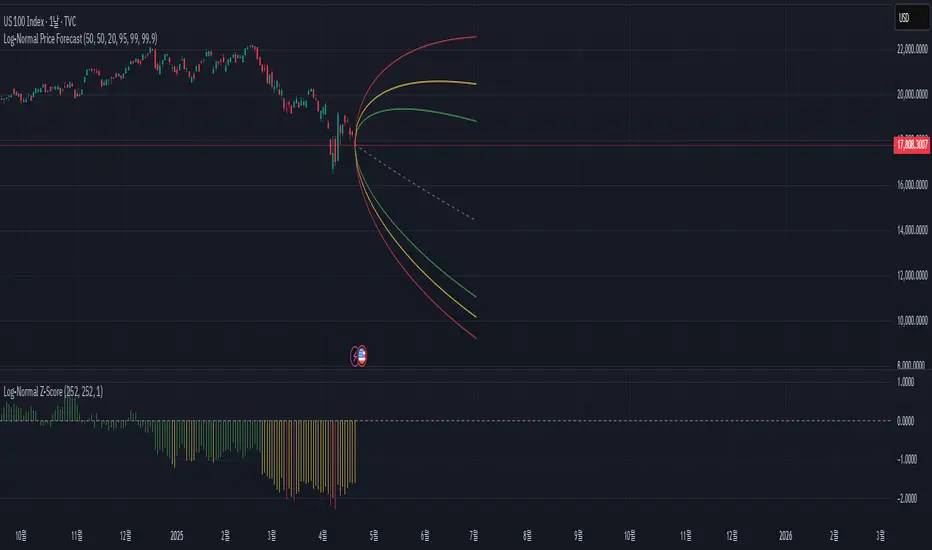
Log-Normal Price ForecastLog-Normal Price Forecast
This Pine Script creates a log-normal forecast model of future price movements on a TradingView chart, based on historical log returns. It plots expected price trajectories and bands representing different levels of statistical deviation.
Parameters
Model Length – Number of bars used to calculate average and standard deviation of log returns (default: 100).
Forecast Length – Number of bars into the future for which the forecast is projected (default: 100, max: 500).
Volatility SMA Length – The smoothing length for the standard deviation (default: 20).
Confidence Intervals – Confidence intervals for price bands (default: 95%, 99%, 99.9%).
EMA200/EMA7 HA w/ TP/SL & Markdown Alerts1. Purpose
A hybrid trend-and-momentum strategy on Heikin-Ashi candles that:
Enters long when price is sufficiently below the 200-period EMA and then crosses up above the 7-period EMA, plus bullish HA trend/momentum.
Enters short when price is sufficiently above the 200-period EMA and then crosses down below the 7-period EMA, plus bearish HA trend/momentum.
Applies configurable take-profit and stop-loss levels on every trade.
Emits rich “Markdown” alerts and plots key levels and a live stats table on the chart.
2. Inputs
Input Description Default
Enable Longs Toggle permission to open long trades true
Enable Shorts Toggle permission to open short trades false
Take Profit % TP distance from entry (percent) 2 %
Stop Loss % SL distance from entry (percent) 2 %
Long Threshold % How far below EMA200 price must be to trigger a long raw signal 0.1 %
Short Threshold % How far above EMA200 price must be to trigger a short raw signal 0.1 %
3. Core Calculations
Heikin-Ashi candles
ha_open / ha_close via request.security(heikinashi,…)
Trend EMAs on HA close
ema200 (200-period) in red
ema7 ( 7-period) in blue
Trend filters
Bullish HA if ha_close > ha_open
Bearish HA if ha_close < ha_open
Momentum filters (two consecutive HA closes rising/falling)
momBull: two rising bars
momBear: two falling bars
4. Signal Generation
Raw long signal (sigLong0) when
(ema200 - ha_close)/ema200 > thLong (price sufficiently below EMA200)
ta.crossover(ha_close, ema7)
Raw short signal (sigShort0) when
(ha_close - ema200)/ema200 > thShort (price sufficiently above EMA200)
ta.crossunder(ha_close, ema7)
Final signals only fire if the corresponding raw signal AND trend/momentum filters and the “enable” checkbox are satisfied.
5. Entries & Exits
On Long:
Record entryPrice = close
Compute tpLine = entryPrice * (1 + tpPerc)
Compute slLine = entryPrice * (1 - slPerc)
strategy.entry("Long", …)
On Short:
tpLine = entryPrice * (1 - tpPerc)
slLine = entryPrice * (1 + slPerc)
strategy.entry("Short", …)
All exits handled by
pinescript
Copier
Modifier
strategy.exit("Exit Long", from_entry="Long", limit=tpLine, stop=slLine)
strategy.exit("Exit Short", from_entry="Short", limit=tpLine, stop=slLine)
6. Alerts
Rich Markdown alerts sent at each entry, containing:
Pair & exchange
Entry price & leverage (hard-coded “5x”)
Calculated TP & SL levels
Simpler alertconditions for chart-based alerts:
“🔥 Achat {{ticker}} à {{close}}”
“❄️ Vente {{ticker}} à {{close}}”
7. Visuals & Stats Table
Plots:
TP/SL lines in green/red (only when a position is open)
EMA200 (red) & EMA7 (blue) overlays
Live stats table (bottom-right) updated every 10 bars showing:
Total trades
Win rate (%)
Net profit
Average profit per trade
Max drawdown
In essence, this strategy blends a trend-filter (200 EMA) with a momentum-confirmation (crossover of 7 EMA on HA bars), applies strict risk management (TP/SL), and surfaces both visual and alert-based feedback to help you capture small, disciplined scalps in trending markets. Ready for telegram


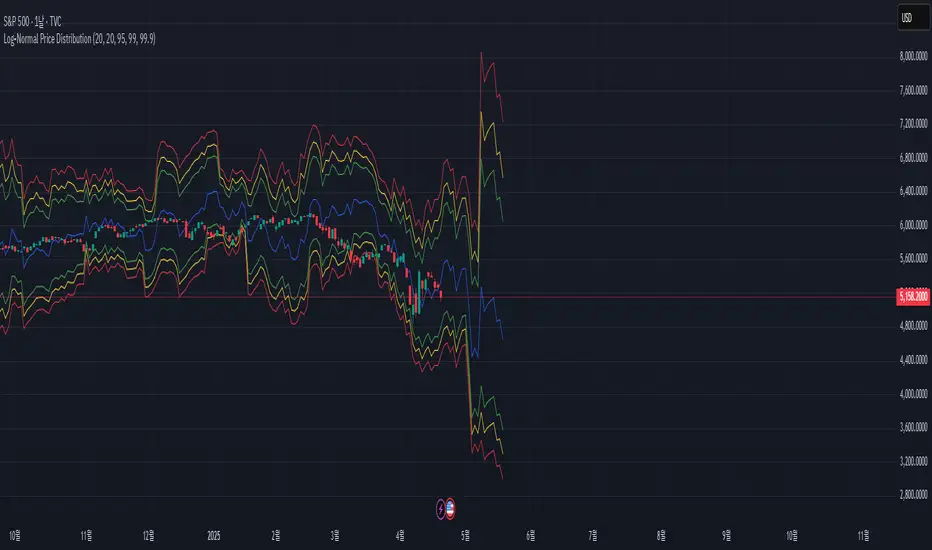
Log-Normal Price DistributionThis Pine Script indicator plots a log-normal distribution model of future price projections on a TradingView chart. It visualizes the potential price ranges based on the statistical properties (mean and standard deviation) of log returns over a defined period. It's particularly useful for analyzing potential volatility and predicting future price ranges.
BTC 雙MACD 背離策略(基礎共振 / 適用15分鐘 / 多空自動)📌 Strategy Name: BTC Dual MACD Divergence Strategy (15min, Auto Long & Short)
🔍 Overview:
This strategy uses a dual MACD divergence signal (fast and slow MACD) combined with a proximity filter to the 28-period Simple Moving Average (SMA28) to detect potential trend reversals with stronger confirmation.
🧠 Entry Conditions:
Bullish or Bearish divergence detected on both fast and slow MACD.
Price must be within ±1.5% of the SMA28 (proximity condition).
Long and short entries are allowed automatically.
🎯 Exit Conditions:
Fixed Risk-to-Reward ratio of 1:1.5.
Take Profit: +1.5% from entry price.
Stop Loss: -1.0% from entry price.
⏱ Timeframe:
Optimized for 15-minute charts.
Can be integrated with auto-trading bots via alerts/webhooks.
⚠️ Notes:
This strategy is designed for technical validation and automation testing.
Please backtest thoroughly and use proper risk management before applying in live trading.
Ideal for pairing with platforms like WunderTrading, 3Commas, or other webhook-based bot systems.

🔥 Entry-Exit + choppy Zone [Phil Vo]🔥 Entry-Exit Master Tool | ATR Zones + Choppy Filter + Trap Detection
📘 Description:
This script is a high-precision scalping assistant designed to improve trade timing and reduce emotional, low-conviction entries. It blends volatility-based logic, market strength confirmation, and choppy zone detection into a clean visual format to help traders make better decisions in fast-paced 1–5 minute environments.
Built for active traders of SPY, QQQ, and other liquid assets, this tool focuses on three key areas:
Entry & Exit Calculation using ATR logic
Choppy/Sideways Zone Detection to avoid poor conditions
Market Maker Trap Zones to identify manipulation-prone areas
This script acts as a disciplined trading co-pilot: filter the noise, highlight opportunity, and help you stick to the plan.
🧠 Core Features:
✅ Entry-Exit Zones (ATR-Based)
Calculates volatility-adjusted buffer zones using ATR Period and Multiplier
Helps avoid chasing entries during low volatility or fake momentum moves
⚠️ Choppy/Sideways Zone Detection
Marks uncertain, low-momentum environments using:
ATR compression
Weak ADX (trend strength)
Narrow price range
Below-average volume
Grey background + grey dots on candles signal chop zones
Designed to help you stay out, exit early, or wait for clarity
Especially effective for avoiding scalping traps during consolidations
🧱 Market Maker Trap Zones
Identifies high-probability reversal areas near swing highs/lows
Uses RSI + swing logic to warn of potential liquidity grabs or false breakouts
📋 How to Use:
Look for Buy/Sell Labels outside grey chop zones.
Use VWAP or trend confirmation to strengthen the trade idea.
Avoid trading inside choppy zones – grey background = no-fly zone.
Exit positions early if price re-enters a chop zone or volume/ADX collapses.
Watch for reversal plays near trap zones – swing highs/lows may reverse quickly
⚙️ Recommended Settings for 1–5 Minute Scalping:
Setting Suggested Value Notes
ATR Period 7 – 10 Faster reaction to volatility
ATR Multiplier 1.2 – 1.4 Tighter stops for scalping
Trend SMA Period 10 – 14 Short-term trend filter
Min ATR Volatility 0.08 – 0.1 Filters slow bars
Choppy Lookback Period 10 – 14 Recent bar scan for chop
ADX Length / Threshold 10 / 20 – 25 Detects weak or strong trend strength
Volume Lookback / Multiplier 14 / 0.7 – 0.8 Filters weak volume activity
RSI Length / Swing Lookback 14 / 3 – 5 Used for trap zone logic
Zone Size Multiplier 0.002 – 0.003 Controls sensitivity of trap zones
ATR Padding Strength 1.2 – 1.5 Adds margin to trap zone detection
👁️ Visuals on Chart:
✅ Buy/Sell Labels = Entry signal confirmation
✅ Grey background = Choppy/sideways zone – avoid entries!
✅ Grey dots = Choppy candles within chop zone
✅ Colored lines/zones = Market structure + trap zones
⚠️ Disclaimer:
This script is for educational purposes only and does not constitute financial advice. Always test and validate any system before applying in live markets.

Daily ATR BandsATR Finder – Volatility Scanner for Smarter Trade Setups
The ATR Finder is a precision tool designed to help traders quickly identify high-volatility assets using the Average True Range (ATR) – a key metric in assessing market momentum and potential breakout zones. By automatically scanning and highlighting tickers or candles with elevated ATR values relative to their recent historical range, this indicator helps you filter for setups that are more likely to experience significant price moves.
Whether you're a day trader seeking intraday momentum or a swing trader looking for setups with strong follow-through potential, the ATR Finder cuts through the noise and visually signals which assets are "on the move." It can be paired with other indicators or price action tools to create a high-conviction trading strategy focused on volatility expansion.
Key Features:
Dynamic ATR Calculation over a user-defined period
Visual Alerts or Color-Coding for above-threshold volatility spikes
Supports Multiple Timeframes for both short- and long-term volatility analysis
Great for spotting breakout opportunities, gap continuations, or trend reversals
Use the ATR Finder to stay ahead of price action and build a watchlist that moves with purpose. Perfect for scalpers, breakout traders, and anyone who respects the power of volatility.

SMART MONEY CheckListIndicator 4 my Twins 😍
It's meant to simplify top-down analysis.
Do you have more "Yes" than "No" and your setup is there?
Let's fckn goooo!!!
😆😆😆

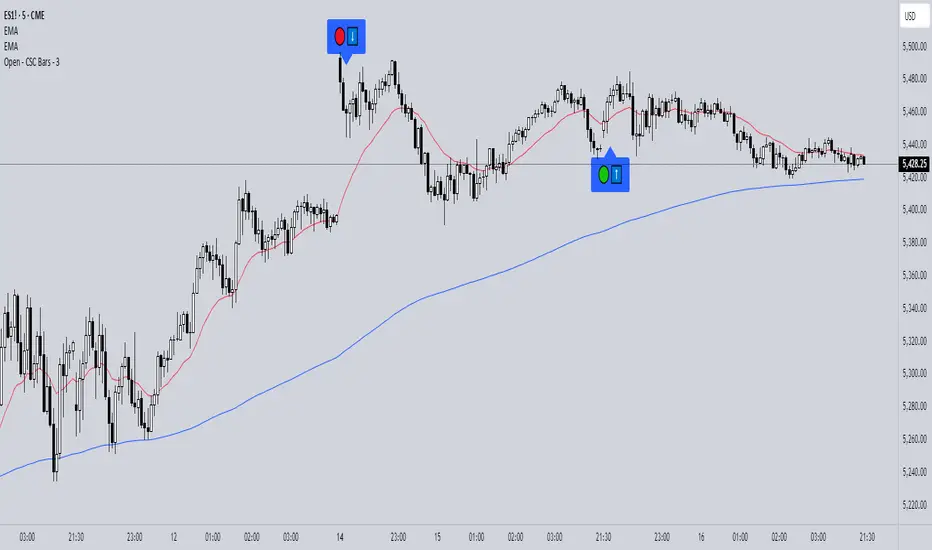
Open - CSC Bars - 33 CSC Bars – Early Session Price Action Filter
This script detects when the first three bars of the RTH (Regular Trading Hours) session all move in the same direction — either all bullish or all bearish.
It’s a tool for price action traders who want to develop structured opening strategies by observing clean directional agreement at the session start. The indicator highlights the third bar when the sequence confirms directional bias.
🔍 How It Works:
Monitors the first three bars after the RTH session begins.
If all three bars are bullish, it highlights the third bar (same for bearish sequences).
No projections, signals, or entries—purely a visual tool to observe and study opening behavior.
🎯 Use Case:
This script is designed to help traders build and test opening-based frameworks by identifying potential trend bias early in the day.
Note: This is an open-source utility script with a simple function. It does not generate signals or predictions and is intended to assist with observation and discretionary strategy building.
P&F Screener Dashboard w/ Trade Ideas + Alerts + TargetsThis advanced screener and dashboard script is designed for active traders who want to:
1. Monitor multiple optionable stocks simultaneously.
2. Identify Point & Figure-based breakouts and breakdowns.
3. Automatically calculate and visualize breakout/breakdown targets.
4. Highlight when targets are hit.
5. Get trade idea suggestions (e.g., vertical spreads).
6. Display a scanner-style dashboard with market trend context.
7. Generate alerts and chart markers to stay ahead of price action.
The script combines technical analysis (P&F logic, moving averages) with strategy design (target projection, trade suggestions) into a single streamlined workspace.
Designed for use with your preferred watchlist—simply customize the symbols and you're ready to trade smarter.

Candlestick Patterns (5m)Candlestick Patterns (5 m) Indicator
This Pine Script v6 indicator automatically scans true 5‑minute bars (via request.security) and highlights four of the most reliable reversal and indecision patterns directly on any chart. It’s designed to help scalpers and swing traders quickly spot turning points without manual pattern-drawing.
Key Features
Multi‑Timeframe Detection: Always uses 5 min data, regardless of your chart’s timeframe.
Four Core Patterns:
Hammer (▲): Bullish reversal with a long lower wick and small body.
Bullish Engulfing (↑): Two‑bar reversal where a green candle fully engulfs the prior red.
Doji (✕): Market indecision when open and close are nearly identical.
Dark Cloud Cover (↓): Bearish reversal closing below the midpoint of the previous green candle.
Customizable Inputs:
Toggle each pattern on/off.
Adjust body‑size thresholds (as % of range) and wick‑to‑body multipliers for hammers and dojis.
Choose whether to use barmerge.lookahead_on (real‑time signals) or …_off (no repaint).
Non‑Repainting Logic: Default lookahead is off so you only see confirmed signals at bar close.
How It Works
Fetch 5 m OHLC: The script pulls 5 min open, high, low, and close values.
Compute Pattern Criteria: Body/range ratios and price relationships determine when a pattern qualifies.
Plot Shapes: Each pattern draws a distinct shape (triangle, arrow, cross) above or below the bar.
Use Cases
Scalping: Quickly identify sharp reversals on high‑volatility moves.
Validation: Combine with moving averages, volume filters, or trendlines to confirm high‑probability setups.
Backtesting: Adjust sensitivity inputs and backtest clusters of signals over historical 5 min data.
Paste this description into your indicator’s comments or TradingView description field to explain its purpose and settings to other users—or bookmark it as a quick reference when you tune the inputs.

VWAP Bounce & SqueezeIt includes:
VWAP
20/50 EMA
Volume spike and candle body simulating Bookmap/DOM
custom confluence detection for VWAP, EMA, candle structure
15 minute Opening Range
signals for long and short opportunities
automated risk/reward boxes
automated trailing stop suggestions

Volumen Extremo + SRThis indicator detects high-impact trading moments by combining:
Volume spikes (3x or 5x above average)
Strong candle bodies
Dynamic support/resistance zones (based on recent highs/lows)
It highlights key turning points in the market—whether due to whale take-profits, institutional exits, or breakout confirmations.
🔺 Green/Red Arrows:
Appear when volume is 3× the average and the candle has a significant body
→ Confirms strong market conviction (buy/sell)
🌟 Fuchsia Star:
Appears when volume exceeds 5× average with a large-bodied candle
→ Signals extreme moves, whale actions or liquidation spikes
🟩 Support Line (green):
Dynamic recent lowest price (lookback configurable)
→ Identifies zones where buyers previously stepped in
→ Identifies zones where buyers previously stepped in
🟥 Resistance Line (red):
Dynamic recent highest price (lookback configurable)
→ Shows zones where sellers previously dominated
Alerts Included:
Bullish breakout with volume
Bearish rejection with volume
Volume explosion alerts for extreme moves
Don't guide yourself by man uptrend if it doesn't have exceptional volume.
By Teo Mariscal

Oath KeeperOath Keeper - Advanced Money Flow & Market Dynamics Indicator
A sophisticated indicator that analyzes market dynamics through money flow patterns, volume analysis, and liquidation detection to identify high-probability trading opportunities.
Core Features:
• Smart Money Flow Analysis: Proprietary calculation of institutional money movement
• Volume-Enhanced Signals: Multi-timeframe volume confirmation
• Liquidation Detection: Identifies potential forced liquidation events
• Advanced Signal Classification: Regular, Super, and Fakeout signals
Signal Types:
1. Regular Signals (Green/Purple Circles)
• Volume-confirmed momentum shifts
• Money flow threshold breaches
• Institutional participation confirmation
2. Super Signals (Green/Purple Squares)
• Deep oversold/overbought reversals
• High-volume rejection patterns
• Liquidation event confirmation
3. Fakeout Signals (Red X)
• Rapid sentiment shifts
• Trap detection
• False breakout warnings
Visual Components:
• Dynamic Money Flow Line (White/Purple)
• Order Flow Clouds (Green/Red with high transparency)
• Reference Levels (20, 50, 80)
• Multi-type Signal Markers
• Color-coded momentum visualization
Interpretation Guide:
• Green Cloud: Bullish money flow dominance
• Red Cloud: Bearish money flow dominance
• Circle Markers: Standard reversals
• Square Markers: High-conviction moves
• X Markers: Potential trap zones
Best Practices:
• Most effective on 1H+ timeframes
• Use with major trading pairs
• Wait for candle close confirmation
• Combine with support/resistance levels
• Monitor volume confirmation
• Use multiple timeframe analysis
This indicator helps traders identify institutional money flow, potential liquidation events, and market reversals by analyzing volume patterns and money flow dynamics, providing multiple confirmation layers for trade decisions.
Note: Performance varies with market conditions and timeframes. Always employ proper risk management.
🌀 Choppy Market Detector Only [Phil Vo]🔀 New Tool: Filters Out Chop So You Can Focus on Clean Moves
Choppy Market Detector – Spot the No-Trade Zones Like a Pro
When price just dances around, faking both sides — that's chop. And chop kills.
This tool is designed to visually alert you when the market is indecisive and not worth your risk.
🧠 What It Does:
* Detects low momentum, tight-range candles, and lack of trend.
* Highlights these choppy areas with a gray background zone — so you can instantly identify danger zones.
* Also shows gray dot markers below candles for additional visual confirmation.
📊 How to Use It:
1. When you see a gray background, it's time to pause or reduce trade frequency.
2. Avoid entering trades blindly inside this zone — wait for a breakout and retest with confirmation.
3. Use this tool alongside EMA/VWAP, SMC, or your current edge to filter out bad conditions.
✅ Perfect For:
* Scalpers who want to preserve capital.
* Traders who get shaken out by noise and want to avoid overtrading.
🔧 Pro Tips:
* Combine this with a reversal zone detector or volume spike alert to know when momentum is picking back up.
* Use this during the first 2 hours after open and pre-market sessions — that's where chop is most common.
🔒 This tool is for educational use only. Not financial advice. Always backtest and use discipline before trading.

StochDL 355This is a Stochastic indicator marking Regular and Hidden Divergence which I liked from the script of Dev Lucem who called his indicator "Plain Stochastic Divergence". I call this indicator StochDL to give Dev Lucem credit for his original contribution. I noticed in his original script that the %K and %D calculation could be improved which I changed to be: period K and period D should be calculated to be %K. Then smooth K and %K should be smoothed to get %D.
His script nicely identifies regular and hidden divergence for %K. However, I then added script to also identify regular and hidden divergence for %D. The "top Spot" and "Bottom Spot" mark when the divergence is complete. It is not my intention to claim that I solely generated this indicator, however, I have altered and added content to make this indicator unique from the original.
I use these arrows for to alert me that there is divergence. I then use other indicators to confirm a change of trend has taken place.

Global M2/M3 Liquidity IndexThis Indicator takes M3 data from 20 of the largest Central banks. M3 data is not available for USA and CHINA and has been substituted with M2.
Overall M3 captures far more than M2 and is therefore a superior model when attempting to track global liquidity.
This indicator also allows the data to be pushed forward to adjust for the lagged effect global liquidity has on markets.
The recommended lag is 90 days.

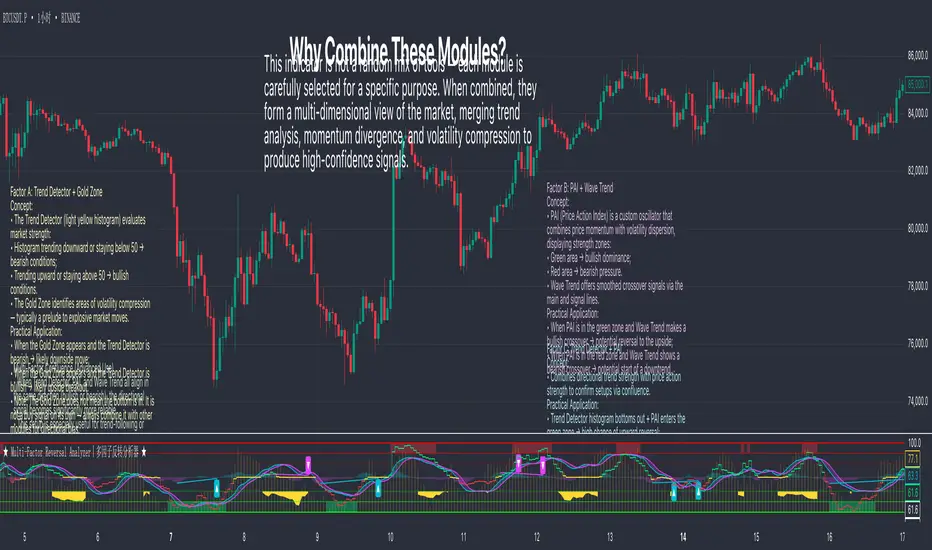
Multi-Factor Reversal AnalyzerMulti-Factor Reversal Analyzer – Quantitative Reversal Signal System
OVERVIEW
Multi-Factor Reversal Analyzer is a comprehensive technical analysis toolkit designed to detect market tops and bottoms with high precision. It combines trend momentum analysis, price action behavior, wave oscillation structure, and volatility breakout potential into one unified indicator.
This indicator is not a random mix of tools — each module is carefully selected for a specific purpose. When combined, they form a multi-dimensional view of the market, merging trend analysis, momentum divergence, and volatility compression to produce high-confidence signals.
Why Combine These Modules?
Module Combination Ideas & How to Use Them
Factor A: Trend Detector + Gold Zone
Concept:
• The Trend Detector (light yellow histogram) evaluates market strength:
• Histogram trending downward or staying below 50 → bearish conditions;
• Trending upward or staying above 50 → bullish conditions.
• The Gold Zone identifies areas of volatility compression — typically a prelude to explosive market moves.
Practical Application:
• When the Gold Zone appears and the Trend Detector is bearish → likely downside move;
• When the Gold Zone appears and the Trend Detector is bullish → likely upside breakout.
• Note: The Gold Zone does not mean the bottom is in. It is not a buy signal on its own — always combine it with other modules for directional bias.
Factor B: PAI + Wave Trend
Concept:
• PAI (Price Action Index) is a custom oscillator that combines price momentum with volatility dispersion, displaying strength zones:
• Green area → bullish dominance;
• Red area → bearish pressure.
• Wave Trend offers smoothed crossover signals via the main and signal lines.
Practical Application:
• When PAI is in the green zone and Wave Trend makes a bullish crossover → potential reversal to the upside;
• When PAI is in the red zone and Wave Trend shows a bearish crossover → potential start of a downtrend.
Factor C: Trend Detector + PAI
Concept:
• Combines directional trend strength with price action strength to confirm setups via confluence.
Practical Application:
• Trend Detector histogram bottoms out + PAI enters the green zone → high chance of upward reversal;
• Histogram tops out + PAI in the red zone → increased likelihood of downside continuation.
Multi-Factor Confluence (Advanced Use)
• When Trend Detector, PAI, and Wave Trend all align in the same direction (bullish or bearish), the directional signal becomes significantly more reliable.
• This setup is especially useful for trend-following or swing trade entries.
KEY FEATURES
1. Multi-Layer Reversal Logic
• Combines trend scoring, oscillator divergence, and volatility squeezes for triangulated reversal detection.
• Helps traders distinguish between trend pullbacks and true reversals.
2. Advanced Divergence Detection
• Detects both regular and hidden divergences using pivot-based confirmation logic.
• Customizable lookback ranges and pivot sensitivity provide flexible tuning for different market styles.
3. Gold Zone Volatility Compression
• Highlights pre-breakout zones using custom oscillation models (RSI, harmonic, Karobein, etc.).
• Improves anticipation of breakout opportunities following low-volatility compressions.
4. Trend Direction Context
• PAI and Trend Score components provide top-down insight into prevailing bias.
• Built-in “Straddle Area” highlights consolidation zones; breakouts from this area often signal new trend phases.
5. Flexible Visualization
• Color-coded trend bars, reversal markers, normalized oscillator plots, and trend strength labels.
• Designed for both visual discretionary traders and data-driven system developers.
USAGE GUIDELINES
1. Applicable Markets
• Suitable for stocks, crypto, futures, and forex
• Supports reversal, mean-reversion, and breakout trading styles
2. Recommended Timeframes
• Short-term traders: 5m / 15m / 1H — use Wave Trend divergence + Gold Zone
• Swing traders: 4H / Daily — rely on Price Action Index and Trend Detector
• Macro trend context: use PAI HTF mode for higher timeframe overlays
3. Reversal Strategy Flow
• Watch for divergence (WT/PAI) + Gold Zone compression
• Confirm with Trend Score weakening or flipping
• Use Straddle Area breakout for final trigger
• Optional: enable bar coloring or labels for visual reinforcement
• The indicator performs optimally when used in conjunction with a harmonic pattern recognition tool
4. Additional Note on the Gold Zone
The “Gold Zone” does not directly indicate a market bottom. Since it is displayed at the bottom of the chart, it may be misunderstood as a bullish signal. In reality, the Gold Zone represents a compression of price momentum and volatility, suggesting that a significant directional move is about to occur. The direction of that move—upward or downward—should be determined by analyzing the histogram:
• If histogram momentum is weakening, the Gold Zone may precede a downward move.
• If histogram momentum is strengthening, it may signal an upcoming rebound or rally.
Treat the Gold Zone as a warning of impending volatility, and always combine it with trend indicators for accurate directional judgment.
RISK DISCLAIMER
• This indicator calculates trend direction based on historical data and cannot guarantee future market performance. When using this indicator for trading, always combine it with other technical analysis tools, fundamental analysis, and personal trading experience for comprehensive decision-making.
• Market conditions are uncertain, and trend signals may result in false positives or lag. Traders should avoid over-reliance on indicator signals and implement stop-loss strategies and risk management techniques to reduce potential losses.
• Leverage trading carries high risks and may result in rapid capital loss. If using this indicator in leveraged markets (such as futures, forex, or cryptocurrency derivatives), exercise caution, manage risks properly, and set reasonable stop-loss/take-profit levels to protect funds.
• All trading decisions are the sole responsibility of the trader. The developer is not liable for any trading losses. This indicator is for technical analysis reference only and does not constitute investment advice.
• Before live trading, it is recommended to use a demo account for testing to fully understand how to use the indicator and apply proper risk management strategies.
CHANGELOG
v1.0: Initial release featuring integrated Price Action Index, Trend Strength Scoring, Wave Trend Oscillator, Gold Zone Compression Detection, and dual-type divergence recognition. Supports higher timeframe (HTF) synchronization, visual signal markers, and diversified parameter configurations.
TRAMA - Trend Regularity Adaptive Moving AverageThe TRAMA Line is an advanced, adaptive moving average that adjusts its speed based on market volatility. It’s designed to react quickly to price momentum shifts while filtering out noise — making it perfect for scalping, intraday, and swing trading.
What Makes It Special:
📊 Adaptive Sensitivity: Speeds up during high momentum, slows down during consolidation.
🎯 More responsive than traditional EMAs or SMAs, giving early signals without excessive false alarms.
🔄 Works great as a dynamic trend filter — price staying above = uptrend, below = downtrend.
🧠 Based on price movement regularity, which helps detect clean pullbacks and trend continuations.
In Your Indicator:
TRAMA acts as the main trend line to detect:
Trend direction
Pullbacks
Reversals
Combined with MACD, RSI, and ATR, it helps determine whether a move is likely to continue or reverse.
