Z-Score Normalized by Price ChangeZscoee normalizedd to price change grgzergzerg
zer
gz
erg
e
rg
zre
tg
zergzergarg
Educational

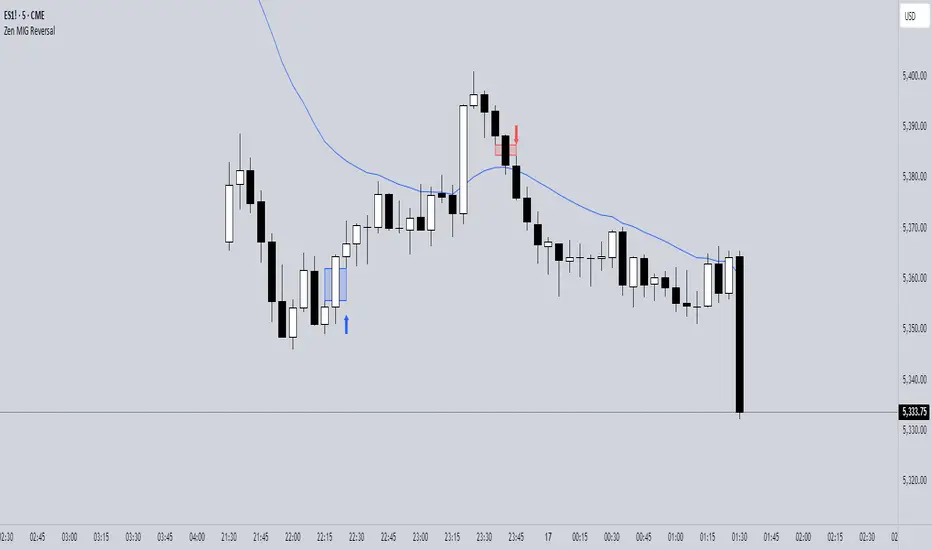
Zen MIG Reversal V1**Zen MIG Reversal V1**
Zen MIG Reversal is a pattern-based indicator that highlights rare reversal setups.
It’s designed to support traders in visually identifying potential turning points, especially following strong momentum or gap-style moves.
**How it works:**
- **Bullish Reversal:**
Detects 3 consecutive bullish candles. The third bar must have a low above the high of the first bar and below the 20 EMA. When this occurs, a light blue box is drawn across the 3-bar range, from high to the current bar’s low. A blue arrow appears below the prior bar.
- **Bearish Reversal:**
Detects 3 consecutive bearish candles. The third bar must have a high below the low of the first bar and above the 20 EMA. A light red box is drawn from low to the current bar’s high. A red arrow appears above the prior bar.
- Optional settings allow you to:
- Show or hide the EMA line
- Toggle the arrows
- Adjust smoothing settings for context
**Purpose:**
It’s best used for discretionary analysis, journaling, or studying price behavior in momentum-driven environments.
**Disclaimer:**
This script is for educational and informational purposes only. It does not provide financial advice or trade recommendations. Always backtest and use proper risk management before applying any indicator to live trading.
Smart Multi-Signal Indicator1. 200 EMA – Filters trades by trend (only buys above EMA, sells below).
2. RSI (14) – Spots overbought/oversold momentum for reversal opportunities.
3. Volume Spike – Confirms strong interest by checking if volume is 1.5× above average.
4. Impulse Candle – Looks for strong price moves (body > 1.5% of price).
When all these conditions align, it plots a BUY or SELL label directly on the chart.

Horizontal Price TableOverview:
This script displays a dynamic price table on your chart, showing real-time prices and daily percentage changes for up to 7 user-defined tickers. You can customize both which tickers are shown and how many are visible, all through the settings panel.
How it works (Step-by-Step):
User-Defined Tickers:
The script provides input fields for up to 7 tickers using input.symbol(). You can track stocks, indexes, ETFs, crypto, or futures — anything supported by TradingView.
Choose How Many to Display:
An additional dropdown lets you choose how many of the 7 tickers to actually display (between 1 and 7). This gives you control over screen space and focus.
Market Data Fetching:
For each displayed ticker, the script fetches:
The current day’s closing price (close)
The previous day’s closing price (close )
This data is pulled using request.security() on the daily timeframe (1D).
% Change Calculation:
The script calculates the daily percentage change using:
(Current Price−Previous Close)/Previous Close×100(Current Price−Previous Close)/Previous Close×100
Cleaned Ticker Names:
Ticker symbols often include an exchange prefix like NASDAQ:AAPL. The script automatically removes anything before the colon (:), so only the clean symbol (e.g., AAPL) is shown in the table.
Table Display:
A visual table appears at the top-center of your chart, showing:
Row 1: Ticker symbol (cleaned)
Row 2: Current price (rounded to 2 decimals)
Row 3: Daily % change (green for gains, red for losses)
Customization:
You can choose the background color of the table.
Ticker names appear in white text with a gray background.
% change is color-coded: green for positive, red for negative.
Why Use This Script?
Track multiple tickers at once without leaving your chart.
Clean, customizable layout.
Useful for monitoring watchlists, portfolios, or related markets.
Tips:
Combine this with your favorite indicators for a personalized dashboard.
Works great on any chart or timeframe.
Ensure the tickers entered are valid on TradingView (e.g., SPY, BTCUSD, NQ1!, etc.).

Supertrend + EMA Strategy By Arvind DodkeThis strategy is based on Supertrand and EMA. You can backtest.

NR - Price-Action Long/Short [PALS]PALS (acronym for Price Action Long Short ) is a simplified view of Price Action
that computes relative movement of OHLC values (from chart) between consecutive bars to mark probable Long/Short signals on the price chart.
Combining PALS with Heikin-Ashi charts and SuperTrend(5, 1.432) is recommended but not mandatory.
Inspiration for this script comes from Buy/Sell Indicator by Prakash EEE:
What PALS does and why?
Search for simplification of the complex ema of ema based range shrinking logic learnt from Prakash's approach led to -
- the simpler comparison of a two-bar average over previous close and current open with an average of current OHLC values (giving less weight to the opens and more weight to the rest of them).
Crossovers between those two oscillating relative values (difference between the two averages being positive or negative) is the main logic.
PALS marks places where probable long or short trades may be setting up.
How to use PALS?
During trending phases the opposing signals may be used as areas where profit booking could be done while same side signals marking the re-entry/adding to the open positions.
Pairing PALS with a SuperTrend could help in filtering out the frequent turn arounds marked by PALS during sideways phase.
Adding more confirmations could improve the probable yet relatively longer lasting short-term signals.

Nasan Market Phase ClassifierThe Nasan Market Phase Classifier indicator designed to classify market phases using volume, volatility (or momentum), and statistical analysis. Here's a summary of how it works and what it does:
🔍 Core Concept
This indicator classifies the market into four phases based on volume and ATR (or optionally momentum):
High Volume / High ATR or Momentum (HV/HATR): Strong Trend
Low Volume / High ATR or Momentum (LV/HATR): False Breakout / Exhaustion
High Volume / Low ATR or Momentum (HV/LATR): Consolidation
Low Volume / Low ATR or Momentum (LV/LATR): Stagnation
⚙️ Key Settings
Short-Term Length: Used for the active market phase.
Long-Term Length: Used as the expected/benchmark distribution.
Use Momentum: Replaces volatility (ATR) with momentum (custom ROC-based formula).
Use Fixed Alpha: Toggles adaptive vs. fixed weighting in scoring (this is based on variation of the volatility - standard deviation of true range).
📊 How It Works
Volatility or Momentum Scoring:
Uses ATR-based or Momentum-based score depending on the setting.
Applies weighing (alpha) which is based on variability of the volatility itself.
Market Phase Count:
Measures how often each of the 4 volume/volatility combinations occur in:
Short-term window (observed phase)
Long-term window (expected distribution)
Category Proportions:
Calculates percentage share of each category (e.g., % time in HV/HATR).
Plots these on chart to visually see market phase dominance (can be used for screening of pine screener).
Statistical Testing:
IQV (Index of Qualitative Variation): Measures phase diversity (0 = focused, 1 = mixed).
Chi-Squared Test: Compares current vs. historical phase distribution.
Z-Test: Tests if current phase dominance is statistically significant.
📋 Outputs
On-Chart Plots and Tabels:
Strong Trend, False Breakout/Exhaustion, Consolidation, Stagnation
Strength Quality Plot: Trend strength normalized by IQV.
Dynamic Table (Top Right):
Shows each phase’s proportion (the current phase cell is highlighted in yellow), IQV, Chi² value, and current dominant phase. The current candle classification (text) is in purple.
Highlights the dominant phase classification and color-codes significance (the cell highlighted in green highly confident about the classification, orange intermediate confidence and red low confidence). This color coding is not just based on statistical significance it is based on IQV which takes into account how spread the proportions are.
🧠 Interpretation
A dominant HV/HATR phase with low IQV and high Z-Score indicates a strong and statistically significant trend.
High IQV suggests uncertainty or mixed market behavior.
Chi² spike indicates a shift from historical behavior can be used to see is the market behavior changing by changing the long term length say to 252 and short term length to 21 this will tell if the short term behavior is different from the past 252 day behavior.

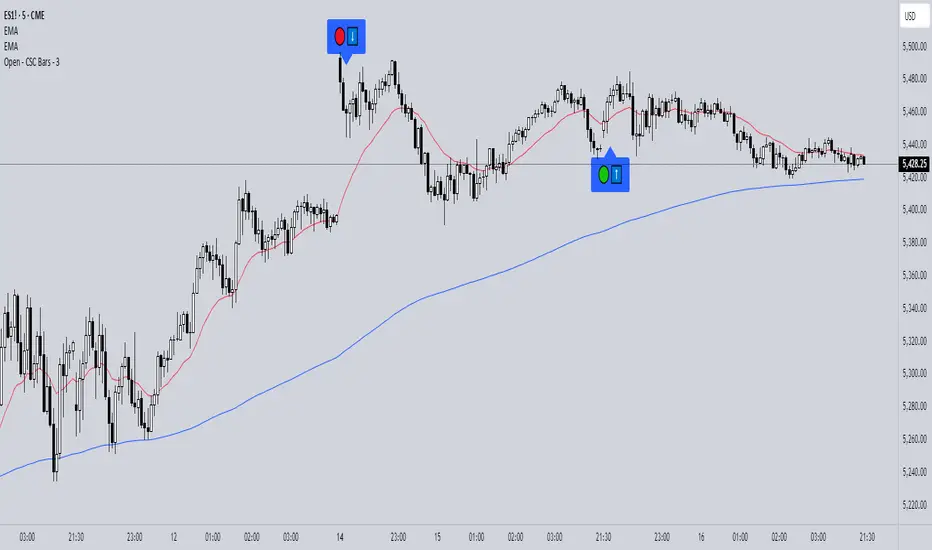
Open - CSC Bars - 33 CSC Bars – Early Session Price Action Filter
This script detects when the first three bars of the RTH (Regular Trading Hours) session all move in the same direction — either all bullish or all bearish.
It’s a tool for price action traders who want to develop structured opening strategies by observing clean directional agreement at the session start. The indicator highlights the third bar when the sequence confirms directional bias.
🔍 How It Works:
Monitors the first three bars after the RTH session begins.
If all three bars are bullish, it highlights the third bar (same for bearish sequences).
No projections, signals, or entries—purely a visual tool to observe and study opening behavior.
🎯 Use Case:
This script is designed to help traders build and test opening-based frameworks by identifying potential trend bias early in the day.
Note: This is an open-source utility script with a simple function. It does not generate signals or predictions and is intended to assist with observation and discretionary strategy building.
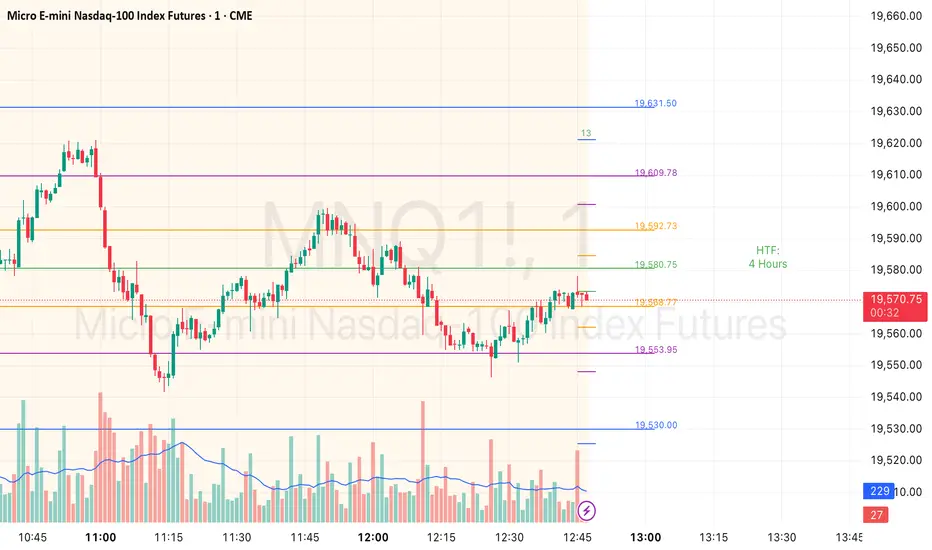
HTF Countdown by Silver Mountain Trading)Stay sharp and time your trades with precision.
This simple but effective tool shows a real-time countdown to the next Higher Time Frame (HTF) candle — such as 4H, 1H, or whatever timeframe you choose.
The countdown is always placed just below the current day’s low, with clean design and no clutter.
🔹 Displays remaining time in H:M:S
🔹 Anchored visually to current day’s LOD
🔹 Works in replay mode
🔹 Open-source and free to use
🔹 From Silver Mountain Trading
🙌 If you found this helpful, a like and subscribe to the Silver Mountain Trading YouTube channel would be much appreciated as a thank-you. www.youtube.com

Session OHLC LevelsMarks:
- NY open, AM high, AM low, PM high, PM low and close
- Asia open, high, low and close
- London open, high, low and close

20 & 50 EMA + ATR, TR & DATRIndicator Name: 20 & 50 EMA + ATR, TR & DATR
This custom indicator combines trend and volatility analysis into a single tool, helping you make smarter trading decisions with fewer indicators on your chart.
---
1. 20 & 50 Exponential Moving Averages (EMAs)
EMA 20 (Blue Line): A short-term trend indicator that reacts quickly to price changes.
EMA 50 (Orange Line): A medium-term trend indicator that smooths out more of the noise.
How to Use:
Bullish signal: EMA 20 crosses above EMA 50
Bearish signal: EMA 20 crosses below EMA 50
Use crossovers or distance between EMAs to confirm trends or potential reversals
---
2. True Range (TR)
Definition: The greatest of the following:
High - Low
High - Previous Close
Previous Close - Low
Use: Shows how much the asset moved during the candle. Useful for understanding raw price movement.
---
3. Average True Range (ATR)
Definition: The average of the True Range over a 14-bar period
Line color: Red (shown in the status line above your chart)
How to Use:
High ATR = High volatility
Low ATR = Low volatility
Use ATR to help determine stop-loss and take-profit levels, or to avoid low-volatility periods
---
4. Daily ATR (DATR)
Definition: ATR calculated from the daily timeframe, regardless of the chart's current timeframe
Line color: Green (also shown in the status line)
How to Use:
Know how much the asset typically moves in a full day
Helps intraday traders set realistic targets or detect when the market is unusually quiet or active

Prop Firm Business SimulatorThe prop firm business simulator is exactly what it sounds like. It's a plug and play tool to test out any tradingview strategy and simulate hypothetical performance on CFD Prop Firms.
Now what is a modern day CFD Prop Firm?
These companies sell simulated trading challenges for a challenge fee. If you complete the challenge you get access to simulated capital and you get a portion of the profits you make on those accounts payed out.
I've included some popular firms in the code as presets so it's easy to simulate them. Take into account that this info will likely be out of date soon as these prices and challenge conditions change.
Also, this tool will never be able to 100% simulate prop firm conditions and all their rules. All I aim to do with this tool is provide estimations.
Now why is this tool helpful?
Most traders on here want to turn their passion into their full-time career, prop firms have lately been the buzz in the trading community and market themselves as a faster way to reach that goal.
While this all sounds great on paper, it is sometimes hard to estimate how much money you will have to burn on challenge fees and set realistic monthly payout expectations for yourself and your trading. This is where this tool comes in.
I've specifically developed this for traders that want to treat prop firms as a business. And as a business you want to know your monthly costs and income depending on the trading strategy and prop firm challenge you are using.
How to use this tool
It's quite simple you remove the top part of the script and replace it with your own strategy. Make sure it's written in same version of pinescript before you do that.
//--$$$$$$$$$$$$$$$$$$$$$$$$$$$$$$$$$$$$$$$$$$$$$$$$--//--------------------------------------------------------------------------------------------------------------------------$$$$$$
//--$$$$$--Strategy-- --$$$$$$--// ******************************************************************************************************************************
//--$$$$$$$$$$$$$$$$$$$$$$$$$$$$$$$$$$$$$$$$$$$$$$$$--//--------------------------------------------------------------------------------------------------------------------------$$$$$$
length = input.int(20, minval=1, group="Keltner Channel Breakout")
mult = input(2.0, "Multiplier", group="Keltner Channel Breakout")
src = input(close, title="Source", group="Keltner Channel Breakout")
exp = input(true, "Use Exponential MA", display = display.data_window, group="Keltner Channel Breakout")
BandsStyle = input.string("Average True Range", options = , title="Bands Style", display = display.data_window, group="Keltner Channel Breakout")
atrlength = input(10, "ATR Length", display = display.data_window, group="Keltner Channel Breakout")
esma(source, length)=>
s = ta.sma(source, length)
e = ta.ema(source, length)
exp ? e : s
ma = esma(src, length)
rangema = BandsStyle == "True Range" ? ta.tr(true) : BandsStyle == "Average True Range" ? ta.atr(atrlength) : ta.rma(high - low, length)
upper = ma + rangema * mult
lower = ma - rangema * mult
//--Graphical Display--// *-*-*-*-*-*-*-*-*-*-*-*-*-*-*-*-*-*-*-*-*-*-*-*-*-*-*-*-*-*-*-*-*-*-*-*-*-*-*-*-*-*-*-*-*-*-*-*-*-*-*-*-*-*-*-*-*-*-*-*-*-*-*-*-*-*-*-*-*-*-*-*-*-$$$$$$
u = plot(upper, color=#2962FF, title="Upper", force_overlay=true)
plot(ma, color=#2962FF, title="Basis", force_overlay=true)
l = plot(lower, color=#2962FF, title="Lower", force_overlay=true)
fill(u, l, color=color.rgb(33, 150, 243, 95), title="Background")
//--Risk Management--// *-*-*-*-*-*-*-*-*-*-*-*-*-*-*-*-*-*-*-*-*-*-*-*-*-*-*-*-*-*-*-*-*-*-*-*-*-*-*-*-*-*-*-*-*-*-*-*-*-*-*-*-*-*-*-*-*-*-*-*-*-*-*-*-*-*-*-*-*-*-*-*-*-*-$$$$$$
riskPerTradePerc = input.float(1, title="Risk per trade (%)", group="Keltner Channel Breakout")
le = high>upper ? false : true
se = lowlower
strategy.entry('PivRevLE', strategy.long, comment = 'PivRevLE', stop = upper, qty=riskToLots)
if se and upper>lower
strategy.entry('PivRevSE', strategy.short, comment = 'PivRevSE', stop = lower, qty=riskToLots)
The tool will then use the strategy equity of your own strategy and use this to simulat prop firms. Since these CFD prop firms work with different phases and payouts the indicator will simulate the gains until target or max drawdown / daily drawdown limit gets reached. If it reaches target it will go to the next phase and keep on doing that until it fails a challenge.
If in one of the phases there is a reward for completing, like a payout, refund, extra it will add this to the gains.
If you fail the challenge by reaching max drawdown or daily drawdown limit it will substract the challenge fee from the gains.
These gains are then visualised in the calendar so you can get an idea of yearly / monthly gains of the backtest. Remember, it is just a backtest so no guarantees of future income.
The bottom pane (non-overlay) is visualising the performance of the backtest during the phases. This way u can check if it is realistic. For instance if it only takes 1 bar on chart to reach target you are probably risking more than the firm wants you to risk. Also, it becomes much less clear if daily drawdown got hit in those high risk strategies, the results will be less accurate.
The daily drawdown limit get's reset every time there is a new dayofweek on chart.
If you set your prop firm preset setting to "'custom" the settings below that are applied as your prop firm settings. Otherwise it will use one of the template by default it's FTMO 100K.
The strategy I'm using as an example in this script is a simple Keltner Channel breakout strategy. I'm using a 0.05% commission per trade as that is what I found most common on crypto exchanges and it's close to the commissions+spread you get on a cfd prop firm. I'm targeting a 1% risk per trade in the backtest to try and stay within prop firm boundaries of max 1% risk per trade.
Lastly, the original yearly and monthly performance table was developed by Quantnomad and I've build ontop of that code. Here's a link to the original publication:
That's everything for now, hope this indicator helps people visualise the potential of prop firms better or to understand that they are not a good fit for their current financial situation.

Bitcoin NUPL IndicatorThe Bitcoin NUPL (Net Unrealized Profit/Loss) Indicator is a powerful metric that shows the difference between Bitcoin's market cap and realized cap as a percentage of market cap. This indicator helps identify different market cycle phases, from capitulation to euphoria.
// How It Works
NUPL measures the aggregate profit or loss held by Bitcoin investors, calculated as:
```
NUPL = ((Market Cap - Realized Cap) / Market Cap) * 100
```
// Market Cycle Phases
The indicator automatically color-codes different market phases:
• **Deep Red (< 0%)**: Capitulation Phase - Most coins held at a loss, historically excellent buying opportunities
• **Orange (0-25%)**: Hope & Fear Phase - Early accumulation, price uncertainty and consolidation
• **Yellow (25-50%)**: Optimism & Anxiety Phase - Emerging bull market, increasing confidence
• **Light Green (50-75%)**: Belief & Denial Phase - Strong bull market, high conviction
• **Bright Green (> 75%)**: Euphoria & Greed Phase - Potential market top, historically good profit-taking zone
// Features
• Real-time NUPL calculation with customizable smoothing
• RSI indicator for additional momentum confirmation
• Color-coded background reflecting current market phase
• Reference lines marking key transition zones
• Detailed metrics table showing NUPL value, market sentiment, market cap, realized cap, and RSI
// Strategy Applications
• **Long-term investors**: Use extreme negative NUPL values (deep red) to identify potential bottoms for accumulation
• **Swing traders**: Look for transitions between phases for potential trend changes
• **Risk management**: Consider taking profits when entering the "Euphoria & Greed" phase (bright green)
• **Mean reversion**: Watch for overbought/oversold conditions when NUPL reaches historical extremes
// Settings
• **RSI Length**: Adjusts the period for RSI calculation
• **NUPL Smoothing Length**: Applies moving average smoothing to reduce noise
// Notes
• Premium TradingView subscription required for Glassnode and Coin Metrics data
• Best viewed on daily timeframes for macro analysis
• Historical NUPL extremes have often marked cycle bottoms and tops
• Use in conjunction with other indicators for confirmation

Rolling Beta against SPY📈 Pine Script Showcase: Rolling Beta Against SPY
Understanding how your favorite stock or ETF moves in relation to a benchmark like the S&P 500 can offer powerful insights into risk and exposure. This script calculates and visualizes the rolling beta of any asset versus the SPY ETF (which tracks the S&P 500).
🧠 What Is Beta?
Beta measures the sensitivity of an asset's returns to movements in the broader market. A beta of:
- 1.0 means the asset moves in lockstep with SPY,
- >1.0 indicates higher volatility than the market,
- <1.0 implies lower volatility or possible defensive behavior,
- <0 suggests inverse correlation (e.g., hedging instruments).
🧮 How It Works
This script computes rolling beta over a user-defined window (default = 60 periods) using classic linear regression math:
- Calculates daily returns for both the asset and SPY.
- Computes covariance between the two return streams.
- Divides by the variance of SPY returns to get beta.
⚙️ Customization
You can adjust the window size to control the smoothing:
- Shorter windows capture recent volatility changes,
- Longer windows give more stable, long-term estimates.
📊 Visual Output
The script plots the beta series dynamically, allowing you to observe how your asset’s correlation to SPY evolves over time. This is especially useful in regime-change environments or during major macroeconomic shifts.
💡 Use Cases
- Portfolio construction: Understand how your assets co-move with the market.
- Risk management: Detect when beta spikes—potentially signaling higher market sensitivity.
- Market timing: Use beta shifts to infer changing investor sentiment or market structure.
📌 Pro Tip: Combine this rolling beta with volatility, Sharpe ratio, or correlation tracking for a more robust factor-based analysis.
Ready to add a layer of quantitative insight to your chart? Add the script to your watchlist and start analyzing your favorite tickers against SPY today!

HTF FibonacciThis indicator displays Fibonacci lines for the selected previous HTF candle.
You can set its Fibs levels and colors.
HTF options: 15 minutes, 30 minutes, 1 hour, 2 hours, 4 hours and 1 day
ADX with Shaded ZoneThe ADX with Shaded Zone indicator is a momentum-based tool that visualizes trend strength using the Average Directional Index (ADX) along with the +DI and -DI lines. This indicator enhances the traditional ADX setup by adding a shaded zone between ADX levels 20 and 25, helping traders easily identify the transition area between non-trending and trending market conditions.
It plots:
+DI (Green): Positive Directional Indicator
−DI (Red): Negative Directional Indicator
ADX (Blue): Measures the strength of the trend
Shaded Zone: Highlights the indecisive range where ADX is below 25 (gray background between levels 20 and 25)
⚙️ How to Use:
✅ Trend Identification:
ADX < 20: Weak or no trend. Avoid trend-following strategies.
ADX 20–25 (Shaded Zone): Transition zone. Potential trend forming — stay cautious.
ADX > 25: Stronger trend. Favor trend-following strategies.
✅ Direction Confirmation:
If +DI > -DI and ADX > 25 → Uptrend confirmation.
If -DI > +DI and ADX > 25 → Downtrend confirmation.
Crossovers between +DI and -DI can be used as early signals.
✅ Shaded Zone Use:
The gray shaded area helps visually filter out low-trend strength conditions.
Useful for trend traders to wait before entering until ADX breaks above 25.

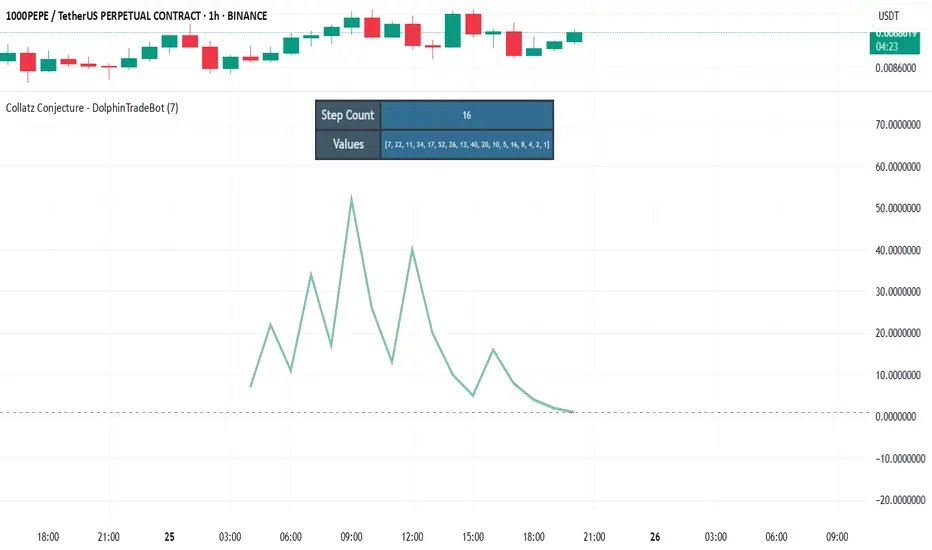
Collatz Conjecture - DolphinTradeBot1️⃣ Overview
Every positive number follows its own unique path to reach 1 according to the Collatz rule.
Some numbers reach the end quickly and directly.
Others rise significantly before crashing down sharply.
Some get stuck within a certain range for a while before finally reaching 1.
Each number follows a different pattern — the number of steps it takes, how high it climbs, or which values it passes through cannot be predicted in advance.
This is a structure that appears chaotic but ultimately leads to order:
Every number reaches 1, but the way it gets there is entirely uncertain.
2️⃣ How Is It Work?
The rule is simple:
▪️ If the number is even → divide it by two.
▪️ If it’s odd → multiply it by three and add one.
Repeat this process at each step.
Example :
Let’s say the starting number is 7:
7 → 22 → 11 → 34 → 17 → 52 → 26 → 13 → 40 → 20 → 10 → 5 → 16 → 8 → 4 → 2 → 1
It reaches 1 in 17 steps.
And from there, it always enters the same cycle:
4 → 2 → 1 → 4 → 2 → 1...
3️⃣ Why Is It Worth Learning?
🎯 This indicator isn’t just mathematical fun—it’s a thought experiment for those who dare to question market behavior.
▪️ It’s fun.
Watching numbers behave in unpredictable ways from a simple rule set is surprisingly enjoyable.
▪️ It shows how hard it is to teach a computer what randomness really is .
The Collatz process can be used to simulate chaotic behavior and may even inspire creative ways to introduce complexity into your code.
▪️ It makes you think — especially in financial markets.
The patternless, yet rule-based structure of Collatz can help train your mind to recognize that not all unpredictability is random. It’s a great mental model for navigating complex systems like price action.
▪️ Just like price movements in financial markets, this ancient problem remains unsolved.
Despite its simplicity, the Collatz conjecture has resisted proof for decades — a reminder that even the most basic-looking systems can hide deep complexity.
4️⃣ How To Use?
Super easy — in the indicator’s settings, there’s just one input field.
Enter any positive number, and you’ll see the pattern it follows on its way to 1.
You can also observe how many steps it takes and which values it visits in the info box at the top center of the chart.
5️⃣ Some Examples
You Can Observe the Chaos in the Following Examples⤵️
For Input Number → 12
For Input Number → 13
For Input Number → 14
For Input Number → 32768
For Input Number → 47
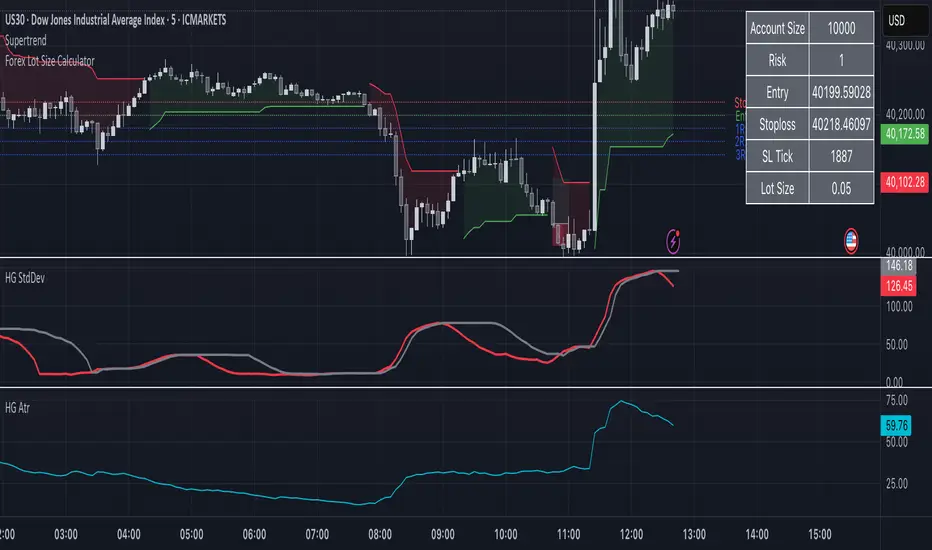
HG StdDevThe HG StdDev indicator provides a dynamic view of market volatility by calculating the standard deviation of a selected price source over a customizable period. Additionally, it plots a threshold line representing the highest standard deviation over a secondary lookback window.
Red Line: Current standard deviation (volatility) of the price.
Gray Line: Highest standard deviation value within the lookback range, serving as a reference for recent peak volatility.
Use this tool to identify periods of increasing or extreme volatility, potential breakout zones, or to filter signals based on volatility thresholds.
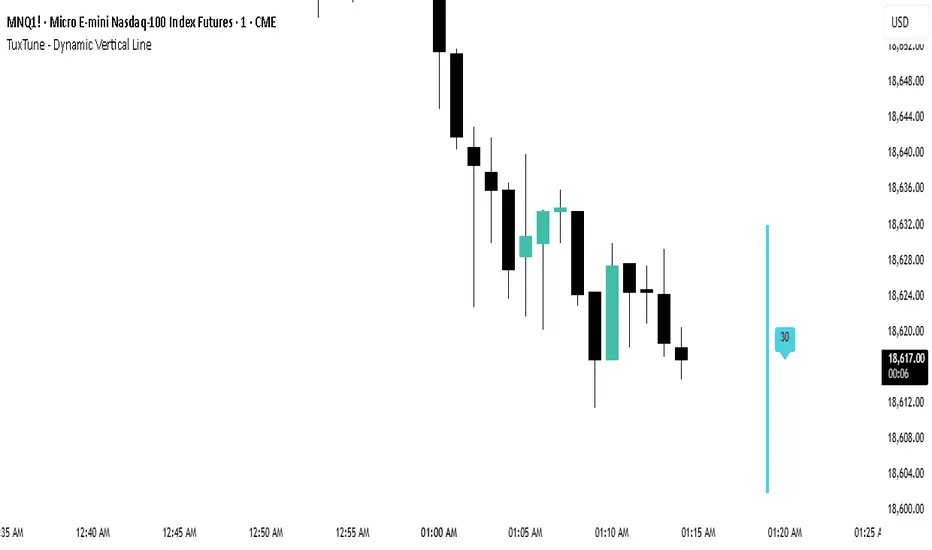
TuxTune - Dynamic Vertical LineVisual aid. The vertical line moves dynamically with the last candle of the selected time frame.
The middle of the line moves with the latest price.
The line range (height) can be set to any value to aid in quickly gauging the size of the candles without having to keep looking at the numbers on the vertical axis to determine how big the candles are.
Line width, color, and distance from the last candle can also be set.
The label can be turned off/on.
FeraTrading Multi-Timeframe FVG w/ Volume FilteringWelcome to the FeraTrading Multi-Timeframe FVG w/ Volume Filtering Indicator.
This Fair Value Gap (FVG) indicator identifies bullish and bearish FVGs across up to 5 customizable timeframes—from intraday scalps to higher-timeframe confluences.
🔹 Volume-Filtered FVGs: Optionally filter for high-volume zones only, focusing on strong institutional interest.
🔹 Bullish & Bearish Toggles: Choose which setups you want to see.
🔹 Dynamic Gap Lengths: Gap size automatically scales with volume intensity using a smart multiplier.
🔹 Multi-Timeframe Support: Pulls FVGs from higher timeframes without cluttering your chart.
🔹 Color-Coded Zones: Easily distinguish between bullish and bearish areas with custom transparency.
Great for scalpers, day traders, and swing traders looking for precise entry zones backed by volume and structure.
We made this indicator open-source on purpose: So you can tweak it, improve it, or build on it. Whether you’re a developer or a trader with some coding skills, we want you to make it your own and help the tool evolve with the community. Mess with the volume logic or how the FVGs interact with candles, it is all setup for you to do so. If you are not a coder, enjoy using a great indicator!
This indicator was developed by FeraTrading to visualize market structure.

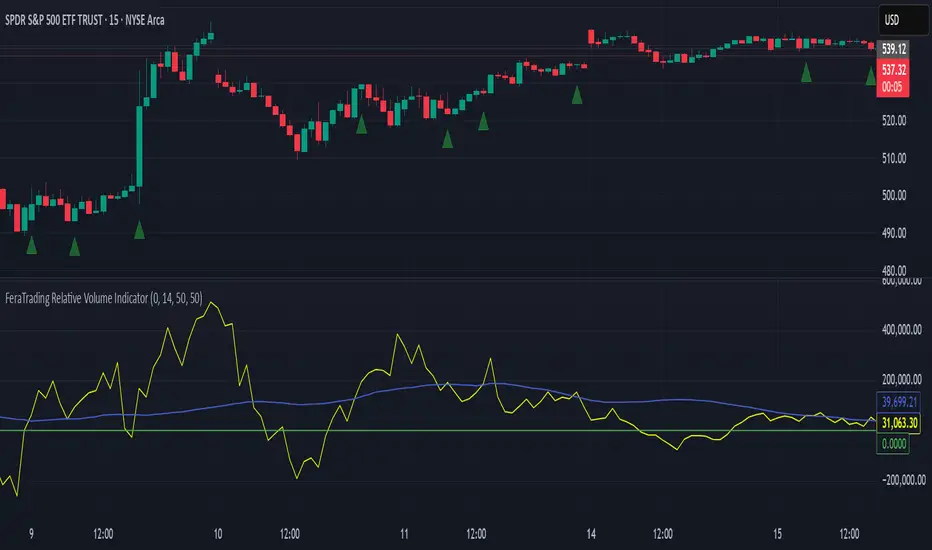
FeraTrading Relative Volume IndicatorThis FeraTrading Relative Volume Indicator measures relative volume pressure by comparing buying and selling activity, smoothed using a configurable average. It helps traders identify volume-driven momentum shifts, offering dynamic buy and sell signals based on weighted pressure values.
Key Features:
📈 Relative Volume (RV) Line: Measures net buying/selling pressure using volume-weighted price action.
🟢 Buy Signals: Triggered when RV crosses above a smoothed moving average (SMA 1).
🔴 Sell Signals (optional): Triggered when RV crosses below a separate SMA (SMA 2).
🔍 Customizable Inputs: Adjust smoothing length, weight, and signal sensitivity.
🕯️ Weighted Candles (optional): Visualizes custom OHLC based on volume-weighted volatility.
📊 Two SMAs: Use separate or combined moving averages to analyze trends in pressure.
🎨 Flexible Styling: Customize line and signal colors to match your chart setup.
Use Cases:
Spotting accumulation/distribution phases
Timing entries during volume surges
Confirming breakout momentum with underlying volume pressure
This indicator was developed by FeraTrading to visualize relative volume pressure.
Quantum Flow Navigator @DaviddTechQuantum Flow Navigator – DaviddTech
Precision Strategy Builder Powered by Adaptive Filters, Statistical Noise Reduction & Multi-Modal Confirmation
🚀 Bullish Signal : Enter when ALMA, FluxWave, and QuickSilver all confirm bullish trend, with high volume and valid noise filter state.
🔻 Bearish Signal : Enter short when all components align bearishly and filters validate the signal.
🚪 Exit : Automatically managed by dynamic SL/TP or indicator-based reversal logic.
✅ Overview & DaviddTech Methodology
Quantum Flow Navigator is an advanced, multi-component trading system engineered around the strict modular logic of the DaviddTech methodology .
It integrates every core component required for a fully rule-based and signal-driven strategy—baseline, confirmations, volume filter, exit system, and noise filter.
Designed for traders who demand structure, clarity, and data-backed decision-making on 15M, 1H, and 4H charts.
🔍 Indicator Components
Baseline: Adaptive ALMA Filter
Smooth and responsive dynamic trend detection, with momentum validation and optional filled zones for enhanced visual feedback.
Confirmation #1: FluxWave Oscillator
Developed from an enhanced Trendlio concept by @dudeowns , FluxWave uses ALMA-smoothed rate-of-change logic with configurable signal behavior.
Confirmation #2: QuickSilver Band System
Custom breakout engine that maps volatility envelopes using multi-layered deviation bands for clear confirmation of structure breaks and trend direction.
Volume Filter: Normalized Volume Energy
Innovative volume filter inspired by @ceyhun 's work. Filters trades by classifying energy into High, Normal, or Low based on normalized volume context.
Exit System: Dynamic Momentum Stop Loss
Choose from Smart Adaptive, Trailing, Stepped, Percentage, ATR, or Volatility-adjusted logic. Supports TP via risk/reward, ATR multiples, or percentage targets.
Noise Filtration: Quantum Statistical Noise Reduction
Fuses Kalman smoothing with wavelet decomposition to eliminate non-signal noise and improve trade quality and confidence.
🎨 Visual System & Dashboard
🚀/🔻/🚪 Emoji Labels : Buy, sell, and exit trades clearly marked for instant recognition.
Color-Shifting Bars : Reflect FluxWave’s trend bias in real-time.
ALMA Fill Zone : Visual trend envelope between price and ALMA baseline.
QuickSilver Bands : Volatility envelopes with graduated depth for support/resistance awareness.
SL & TP Visuals : Dynamic stop-loss and take-profit zones plotted directly on chart.
Navigator Panel : In-chart dashboard displays real-time trend status, volume energy, noise filter state, signal strength, and active position tracking.
📈 How to Trade with It
Entry Mode Selection : Choose between Combined, ALMA, FluxWave, QuickSilver, or Custom scoring logic.
Final Signals : Trigger only when confirmations align, volume energy is valid, and noise is low.
Dashboard Summary : Use real-time signal display to validate entry strength.
Timeframes : 15M–1H recommended for swing/intraday setups; 5M–15M for automation.
💡 Advanced Features
Entry Strength Scoring: Composite weight of all active components + filters.
Cooldown System: Limits excessive signals in volatile periods.
Multiple Exit Strategies: SL & TP modes with optional indicator-based exits.
Statistical Filtering: Wavelet + Kalman combination optimizes entry confidence.
Full Alert Suite: Covers entries, exits, filter triggers, volume states, and more.
🧠 Suggested Strategy Usage
Wait for full confirmation from ALMA, FluxWave, and QuickSilver.
Ensure volume energy is High and noise filter confirms trend clarity.
Use adaptive SL/TP or indicator-based exits.
Monitor dashboard for live signal strength ≥ threshold.
Use “Balanced” mode for general use; switch to “Aggressive” for tighter signals.
📝 Credits & Originality
Concept based on DaviddTech’s component-driven methodology .
FluxWave Oscillator built as an evolved version of Trendlio with full signal customization — credit @dudeowns .
Volume Energy Filter adapted from the work of @ceyhun .
Noise filtration and system architecture developed independently using Pine Script v6.
All code and logic is original, non-rehashed, and completely refactored to ensure uniqueness.
Quantum Flow Navigator fuses adaptive baselines, confirmation logic, energy-based filters, and statistical refinement into a precision signal engine—optimized for traders who value structure, clarity, and control.

Buffett Indicator (Wilshire 5000 / GDP)The Buffett Indicator (Wilshire 5000 / GDP) is a macroeconomic metric used to assess whether the U.S. stock market is overvalued or undervalued. It is calculated by dividing the total market capitalization (represented by the Wilshire 5000 Index) by the U.S. Gross Domestic Product (GDP). A value above 1 (or 100%) may indicate an overvalued market, while a value below 1 suggests potential undervaluation. This indicator is best suited for long-term investment analysis.
