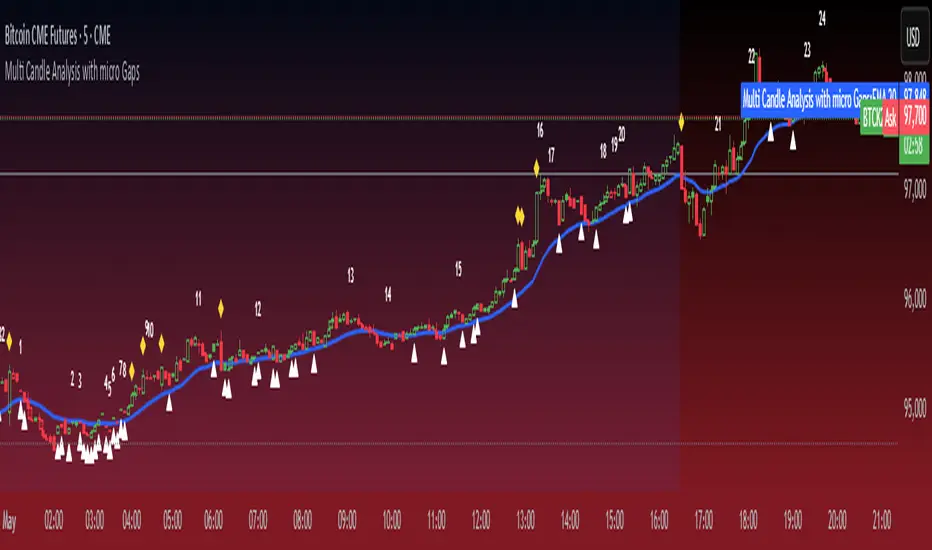
Micro Gaps DetectorSimple Micro Gap Indicator: A Technical Analysis Tool
The Simple Micro Gap Indicator is a specialized momentum indicator designed to identify and analyze micro gaps between consecutive candlesticks in financial charts. Unlike traditional gap analysis that focuses on larger price gaps, this indicator specifically targets smaller, less noticeable spaces between candles.
Key Features:
Detects minimal price disparities between consecutive candlesticks
Helps identify potential short-term momentum shifts
Useful for high-frequency trading and scalping strategies
Functions as a momentum indicator for short-term price movements
Educational
Wyckoff Accumulation Distribution Wyckoff Accumulation & Distribution Indicator (RSI-Based)
This Pine Script is a technical analysis indicator built around the Wyckoff Method, designed to detect accumulation and distribution phases using RSI (Relative Strength Index) and pivot points. It automatically marks key structural turning points on the chart and highlights relevant zones with colored boxes.
What Does It Do?
Draws accumulation and distribution boxes based on RSI behavior.
Automatically detects Wyckoff structural signals:
SC (Selling Climax)
AR (Automatic Rally)
ST (Secondary Test)
BC (Buying Climax)
DAR (Automatic Reaction)
DST (Secondary Test - Distribution)
Identifies trend transitions by detecting sideways RSI movement.
Attempts to detect spring and UTAD-like deviations based on RSI reversals.
Uses RSI extremes in conjunction with pivot points to generate Wyckoff signals.
How Does It Work?
RSI Zone: It identifies sideways markets when RSI stays within ±20 of the 50 level (this range is configurable).
Pivot Points: It detects pivot highs/lows that sync with RSI values (pivotLen is adjustable).
Trend Box Drawing:
When RSI exits the sideways zone, the script draws a gray box between the highest high and lowest low within that range.
If RSI breaks upward, the box becomes green (Accumulation); if downward, it becomes red (Distribution).
Wyckoff Structural Points:
SC/BC: Detected when a pivot occurs with RSI below/above a threshold.
AR/DAR: The next opposite pivot after SC or BC.
ST/DST: The next same-direction pivot after AR or DAR.
How to Use It
Works best on 4H or daily charts for more reliable signals. Shorter timeframes may generate noise.
Primarily used for interpreting RSI structures through the lens of Wyckoff methodology.
Box colors help quickly identify market phase:
Green box: Likely Accumulation
Red box: Likely Distribution
Triangular markers show key signals:
SC, AR, ST: Accumulation points
BC, DAR, DST: Distribution points
Use these signals alongside price action to manually interpret Wyckoff phases.
image.binance.vision
image.binance.vision
What Is the Wyckoff Method?
The Wyckoff Method, developed in the 1930s by Richard Wyckoff, is a market analysis approach that focuses on supply and demand dynamics behind price movements.
Wyckoff’s 5 Phases:
Accumulation: Smart money gradually buying at low prices.
Markup: Price begins trending upwards.
Distribution: Smart money selling to retail traders.
Markdown: Downtrend begins as supply outweighs demand.
Re-accumulation / Re-distribution: Trend-continuation phases with consolidations.
This indicator is specifically designed to detect phase 1 (Accumulation) and phase 3 (Distribution).
Extra Notes
Repainting is minimal, as pivots are confirmed using historical candles.
Labels use plotshape for a clean, minimalist visual style.
Other Wyckoff events (like SOS, LPS, UT, UTAD) could be added in future updates.
This script does not generate buy/sell signals; it is meant for structural interpretation.

MM Day Trader Levels Signal IndicatorVisual elements (CALL/PUT labels and markers) are now prioritized at the top of the chart for improved readability and immediate trade signal clarity.

COTE 1composite scan of bist stocks
You can set the condition in the screening code as you wish according to the data defined in the code.

DOC & DOS 30m RangesDailyOpenCrypto & DailyOpenStocks 30m Ranges once you confirm closes outside or range a daily bias is determined

DOC & DOS 30m Rangesthe lines on the screen indicate the 30 min rande on the daily opens for stocks and crypto

Daily Alert at Specific TimeThis script will just trigger an alert at the end of the market session at 3:55 PM EST. If we need to flattened all existing open positions at the end of the day, we can use this alert.

Global Liquidity Index with Dynamic TimeframeThis is the M2 Global Money supply indicator with added functionality of moving the graph sideways (increment of days) in order to find a potential price correlation with any chart


BTC / USEU (FX-Adjusted)first version btc/k adjustable
filters out usd movments to see raw btc changes


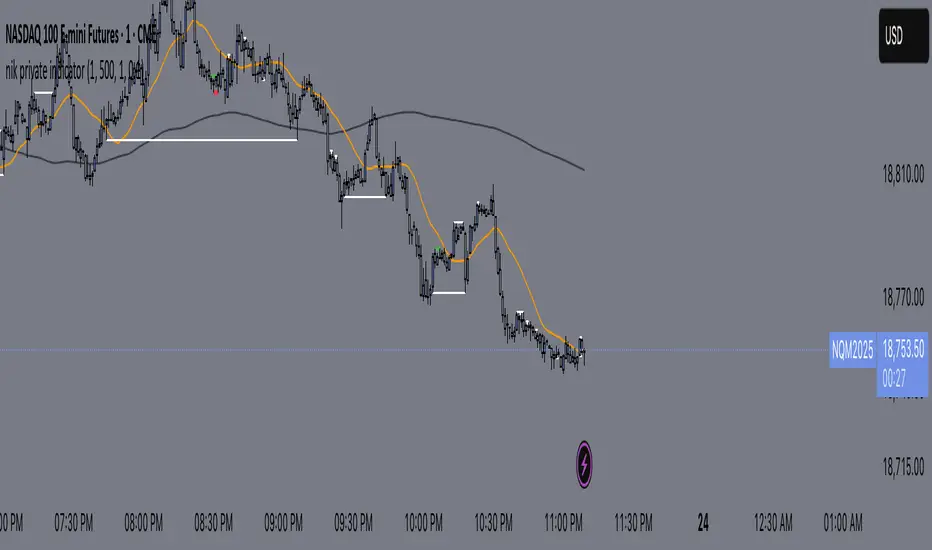
nik private indicatorlol eqx go brrr, this indicator helps mark out equal highs and lows, while alerting you, allowing for you to trade without watching the charts all session.
Gold ORB Strategy (15-min Range, 5-min Entry)The Gold ORB (Opening Range Breakout) Strategy is designed for day traders looking to capitalize on the price action in the early part of the trading day, specifically using a 15-minute range for identifying the opening range and a 5-minute timeframe for breakout entries. The strategy trades the Gold market (XAU/USD) during the New York session.
Opening Range: The strategy defines the Opening Range (ORB) between 9:30 AM EST and 9:45 AM EST using the highest and lowest points during this 15-minute window.
Breakout Entries: The strategy enters trades when the price breaks above the ORB high for a long position or below the ORB low for a short position. It waits for a 5-minute candle close outside the range before entering a trade.
Stop Loss and Take Profit: The stop loss is placed at 50% of the ORB range, and the take profit is set at twice the ORB range (1:2 risk-reward ratio).
Time Window: The strategy only executes trades before 12:00 PM EST, avoiding late-day market fluctuations and consolidations.
Niveles decimalesCREATOR: SANTIAGO CANO
this indicator marks decimals in 10s on a graph for easier reading in assets such as indices or raw materials

EMA TrendEMA Trend is a simple yet effective technical analysis tool that plots three Exponential Moving Averages (EMAs) — Fast, Medium, and Slow — on the price chart to help identify trend direction and strength.
The Fast EMA (default: 10) and Medium EMA (default: 30) are used together to define short- to medium-term trend shifts. When the Fast EMA crosses above the Medium EMA, the indicator fills the area between them with a green color to highlight bullish momentum. Conversely, when the Fast EMA falls below the Medium EMA, the fill turns orange to indicate bearish pressure. The color fill provides a quick visual cue for potential trend changes or continuation.
The Slow EMA (default: 100) serves as a longer-term trend baseline, helping traders align their strategy with the broader market direction.

Aetherius Trend"Support indicator for trend-following with 6 configurable moving averages and a Hilo Activator for potential entry and exit points."

Ultimate Scalping DashboardIncluded Tools (Combo Strategy):
EMA 9 / 21 / 50 – for trend direction and momentum
VWAP – for intraday bias
Stochastic RSI – for overbought/oversold + reversals
Volume Spike Detector – for entry confirmation
SuperTrend – to simplify entry/exit decisions
You’ll see:
EMAs for trend
VWAP to confirm bias
SuperTrend trail
Buy/Sell signals based on momentum + volume + trend alignment

Bollinger Band Expansion with EMAsCall Entry above Purple Candle's High, Stop loss previous candle low.
Sell Entry Below Grey Candle's Low, Stop loss previous candle High.

ryantrad3s session highs and lowsbecome profitable with this.
pwease subscribe to my youtube aswell: ryantrad3s

Market Open & Pre-Open Linesversion 1.0 2025-04-23
Stated vertical line for market open and pre-market open. Market option include US, EU, UK, JP and AU. This line do auto-defined during daylight saving time. This help for those trade during market open and benefit for those doing backtest on it.

WVF Spike + DMI Alternating Alerts (Auto 1m & 5m) w/ Mimi LabelsMimi Trend Signal
Buy/Sell alerts based on WVF spike + DMI crossover for 1m/5m charts

BRKT SMART - VWAPVolumeCVDOI (Agg BINANCE OKX)This script is a powerful breakout detection tool designed to capture real market intent by combining VWAP structure, volume surges, and derivatives market data from multiple top-tier exchanges (BINANCE + OKX).
It identifies:
✅ True breakouts with confirmation from volume, Open Interest delta (OIΔ), and directional aggression (CVD)
⚠️ Fake breakouts (traps) where the market lacks new commitment (negative OIΔ and counter-pressure)
🔁 Retests after breakout to help time re-entries or add-ons
🔍 Key Features:
🧠 Aggregated OI & Volume from BINANCE and OKX for a more accurate picture of institutional activity
⚙️ Fully customizable thresholds for volume, OIΔ, and CVD delta
🎯 Optional cooldown between signals to avoid noise
📉 Visual markers for:
Breakouts (BRK↑ / BRK↓)
Traps (FAL↑ / FAL↓)
Retests (Ret↑ / Ret↓)
🟦 VWAP as central structure reference
🔧 Parameters You Can Adjust:
Volume strength (x times the average)
Minimum/maximum thresholds for OIΔ and CVD
Cooldown time between signals
Pullback detection window

