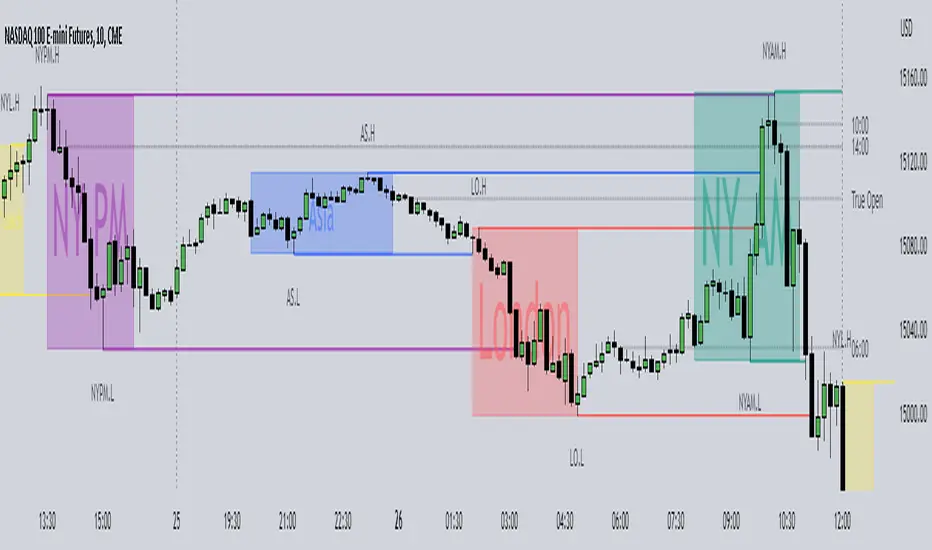
Market Sessions and TPO (+Forecast)This indicator "Market Sessions and TPO (+Forecast)" shows various market sessions alongside a TPO profile (presented as the traditional lettering system or as bars) and price forecast for the duration of the session.
Additionally, numerous statistics for the session are shown.
Features
Session open and close times presented in boxes
Session pre market and post market shown
TPO profile generated for each session (normal market hours only)
A forecast for the remained of the session is projected forward
Forecast can be augmented by ATR
Naked POCs remain on the chart until violated
Volume delta for the session shown
OI Change for the session shown (Binance sourced)
Total volume for the session shown
Price range for the session shown
The image above shows processes of the indicator.
Volume delta, OI change, total volume and session range are calculated and presented for each session.
Additionally, a TPO profile for the most recent session is shown, and a forecast for the remainder of the active session is shown.
The image above shows an alternative display method for the session forecast and TPO profile!
Additionally, the pre-market and post-market times are denoted by dashed boxes.
The image above exemplifies additional capabilities.
That's all for now; further updates to come and thank you for checking this out!
And a special thank you to @TradingView of course, for making all of this possible!
Индикаторы и стратегии

imlibLibrary "imlib"
Description
The library allows you to display images in your scripts utilising the objects. You can change the image size and screen aspect ratio (the ratio of width to height which you can change if the image is too wide / tall). The library has "example()" function which you can use to see how it works. It also has a handy "logo()" function which you can use to quickly display an image by passing the "Image data string", table position, image size and aspect ratio. And of course you can use it in your own custom way by taking the "logo()" function as an example and modifying the code to your needs.
Since tables in Pinescript are limited to 100 by 100 cells, the limit for image's size is also 100x100 px. All the necessary data to display an image is passed as a string variable, and since Pinescript has a limit of 4096 characters for variables of type, that string can have a maximum length of 4096 characters, which is enough to display a 64x64px image (but can be enough to display a 100x100 image, depending on the image itself).
Below you can find the definitions of functions for this library.
_decompress(data)
: Decompresses string with data image
Parameters:
data (string)
Returns: : Array of with decompressed data
load(data)
: Splits the string with image data into components and builds an object
Parameters:
data (string)
Returns: : An object
show(imgdata, table_id, image_size, screen_ratio)
: Displays an image in a table
Parameters:
imgdata (ImgData)
table_id (table)
image_size (float)
screen_ratio (string)
Returns: : nothing
example()
: Use it as an example of how this library works and how to use it in your own scripts
Returns: : nothing
logo(imgdata, position, image_size, screen_ratio)
: Displays logo using image data string
Parameters:
imgdata (string)
position (string)
image_size (float)
screen_ratio (string)
Returns: : nothing
ImgData
Fields:
w (series__integer)
h (series__integer)
s (series__string)
pal (series__string)
data (array__string)
Volume Delta Compare [Ticks ~ LTF data]
The "Volume Delta Compare " publication shows 2 different techniques to show into-depth details of Volume, using Tick and Lower-Time-Frame (LTF) data.
🔶 USAGE
Check for divergences between price and volume movement
Check details (why and when a ΔV developed)
Or if you want to see a lot of data stacked on each other )
🔶 CONCEPTS
🔹 Tick vs. LTF data
a Tick is an measure of (upward or downward) movement in price OR volume.
We can use this data by using varip in the code.
Advantage:
• Detail, detail, detail
• Accurate, per tick
Disadvantage:
• Only realtime
• Can reset 'easily' -> loss of data
• Will reset when settings are changed
LTF data, through the request.security_lower_tf() function, measures the OHLCV data per LTF bar
Advantage:
• Access to history when loading a chart
• No 'loss' of data when chart resets
Disadvantage:
• Less detailed
• Less accurate
This script makes it possible to compare the 2 techniques and enables you to show different values.
🔹 Values
There are mainly 3 important values:
• UP volume (uV): volume when price rises
• DOWN volume (dV): volume when price falls
• NEUTRAL volume (nV): volume when price stays the same
From this, additional data is calculated:
• Volume Delta (ΔV): uV minus dV
• Cumulative Delta Volume (cΔV): sum of ΔV
One typical nV is at open: at that moment there isn't a base price to compare with,
so when the first trade doesn't fully fill the first supply (up or down), volume will rise, but price just is 'open', no movement -> no uV or dV.
• Tick data: every volume changement per tick will be added to the concerning variable (uV, dV or nV)
• LTF data: every volume changement of each bar will be added to the concerning variable (uV, dV or nV)
-> this can easily give a difference, for example (Tick vs. 1 minute LTF), when most of the ticks caused a rise of price, but at the last few seconds, a few ticks causes the close to come below open, with Tick data this could give more UP Volume, while LTF data will show 1 value of DOWN Volume.
🔶 EXAMPLES
🔹 Details
In these examples you can see:
• grey line: Total volume (higher precision)
• UP/DOWN/NEUTRAL Volume
• green columns: uV
• orange columns: dV
• blue pillars: nV
• coloured stepline: reflects ΔV
• close > open and positive ΔV -> green
• close > open but negative ΔV -> fuchsia
• close < open and negative ΔV -> orange
• close < open but positive ΔV -> bright lime green
• Right side -> indication of used data (Tick/LTF data) + last ΔV
• labels (can be disabled)
Above 0 (only with Tick data): data from EVERY tick (ΔV ):
• first the amount of Volume (0 when the amount is very minimal)
• between brackets: price movement
Below 0:
• Σ V: sum of uV, dV and nV, for that bar
• Σ up: sum of uV for that bar
• Σ dn: sum of dV for that bar
• Σ nt: sum of nV for that bar
• Σ P: sum of price movement, for that bar (only at Tick data)
(At the right you'll see a new bar just started)
Here is a detail of the first second at opening:
🔹 Cumulative Volume Delta (CVD)
Difference CVD based on Tick vs. LTF data :
(horizontal lines added for reference)
🔶 FEATURES
🔹 Minimal plotting of na values
Data window and status line only show what is applicable (tick or LTF data) to diminish clutter of data values:
The Tick option has a label above 0 which includes details of every Tick.
If data is added every tick, that label on a 10 minute chart will be filled beyond limitations pretty quickly (string max_length = 4096 limit).
To prevent the script stopping to execute, at a certain limit, this label will stop updating and show the message "Too much data".
The label below the 0-line won't reach that limit, so it will keep on updating.
Timeframes closer to 1 second will have less risk to reach that 4096 limit. Details will remain to show in this case.
🔹 Automatic label colour adaption when changing between dark/light mode values
Label background/text-colour will adapt according to the dark/light-mode by using chart.fg_color / chart.bg_color
🔶 SETTINGS
🔹 Data from: Ticks vs. LTF data
🔹 LTF: Lower Time-Frame for when LTF option is chosen: 1, 5, 10, 15, 30 Seconds or 1 minute
🔹 Also start when bar already has data: only for tick data -> when disabled calculations only start on a new bar.
🔹 CVD, Only show Cumulative Delta Volume: enable to just display CVD
🔹 Colours: colour at the right is for price/volume direction divergences
🔹 Label: choose what you want to display + size labels
🔹 0-line: The label under the 0-line sometimes goes below the chart. this can be adjusted with this setting.

TradingToolsLibraryLibrary "TradingToolsLibrary"
Easily create advanced entries, exits, filters and qualifiers to simulate strategies. Supports DCA (Dollar Cost Averaging) Lines, Stop Losses, Take Profits (with trailing or without) & ATR.
method deepCopy(this)
This creates a deep copy instead of a shallow copy of an entry_position. This does NOT deep copy the self_pyramiding_positions array reference, since only the master entry_position needs this to track the rest of its copies for efficiency reasons. This is to prevent a feedback loop.
Namespace types: entry_position
Parameters:
this (entry_position)
Returns: entry_position
method precision_fix(this, precision)
Convert a floating point number to a precise floating point number with digit precision to avoid floating point errors in quantity calculations.
Namespace types: series float, simple float, input float, const float
Parameters:
this (float)
precision (int)
Returns: float
xSellBuyMidInterpolation(_x, _high, _low, _sellRange, _buyRange)
Creates an interpolation for a sell range and buy range but with an emphasis on reaching the _low the closer to the middle of the _sell and _buy range you go.
Parameters:
_x (float) : is the value you want to use to control interpolation bewteen the _high and _low value. This will return the lowest percentage at the mid between high and low and highest percentage at the _high and _low.
_high (float)
_low (float)
_sellRange (float)
_buyRange (float)
Returns: an interpolated float between the _high and _low supplied.
xSellBuyInterpolation(_x, _high, _low, _sellRange, _buyRange)
Creates an interpolation a sell range and buy range
Parameters:
_x (float) : is the value you want to use to control interpolation bewteen the _high and _low value.
_high (float)
_low (float)
_sellRange (float)
_buyRange (float)
Returns: an interpolated float between the _high and _low supplied.
activate_entries_and_exits(_entries, _exits, _filters, _qualifiers, _equity)
Determines activation for entries or exits. Does not place the actual orders.
Parameters:
_entries (entry_position )
_exits (exit_position )
_filters (filter )
_qualifiers (qualifier )
_equity (equity_management)
Returns: void
create_entries_and_exits(_entries, _exits, _equity)
Creates actual entry and exit orders if activated
Parameters:
_entries (entry_position )
_exits (exit_position )
_equity (equity_management)
Returns: void
filter
Fields:
disabled (series__bool)
filter_for_entries_or_exits (series__string)
filter_for_groups (series__string)
condition (series__bool)
dynamic_condition (series__bool)
use_dynamic_condition (series__bool)
use_override_default_condition (series__bool)
dynamic_condition_operator (series__string)
dynamic_condition_source (series__float)
dynamic_compare_source (series__float)
dynamic_condition_source_prior (series__float)
dynamic_compare_source_prior (series__float)
use_dynamic_compare_source (series__bool)
dynamic_condition_activate_value (series__string)
expire_condition_activate_value (series__string)
expire_condition_source (series__float)
expire_condition_source_prior (series__float)
expire_compare_source (series__float)
expire_compare_source_prior (series__float)
use_expire_compare_source (series__bool)
expire_condition_operator (series__string)
qualifier
Fields:
disabled (series__bool)
qualify_for_entries_or_exits (series__string)
qualify_for_groups (series__string)
disqualify (series__bool)
condition (series__bool)
dynamic_condition (series__bool)
use_dynamic_condition (series__bool)
use_override_default_condition (series__bool)
dynamic_condition_operator (series__string)
dynamic_condition_source (series__float)
dynamic_compare_source (series__float)
dynamic_condition_source_prior (series__float)
dynamic_compare_source_prior (series__float)
use_dynamic_compare_source (series__bool)
dynamic_condition_activate_value (series__string)
expire_after_x_bars (series__integer)
use_expire_after_x_bars (series__bool)
use_expire_condition (series__bool)
use_override_expire_condition (series__bool)
expire_condition_operator (series__string)
expire_condition_source (series__float)
expire_compare_source (series__float)
expire_condition_source_prior (series__float)
expire_compare_source_prior (series__float)
use_expire_compare_source (series__bool)
expire_condition_activate_value (series__string)
active (series__bool)
expire_after_bars_bar_index (series__integer)
expire_after_bars_bar_index_prior (series__integer)
expire_bar_count (series__integer)
expire_bar_changed (series__bool)
entry_position
Fields:
disabled (series__bool)
activate (series__bool)
active (series__bool)
override_occured (series__bool)
passDebug (array__bool)
initial_activation_price (series__float)
dca_done (series__bool)
condition (series__bool)
dynamic_condition (series__bool)
use_dynamic_condition (series__bool)
use_override_default_condition (series__bool)
dynamic_condition_operator (series__string)
dynamic_condition_source (series__float)
dynamic_compare_source (series__float)
dynamic_condition_source_prior (series__float)
dynamic_compare_source_prior (series__float)
use_dynamic_compare_source (series__bool)
dynamic_condition_activate_value (series__string)
use_cash (series__bool)
use_percent_equity (series__bool)
percent_equity_amount (series__float)
cash_amount (series__float)
position_size (series__float)
total_position_size (series__float)
prior_total_position_size (series__float)
equity_remaining (series__float)
prior_equity_remaining (series__float)
initial_equity (series__float)
use_martingale (series__bool)
martingale_win_ratio (series__float)
martingale_lose_ratio (series__float)
martingale_win_limit (series__integer)
martingale_lose_limit (series__integer)
martingale_limit_reset_mode (series__string)
use_dynamic_percent_equity (series__bool)
dynamic_percent_equity_amount (series__float)
initial_dynamic_percent_equity_amount (series__float)
dynamic_percent_equity_source (series__float)
dynamic_percent_equity_min (series__float)
dynamic_percent_equity_max (series__float)
dynamic_percent_equity_source_sell_range (series__float)
dynamic_percent_equity_source_buy_range (series__float)
dynamic_equity_interpolation_method (series__string)
total_bars (series__integer)
bar_index_at_activate (series__integer)
bars_since_active (series__integer)
time_at_activate (series__integer)
time_since_active (series__integer)
bar_index_at_activated (series__integer)
bar_index_at_pyramid_change (series__integer)
name (series__string)
id (series__string)
group (series__string)
pyramiding_limit (series__integer)
self_pyramiding_limit (series__integer)
self_pyramiding_positions (array__|entry_position|#OBJ)
new_pyramid_cancels_dca (series__bool)
num_active_long_positions (series__integer)
num_active_short_positions (series__integer)
num_active_positions (series__integer)
position_remaining (series__float)
prior_position_remaining (series__float)
direction (series__string)
allow_flip_position (series__bool)
flip_occurred (series__bool)
ignore_flip (series__bool)
use_dca (series__bool)
dca_use_limit (series__bool)
dca_num_positions (series__integer)
dca_positions (array__float)
dca_deviation_percentage (series__float)
dca_scale (series__float)
dca_percentages (series__string)
dca_close_cancels (series__bool)
dca_active_positions (series__integer)
use_atr_deviation (series__bool)
dca_atr_length (series__integer)
dca_atr_mult (series__float)
dca_atr_updates_dca_positions (series__bool)
close_price_at_order (series__float)
dca_use_deviation_atr_min (series__bool)
dca_position_quantities (array__float)
use_dca_dynamic_percent_equity (series__bool)
dca_in_use (array__bool)
dca_activated (array__bool)
dca_money_used (array__float)
dca_lines (array__line)
dca_color (series__color)
show_dca_lines (series__bool)
atr_value (series__float)
atr_value_at_activation (series__float)
use_cooldown_bars (series__bool)
cooldown_bars (series__integer)
cooldown_bar_changed (series__bool)
cooldown_bar_index (series__integer)
cooldown_bar_index_prior (series__integer)
cooldown_bar_change_count (series__integer)
expire_condition_activate_value (series__string)
expire_condition_source (series__float)
expire_condition_source_prior (series__float)
expire_compare_source (series__float)
expire_compare_source_prior (series__float)
use_expire_compare_source (series__bool)
expire_condition_operator (series__string)
exit_position
Fields:
disabled (series__bool)
id (series__string)
group (series__string)
exit_for_entries (series__string)
exit_for_groups (series__string)
total_bars (series__integer)
name (series__string)
condition (series__bool)
dynamic_condition (series__bool)
use_dynamic_condition (series__bool)
use_override_default_condition (series__bool)
dynamic_condition_operator (series__string)
dynamic_condition_source (series__float)
dynamic_compare_source (series__float)
dynamic_condition_source_prior (series__float)
dynamic_compare_source_prior (series__float)
use_dynamic_compare_source (series__bool)
dynamic_condition_activate_value (series__string)
activate (series__bool)
active (series__bool)
reset_equity (series__bool)
use_limit (series__bool)
use_alerts (series__bool)
reset_entry_cooldowns (series__bool)
prevent_new_entries_on_partial_close (series__bool)
show_activation_zone (series__bool)
use_average_position (series__bool)
source_value (series__float)
trigger_x_times (series__integer)
amount_of_times_triggered (series__integer)
quantity_percent (series__float)
trade_qty (series__float)
exit_amount (series__float)
entries_exiting_for (array__|entry_position|#OBJ)
atr_value (series__float)
update_atr (series__bool)
use_activate_after_bars (series__bool)
show_activate_after_bars (series__bool)
activate_after_bars (series__integer)
activate_after_bars_bar_changed (series__bool)
activate_after_bars_bar_index (series__integer)
activate_after_bars_bar_index_prior (series__integer)
activate_after_bars_bar_change_count (series__integer)
all_conditions_pass (series__bool)
use_close_if_profit_only (series__bool)
profit_value (series__float)
exit_type (series__string)
exit_modifier (series__string)
update_atr_with_new_pyramid (series__bool)
percentage (series__float)
activation_percentage (series__float)
atr_multiplier (series__float)
use_cancel_if_percent (series__bool)
cancel_if_percent (series__float)
activation_value (series__float)
activation_value_crossed (series__bool)
exit_value (series__float)
hypo_long_exit_value (series__float)
hypo_short_exit_value (series__float)
close_exit_value (series__float)
debug (series__float)
expire_condition_activate_value (series__string)
expire_condition_source (series__float)
expire_condition_source_prior (series__float)
expire_compare_source (series__float)
expire_compare_source_prior (series__float)
use_expire_compare_source (series__bool)
expire_condition_operator (series__string)
equity_management
Fields:
equity (series__float)
prior_equity (series__float)
position_used (series__float)
prior_position_used (series__float)
prevent_future_entries (series__bool)
minimum_order_size (series__float)
decimal_rounding_precision (series__integer)
direction (series__string)
show_order_info_in_comments (series__bool)
show_order_info_in_labels (series__bool)
allow_longs (series__bool)
allow_shorts (series__bool)
override_occured (series__bool)
flip_occured (series__bool)
num_concurrent_wins (series__integer)
num_concurrent_losses (series__integer)
first_entry (|entry_position|#OBJ)
num_win_trades (series__integer)
num_losing_trades (series__integer)

Liquidation Ranges + Volume/OI Dots [Kioseff Trading]Hello!
Introducing a multi-faceted indicator "Liquidation Ranges + Volume Dots" - this indicator replicates the volume dot tools found on various charting platforms and populates a liquidation range on crypto assets!
Features
Volume/OI dots populated according to user settings
Size of volume/OI dots corresponds to degree of abnormality
Naked level volume dots
Fixed range capabilities for volume/OI dots
Visible time range capabilities for volume/OI dots
Lower timeframe data used to discover iceberg orders (estimated using 1-minute data)
S/R lines drawn at high volume/OI areas
Liquidation ranges for crypto assets (10x - 100x)
Liquidation ranges are calculated using a popular crypto exchange's method
# of violations of liquidation ranges are recorded and presented in table
Pertinent high volume/OI price areas are recorded and presented in table
Personalized coloring for volume/OI dots
Net shorts / net long for the price range recorded
Lines shows reflecting net short & net long increases/decreases
Configurable volume/OI heatmap (displayed between liquidation ranges)
And some more (:
Liquidation Range
The liquidation range component of the indicator uses a popular crypto exchange's calculation (for liquidation ranges) to populate the chart for where 10x - 100x leverage orders are stopped out.
The image above depicts features corresponding to net shorts and net longs.
The image above shows features corresponding to liquidation zones for the underlying coin.
The image above shows the option to display volume/oi delta at the time the corresponding grid was traded at.
The image above shows an instance of using the "fixed range" feature for the script.
*The average price of the range is calculated to project liquidation zones.
*Heatmap is calculated using OI (or volume) delta.
Huge thank you to Pine Wizard @DonovanWall for his range filter code!
Price ranges are automatically detected using his calculation (:
Volume / OI Dots
Similar to other charting platforms, the volume/OI dots component of the indicator distinguishes "abnormal" changes in volume/OI; the detected price area is subsequently identified on the chart.
The detection method uses percent rank and calculates on the last bar of the chart. The "agelessness" of detection is contingent on user settings.
The image above shows volume dots in action; the size of each volume dot corresponds to the amount of volume at the price area.
Smaller dots = lower volume
Larger dots = higher volume
The image above exemplifies the highest aggression setting for volume/OI dot detection.
The table oriented top-right shows the highest volume areas (discovered on the 1-minute chart) for the calculated period.
The open interest change and corresponding price level are also shown. Results are listed in descending order but can also be listed in order of occurrence (most relevant).
Additionally, you can use the visible time range feature to detect volume dots.
The feature shows and explains how the visible range feature works. You select how many levels you want to detect and the script will detect the selected number of levels.
For instance, if I select to show 20 levels, the script will find the 20 highest volume/OI change price areas and distinguish them.
The image above shows a narrower price range.
The image above shows the same price range; however, the script is detecting the highest OI change price areas instead of volume.
* You can also set a fixed range with this feature
* Naked levels can be used
Additionally, you can select for the script to show only the highest volume/ OI change price area for each bar. When active, the script will successively identify the highest volume / OI change price area for the most recent bars.
Naked Levels
The image above shows and explains how naked levels can be detected when using the script.
And that's pretty much it!
Of course, there're a few more features you can check out when you use the script that haven't been explained here (:
Thank you again to @DonovanWall
Thank you to @Trendoscope for his binary insertion sort library (:
Thank you to @PineCoders for their time library
Thank you for checking this out!

Modern Portfolio Management IndicatorAfter weeks of grueling over this indicator, I am excited to be releasing it!
Intro:
This is not a sexy, technical or math based indicator that will give you buy and sell signals or anything fancy, but it is an indicator that I created in hopes to bridge a gap I have noticed. That gap is the lack of indicators and technical resources for those who also like to plan their investments. This indicator is tailored to those who are either established investors and to those who are looking to get into investing but don't really know where to start.
The premise of this indicator is based on Modern Portfolio Theory (MPT). Before we get into the indicator itself, I think its important to provide a quick synopsis of MPT.
About MPT:
Modern Portfolio Theory (MPT) is an investment framework that was developed by Harry Markowitz in the 1950s. It is based on the idea that an investor can optimize their investment portfolio by considering the trade-off between risk and return. MPT emphasizes diversification and holds that the risk of an individual asset should be assessed in the context of its contribution to the overall portfolio's risk. The theory suggests that by diversifying investments across different asset classes with varying levels of risk, an investor can achieve a more efficient portfolio that maximizes returns for a given level of risk or minimizes risk for a desired level of return. MPT also introduced the concept of the efficient frontier, which represents the set of portfolios that offer the highest expected return for a given level of risk. MPT has been widely adopted and used by investors, financial advisors, and portfolio managers to construct and manage portfolios.
So how does this indicator help with MPT?
The thinking and theory that went behind this indicator was this: I wanted an indicator, or really just a "way" to test and back-test ticker performance over time and under various circumstances and help manage risk.
Over the last 3 years we have seen a massive bull market, followed by a pretty huge bear market, followed by a very unexpected bull market. We have been and continue to be plagued with economic and political uncertainty that seems to constantly be looming over everyone with each waking day. Some people have liquidated their retirement investments, while others are fomoing in to catch this current bull run. But which tickers are sound and how tickers and funds have compared amongst each other remains somewhat difficult to ascertain, absent manually reviewing and calculating each ticker individually.
That is where this indicator comes in. This indicator permits the user to define up to 5 equities that they are potentially interested in investing in, or are already invested in. The user can then select a specific period in time, say from the beginning of 2022 till now. The user can then define how much they want to invest in each company by number of shares, so if they want to buy 1 share a week, or 2 shares a month, they can input these variables into the indicator to draw conclusions. As many brokers are also now permitting fractional share trading, this ability is also integrated into the indicator. So for shares, you can put in, say, 0.25 shares of SPY and the indicator will accept this and account for this fractional share.
The indicator will then show you a portfolio summary of what your earnings and returns would be for the defined period. It will provide a percent return as well as the projected P&L based on your desired investment amount and frequency.
But it goes beyond just that, you can also have the indicator display a simple forecasting projection of the portfolio. It will show the projected P&L and % Return over various periods in time on each of the ticker (see image below):
The indicator will also break down your portfolio allocation, it will show where the majority of your holdings are and where the majority of your P&L in coming from (best performers will show a green fill and worst will show a red fill, see image below):
This colour coding also extends to the portfolio breakdown itself.
Dollar cost averaging (DCA) is incorporated into the indicator itself, by assuming ongoing contributions. If you want to stop contributions at a certain point, you just select your end time for contributions at the point in which you would stop contributing.
The indicator also provides some basic fundamental information about the company tickers (if applicable). Simply select the "Fundamental" chart and it will display a breakdown of the fundamentals, including dividends paid, market cap and earnings yield:
The indicator also provides a correlation assessment of each holding against each other holding. This emphasizes the profound role of diversification on portfolios. The less correlation you have in your portfolio among your holdings, the better diversified you are. As well, if you have holdings that are perfectly inverse other holdings, you have a pseudo hedge against the downturn of one of your holdings. This is even more helpful if the inverse is a company with solid fundamentals.
In the below example you will see NASDAQ:IRDM in the portfolio. You will be able to see that NASDAQ:IRDM has a slight inverse relationship to SPY:
Yet IRDM has solid fundamentals and is performing well fundamentally. Thus, this makes IRDIM a solid addition to your portfolio as it can potentially hedge against a downturn for SPY and is less risky than simply holding an inverse leveraged share on SPY which is most likely just going to cost you money than make you money.
Concluding remarks:
There are many fun and interesting things you can do with this indicator and I encourage you to try it out and have fun with it! The overall objective with the indicator is to help you plan for your portfolio and not necessarily to manage your portfolio. If you have a few stocks you are looking at and contemplating investing in, this will help you run some theoretical scenarios with this stock based on historical performance and also help give you a feel of how it will perform in the future based on past behaviour.
It is important to remember that past behaviour does not indicate future behaviour, but the indicator provides you with tools to get a feel for how a stock has performed under various circumstances and get a general feel of the fundamentals of the company you could potentially be investing in.
Please note, this indicator is not meant to replace full, fundamental analyses of individual companies. It is simply meant to give you a "gist" of how companies are fundamentally and how they have performed historically.
I hope you enjoy it!
Safe trades everyone!

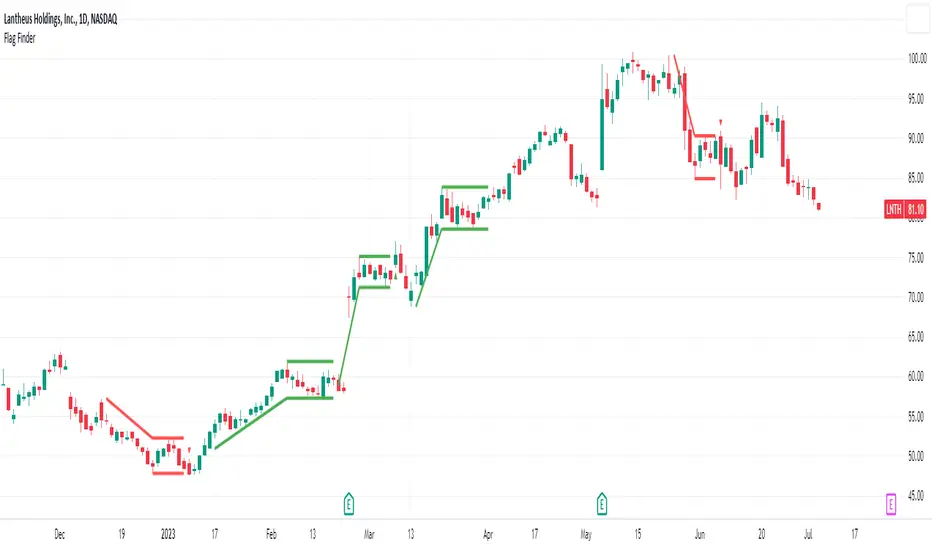
Flag FinderFlag Finder Indicator is a technical analysis tool to identify bull and bear flags.
What are flags
Flags are continuation patterns that occur within the general trend of the security. A bull flag represents a temporary pause or consolidation before price resumes it's upward movement, while a bear flag occurs before price continues its downward movement.
Both flag patterns consist of two components:
The Pole
The Flag
The pole is the initial strong upward surge or decline that precedes the flag. The pole is usually a fast move accompanied by heavy volume signaling significant buying or selling pressure.
The flag is then formed as price consolidates after the initial surge or decline from the pole. For a bull flag price will drift slightly downward to sideways, a bear flag will drift upward to sideways. The best flags often see volume dry up during this phase of the pattern.
Indicator Settings
Both components are fully customizable in the indicator so the user can adjust for any time frame or volatility. Select the minimum and maximum accepted limits from the % gain loss required for the pole, the maximum acceptable flag depth or rally and the minimum and maximum number of bars for each component.
Colors and what components are visible at any time are also user controlled.
Trading flags
Traders typically use flags to enter on breakouts. A breakout occurs when price moves above the left side high of a bull flag or below the left side low of a bear flag.
Alerts
The Flag Finder allows for four different types of alerts
New Bull Flag
New Bear Flag
Bull Flag Breakout
Bear Flag Breakout
Pine Script
On top of the indicator identifying bull and bear flags, throughout the source code I left notes on nearly every line to help anyone who is interested in pine script see my thought process and explain which each line of code does. This code isn't too complex, but it offers a look into many different concepts one might use when writing pinescript such as:
input groups
declaring and reassigning variables
for loops
plotshapes & lines
alerts
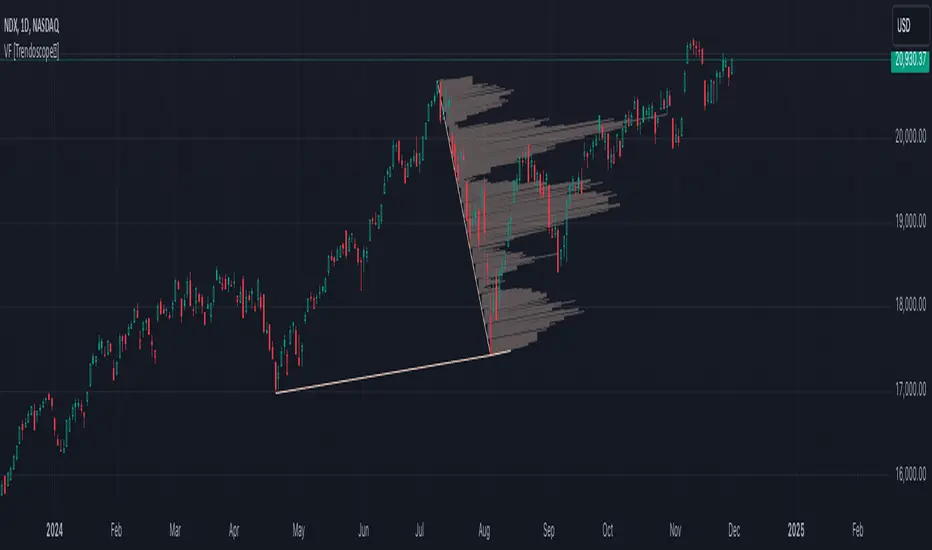
Volume Forks [Trendoscope]🎲 Volume Forks - Advanced Price Analysis with Recursive Auto-Pitchfork and Angled Volume Profile
The Volume Forks Indicator is a comprehensive research tool that combines two innovative techniques, Recursive Auto-Pitchfork and Angled Volume Profile . This indicator provides traders with valuable insights into price dynamics by integrating accurate pitchfork drawing and volume analysis over angled levels. The indicator does following things
Detects Pitchfork formations automatically on the chart over Recursive Zigzag
Instead of drawing forks based on fib levels, volume distribution over ABC of pitchfork is calculated and drawn in the direction of the handle.
🎲 Brief about Pitchfork
Pitchfork is drawn when price forms ABC pattern. Pitchfork draws a series of parallel lines in the direction of trend which can be used for support and resistance.
There are many methods of drawing pitchfork. In all cases, a line joining BC will make the base of pitchfork and fork lines are drawn from different points of the base. All the fork lines will be parallel. But, the handle of the base defines the direction of fork lines. Classification of pitchfork is mainly based on the starting and ending points of the handle.
🎲 Regular Types
Here, end of the handle is always fixed and it will be the mid point of B and C.
🎯 Andrews Pitchfork
Handle starts from A and joins the base at mid of B and C.
Forks are drawn based on fib ratios from the handle
🎯 Schiff Pitchfork
Handle starts from Bar of A and price of middle of AB and joins the base at mid of B and C
Forks are drawn based on fib ratios from the handle
🎯 Modified Schiff Pitchfork
Handle starts from mid of A and B and joins the base at mid of B and C
Forks are drawn based on fib ratios from the handle
🎲 Inside Types
Here, C will act as end of the handle which joins the Base BC .
🎯 Andrews Pitchfork (Inside)
Handle starts from A and joins the base at C
Forks are drawn based on fib ratios from the handle
🎯 Schiff Pitchfork (Inside)
Handle starts from Bar of A and price of (A+B)/2 and joins the base at C
Forks are drawn based on fib ratios from the handle
🎯 Modified Schiff Pitchfork (Inside)
Handle starts from mid of A and B and joins the base at C
Forks are drawn based on fib ratios from the handle
🎲 Brief about Pitchfork
The Angled Volume Profile technique expands on the concept of volume profile by measuring volume distribution levels over angled levels rather than just horizontal levels. By selecting a starting point and angle interactively, traders can assess volume distribution within specific price trends. This feature is particularly useful for analysing volume dynamics in trending markets.
🎲 Settings
Indicator settings include few things which determine the scanning of pitchforks and few which determines drawing of volume profile lines.
Please note that, due to pine limitations of 500 lines, if there are too many formations on the chart, volume profile may not appear correctly. If that happens, please reduce the number of volume forks per formation.
Developing Market Profile / TPO [Honestcowboy]The Developing Market Profile Indicator aims to broaden the horizon of Market Profile / TPO research and trading. While standard Market Profiles aim is to show where PRICE is in relation to TIME on a previous session (usually a day). Developing Market Profile will change bar by bar and display PRICE in relation to TIME for a user specified number of past bars.
What is a market profile?
"Market Profile is an intra-day charting technique (price vertical, time/activity horizontal) devised by J. Peter Steidlmayer. Steidlmayer was seeking a way to determine and to evaluate market value as it developed in the day time frame. The concept was to display price on a vertical axis against time on the horizontal, and the ensuing graphic generally is a bell shape--fatter at the middle prices, with activity trailing off and volume diminished at the extreme higher and lower prices."
For education on market profiles I recommend you search the net and study some profitable traders who use it.
Key Differences
Does not have a value area but distinguishes each column in relation to the biggest column in percentage terms.
Updates bar by bar
Does not take sessions into account
Shows historical values for each bar
While there is an entire education system build around Market Profiles they usually focus on a daily profile and in some cases how the value area develops during the day (there are indicators showing the developing value area).
The idea of trading based on a developing value area is what inspired me to build the Developing Market Profile.
🟦 CALCULATION
Think of this Developing Market Profile the same way as you would think of a moving average. On each bar it will lookback 200 bars (or as user specified) and calculate a Market Profile from those bars (range).
🔹Market Profile gets calculated using these steps:
Get the highest high and lowest low of the price range.
Separate that range into user specified amount of price zones (all spaced evenly)
Loop through the ranges bars and on each bar check in which price zones price was, then add +1 to the zones price was in (we do this using the OccurenceArray)
After it looped through all bars in the range it will draw columns for each price zone (using boxes) and make them as wide as the OccurenceArray dictates in number of bars
🔹Coloring each column:
The script will find the biggest column in the Profile and use that as a reference for all other columns. It will then decide for each column individually how big it is in % compared to the biggest column. It will use that percentage to decide which color to give it, top 20% will be red, top 40% purple, top 60% blue, top 80% green and all the rest yellow. The user is able to adjust these numbers for further customisation.
The historical display of the profiles uses plotchar() and will not only use the color of the column at that time but the % rating will also decide transparancy for further detail when analysing how the profiles developed over time. Each of those historical profiles is calculated using its own 200 past bars. This makes the script very heavy and that is why it includes optimisation settings, more info below.
🟦 USAGE
My general idea of the markets is that they are ever changing and that in studying that changing behaviour a good trader is able to distinguish new behaviour from old behaviour and adapt his approach before losing traders "weak hands" do.
A Market Profile can visually show a trader what kind of market environment we currently are in. In training this visual feedback helps traders remember past market environments and how the market behaved during these times.
Use the history shown using plotchars in colors to get an idea of how the Market Profile looked at each bar of the chart.
This history will help in studying how price moves at different stages of the Market Profile development.
I'm in no way an expert in trading Market Profiles so take this information with a grain of salt. Below an idea of how I would trade using this indicator:
🟦 SETTINGS
🔹MARKET PROFILING
Lookback: The amount of bars the Market Profile will look in the past to calculate where price has been the most in that range
Resolution: This is the amount of columns the Market Profile will have. These columns are calculated using the highest and lowest point price has been for the lookback period
Resolution is limited to a maximum of 32 because of pinescript plotting limits (64). Each plotchar() because of using variable colors takes up 2 of these slots
🔹VISUAL SETTINGS
Profile Distance From Chart: The amount of bars the market profile will be offset from the current bar
Border width (MP): The line thickness of the Market Profile column borders
Character: This is the character the history will use to show past profiles, default is a square.
Color theme: You can pick 5 colors from biggest column of the Profile to smallest column of the profile.
Numbers: these are for % to decide column color. So on default top 20% will be red, top 40% purple... Always use these in descending order
Show Market Profile: This setting will enable/disable the current Market Profile (columns on right side of current bar)
Show Profile History: This setting will enable/disable the Profile History which are the colored characters you see on each bar
🔹OPTIMISATION AND DEBUGGING
Calculate from here: The Market Profile will only start to calculate bar by bar from this point. Setting is needed to optimise loading time and quite frankly without it the script would probably exceed tradingview loading time limits.
Min Size: This setting is there to avoid visual bugs in the script. Scaling the chart there can be issues where the Market Profile extends all the way to 0. To avoid this use a minimum size bigger than the bugged bottom box

Cycles AnalysisI strongly believe in cycles, so I wanted to create something that would give a visual representation of bull/bear markets and give a prediction based on the previous data. It's up to you how to decide what is a bull/bear cycle. There is no single rule for all assets because 20% drop in SP500 starts a bear market in traditional markets, while 35% drop for Bitcoin is a Tuesday. You have two options on how to decide when markets turn: either by a % change (traditional definition) or if there is no new high/low after X days. A softer version to show periods of no new highs/lows is to use the Stagnation option. Stagnation periods hava the same logic as the cycle change by X days: if there is no new high/low then we treat this period as a stagnation. The difference is that stagnation periods do not change cycle directions and do not participate in calculations.
The script also draws a possible "predictions" zone where the current cycle might end up. There is no magic here, it just takes previous cycles' size to draw the possible boundaries. If you decide to use percentiles then the box area will be taken from the percentiles calculations, otherwise it will come from the full data. "x" in the predictions zone represents a target mean (average) value, "o" represents a target median value.
A few things to keep in mind:
- this script is not supposed to be used in trading. It was created for analysis. It repaints. And when I say "it repaints" - it might like repaint the last 6 months of data if a new low comes and we are in a stagnation period (aka not a financial advice).
- it doesn't work with replays as it does calculations only once on the last candle.
- you need at least 3 periods to be able to calculate percentiles. And after this it will remove at least 1 period on each side. Which means that 90 percentile will not be a real 90 percentile until you have enough periods for it to be (20 in this specific case).
- it assumes that a year = 360 days, and a month = 30 days. So the duration presentation might not be exact, until you move to the day level.
- I had macro analysis in mind when I created the script, but nothing stops you from using it in a 1m time frame for BTC. Just change the time duration presentation.
- the last period is not finished, so it doesn't participate in calculations.

Liquidity Sentiment Profile [LuxAlgo]The Liquidity Sentiment Profile is an advanced charting tool that measures by combining PRICE and VOLUME data over specified anchored periods and highlights within a sequence of profiles the distribution of the liquidity and the market sentiment at specific price levels.
The Liquidity Sentiment Profile allows traders to reveal significant price levels, dominant market sentiment, support and resistance levels, supply and demand zones, liquidity availability levels, liquidity gaps, consolidation zones, and more based on price and volume data.
Liquidity refers to the availability of orders at specific price levels in the market, allowing transactions to occur smoothly.
🔶 USAGE
A Liquidity Sentiment Profile is a combination of a liquidity and a sentiment profile, where the right part of the profile displays the distribution of the traded activity at different price levels and the left part displays the market sentiment at those price levels.
The Liquidity Sentiment Profiles are visualized with different colors, where each color has a different meaning.
The Liquidity Sentiment Profiles aim to present Value Areas based on the significance of price levels, thus allowing users to identify value areas that can be formed more than once within the range of a single profile.
Level of Significance Line - displays the changes in the price levels with the highest traded activity (developing POC)
🔶 SETTINGS
The script takes into account user-defined parameters and plots the profiles, where detailed usage for each user-defined input parameter in indicator settings is provided with the related input's tooltip.
🔹 Liquidity Sentiment Profiles
Anchor Period: The indicator resolution is set by the input of the Anchor Period, the default option is AUTO.
🔹 Liquidity Profile Settings
Liquidity Profile: Toggles the visibility of the Liquidity Profiles
High Traded Nodes: Threshold and Color option for High Traded Nodes
Average Traded Nodes: Color option for Average Traded Nodes
Low Traded Nodes: Threshold and Color option for Low Traded Nodes
🔹 Sentiment Profile Settings
Sentiment Profile: Toggles the visibility of the Sentiment Profiles
Bullish Nodes: Color option for Bullish Nodes
Bearish Nodes: Color option for Bearish Nodes
🔹 Other Settings
Level of Significance: Toggles the visibility of the Level of Significance Line
Profile Price Levels: Toggles the visibility of the Profile Price Levels
Number of Rows: Specify how many rows each profile histogram will have. Caution, having it set to high values will quickly hit Pine Script™ drawing objects limit and fewer historical profiles will be displayed
Profile Width %: Alters the width of the rows in the histogram, relative to the profile length
Profile Range Background Fill: Toggles the visibility of the Profiles Range
🔶 LIMITATIONS
The amount of drawing objects that can be used is limited, as such using a high number of rows can display fewer historical profiles and occasionally incomplete profiles.
🔶 RELATED SCRIPTS
🔹 Buyside-Sellside-Liquidity
🔹 ICT-Concepts
🔹 Swing-Volume-Profiles

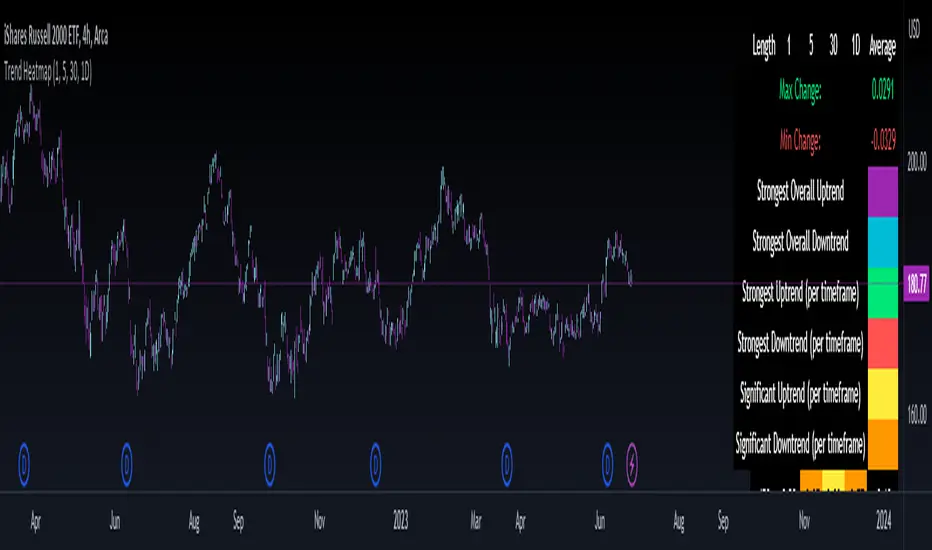
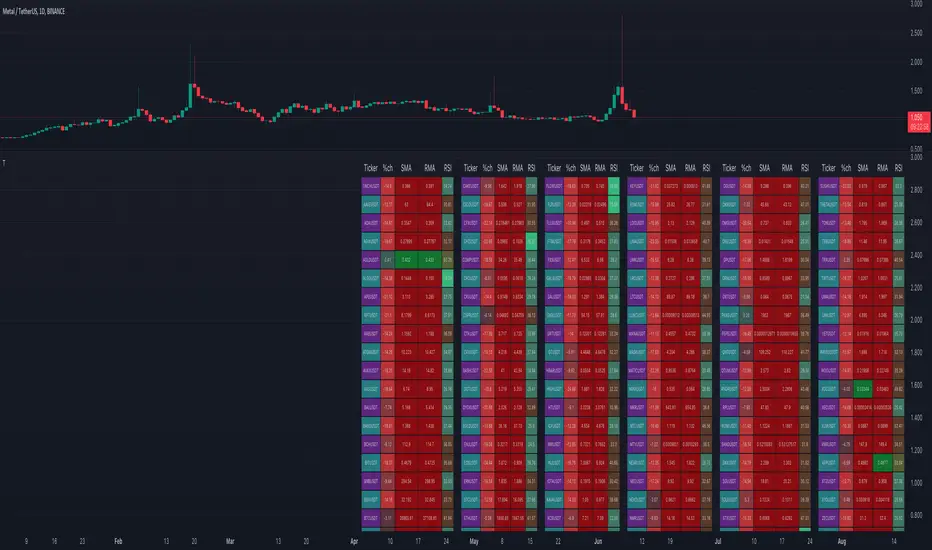
Trend Correlation HeatmapHello everyone!
I am excited to release my trend correlation heatmap, or trend heatmap for short.
Per usual, I think its important to explain the theory before we get into the use of the indicator, so let's get into the theory!
The theory:
So what is a correlation?
Correlation is the relationship one variable has to another. Correlations are the basis of everything I do as a quantitative trader. From the correlation between the same variables (i.e. autocorrelation), the correlation between other variables (i.e. VIX and SPY, SPY High and SPY Low, DXY and ES1! close, etc.) and, as well, the correlation between price and time (time series correlation).
This may sound very familiar to you, especially if you are a user, observer or follower of my ideas and/or indicators. Ninety-five percent of my indicators are a function of one of those three things. Whether it be a time series based indicator (i.e.my time series indicator), whether it be autocorrelation (my autoregressive cloud indicator or my autocorrelation oscillator) or whether it be regressive in nature (i.e. my SPY Volume weighted close, or even my expected move which uses averages in lieu of regressive approaches but is foundational in regression principles. Or even my VIX oscillator which relies on the premise of correlations between tickers.) So correlation is extremely important to me and while its true I am more of a regression trader than anything, I would argue that I am more of a correlation trader, because correlations are the backbone of how I develop math models of stocks.
What I am trying to stress here is the importance of correlations. They really truly are foundational to any type of quantitative analysis for stocks. And as such, understanding the current relationship a stock has to time is pivotal for any meaningful analysis to be conducted.
So what is correlation to time and what does it tell us?
Correlation to time, otherwise known and commonly referred to as "Time Series", is the relationship a ticker's price has to the passing of time. It is displayed in the traditional Pearson Correlation Coefficient or R value and can be any value from -1 (strong negative relationship, i.e. a strong downtrend) to + 1 (i.e. a strong positive relationship, i.e. a strong uptrend). The higher or lower the value the stronger the up or downtrend is.
As such, correlation to time tells us two very important things. These are:
a) The direction of the stock; and
b) The strength of the trend.
Let's take a look at an example:
Above we have a chart of QQQ. We can see a trendline that seems to fit well. The questions we ask as traders are:
1. What is the likelihood QQQ breaks down from this trendline?
2. What is the likelihood QQQ continues up?
3. What is the likelihood QQQ does a false breakdown?
There are numerous mathematical approaches we can take to answer these questions. For example, 1 and 2 can be answered by use of a Cumulative Distribution Density analysis (CDDA) or even a linear or loglinear regression analysis and 3 can be answered, more or less, with a linear regression analysis and standard error ascertainment, or even just a general comparison using a data science approach (such as cosine similarity or Manhattan distance).
But, the reality is, all 3 of these questions can be visualized, at least in some way, by simply looking at the correlation to time. Let's look at this chart again, this time with the correlation heatmap applied:
If we look at the indicator we can see some pivotal things. These are:
1. We have 4, very strong uptrends that span both higher AND lower timeframes. We have a strong uptrend of 0.96 on the 5 minute, 50 candle period. We have a strong uptrend at the 300 candle lookback period on the 1 minute, we have a strong uptrend on the 100 day lookback on the daily timeframe period and we have a strong uptrend on the 5 minute on the 500 candle lookback period.
2. By comparison, we have 3 downtrends, all of which have correlations less than the 4 uptrends. All of the downtrends have a correlation above -0.8 (which we would want lower than -0.8 to be very strong), and all of the uptrends are greater than + 0.80.
3. We can also see that the uptrends are not confined to the smaller timeframes. We have multiple uptrends on multiple timeframes and both short term (50 to 100 candles) and long term (up to 500 candles).
4. The overall trend is strengthening to the upside manifested by a positive Max Change and a Positive Min change (to be discussed later more in-depth).
With this, we can see that QQQ is actually very strong and likely will continue at least some upside. If we let this play out:
We continued up, had one test and then bounced.
Now, I want to specify, this indicator is not a panacea for all trading. And in relation to the 3 questions posed, they are best answered, at least quantitatively, not only by correlation but also by the aforementioned methods (CDDA, etc.) but correlation will help you get a feel for the strength or weakness present with a stock.
What are some tangible applications of the indicator?
For me, this indicator is used in many ways. Let me outline some ways I generally apply this indicator in my day and swing trading:
1. Gauging the strength of the stock: The indictor tells you the most prevalent behavior of the stock. Are there more downtrends than uptrends present? Are the downtrends present on the larger timeframes vs uptrends on the shorter indicating a possible bullish reversal? or vice versa? Are the trends strengthening or weakening? All of these things can be visualized with the indicator.
2. Setting parameters for other indicators: If you trade EMAs or SMAs, you may have a "one size fits all" approach. However, its actually better to adjust your EMA or SMA length to the actual trend itself. Take a look at this:
This is QQQ on the 1 hour with the 200 EMA with 200 standard deviation bands added. If we look at the heatmap, we can see, yes indeed 200 has a fairly strong uptrend correlation of 0.70. But the strongest hourly uptrend is actually at 400 candles, with a correlation of 0.91. So what happens if we change the EMA length and standard deviation to 400? This:
The exact areas are circled and colour coded. You can see, the 400 offers more of a better reference point of supports and resistances as well as a better overall trend fit. And this is why I never advocate for getting married to a specific EMA. If you are an EMA 200 lover or 21 or 51, know that these are not always the best depending on the trend and situation.
Components of the indicator:
Ah okay, now for the boring stuff. Let's go over the functionality of the indicator. I tried to keep it simple, so it is pretty straight forward. If we open the menu here are our options:
We have the ability to toggle whichever timeframes we want. We also have the ability to toggle on or off the legend that displays the colour codes and the Max and Min highest change.
Max and Min highest change: The max and min highest change simply display the change in correlation over the previous 14 candles. An increasing Max change means that the Max trend is strengthening. If we see an increasing Max change and an increasing Min change (the Min correlation is moving up), this means the stock is bullish. Why? Because the min (i.e. ideally a big negative number) is going up closer to the positives. Therefore, the downtrend is weakening.
If we see both the Max and Min declining (red), that means the uptrend is weakening and downtrend is strengthening. Here are some examples:
Final Thoughts:
And that is the indicator and the theory behind the indicator.
In a nutshell, to summarize, the indicator simply tracks the correlation of a ticker to time on multiple timeframes. This will allow you to make judgements about strength, sentiment and also help you adjust which tools and timeframes you are using to perform your analyses.
As well, to make the indicator more user friendly, I tried to make the colours distinctively different. I was going to do different shades but it was a little difficult to visualize. As such, I have included a toggle-able legend with a breakdown of the colour codes!
That's it my friends, I hope you find it useful!
Safe trades and leave your questions, comments and feedback below!
ICT Killzones + Pivots [TFO]Designed with the help of TTrades and with inspiration from the ICT Everything indicator by coldbrewrosh, the purpose of this script is to identify ICT Killzones while also storing their highs and lows for future reference, until traded through.
There are 5 Killzones / sessions whose times and labels can all be changed to one's liking. Some prefer slight alterations to traditional ICT Killzones, or use different time windows altogether. Either way, the sessions are fully customizable. The sessions will auto fit to keep track of the highs and lows made during their respective times, and these pivots will be extended until they are invalidated.
There are also 4 optional Open Price lines and 4 vertical Timestamps, where the user can change the time and style of each one as well.
To help maintain a clean chart, we can implement a Cutoff Time where all drawings will stop extending past a certain point. The indicator will apply this logic by default, as it can get messy with multiple drawings starting and stopping throughout the day at different times.
Given the amount of interest I've received about this indicator, I intend to leave it open to suggestions for further improvements. Let me know what you think & what you want to see added!
120x ticker screener (composite tickers)In specific circumstances, it is possible to extract data, far above the 40 `request.*()` call limit for 1 single script .
The following technique uses composite tickers . Changing tickers needs to be done in the code itself as will be explained further.
⎯⎯⎯⎯⎯⎯⎯⎯⎯⎯⎯⎯⎯⎯⎯⎯⎯⎯⎯⎯⎯⎯⎯⎯⎯⎯⎯⎯⎯⎯⎯⎯⎯⎯⎯⎯⎯⎯⎯⎯⎯⎯⎯⎯⎯⎯⎯⎯⎯⎯⎯⎯⎯⎯⎯
🔶 PRINCIPLE
Standard example:
c1 = request.security('MTLUSDT' , 'D', close)
This will give the close value from 1 ticker (MTLUSDT); c1 for example is 1.153
Now let's add 2 tickers to MTLUSDT; XMRUSDT and ORNUSDT with, for example, values of 1.153 (I), 143.4 (II) and 0.8242 (III) respectively.
Just adding them up 'MTLUSDT+XMRUSDT+ORNUSDT' would give 145.3772 as a result, which is not something we can use...
Let's multiply ORNUSDT by 100 -> 14340
and multiply MTLUSDT by 1000000000 -> 1153000000 (from now, 10e8 will be used instead of 1000000000)
Then we make the sum.
When we put this in a security call (just the close value) we get:
c1 = request.security('MTLUSDT*10e8+XMRUSDT*100+ORNUSDT', 'D', close)
'MTLUSDT*10e8+XMRUSDT*100+ORNUSDT' -> 1153000000 + 14340 + 0.8242 = 1153014340.8242 (a)
This (a) will be split later on, for example:
1153014330.8242 / 10e8 = 1.1530143408242 -> round -> in this case to 1.153 (I), multiply again by 10e8 -> 1153000000.00 (b)
We subtract this from the initial number:
1153014340.8242 (a)
- 1153000000.0000 (b)
–––––––––––––––––
14340.8242 (c)
Then -> 14340.8242 / 100 = 143.408242 -> round -> 143.4 (II) -> multiply -> 14340.0000 (d)
-> subtract
14340.8242 (c)
- 14340.0000 (d)
––––––––––––
0.8242 (III)
Now we have split the number again into 3 tickers: 1.153 (I), 143.4 (II) and 0.8242 (III)
⎯⎯⎯⎯⎯⎯⎯⎯⎯⎯⎯⎯⎯⎯⎯⎯⎯⎯⎯⎯⎯⎯⎯⎯⎯⎯⎯⎯⎯⎯⎯⎯⎯⎯⎯⎯⎯⎯⎯⎯⎯⎯⎯⎯⎯⎯⎯⎯⎯⎯⎯⎯⎯⎯⎯
In this publication the function compose_3_() will make a composite ticker of 3 tickers, and the split_3_() function will split these 3 tickers again after passing 1 request.security() call.
In this example:
t46 = 'BINANCE:MTLUSDT', n46 = 10e8 , r46 = 3, t47 = 'BINANCE:XMRUSDT', n47 = 10e1, r47 = 1, t48 = 'BINANCE:ORNUSDT', r48 = 4 // T16
•••
T16= compose_3_(t48, t47, n47, t46, n46)
•••
= request.security(T16, res, )
•••
= split_3_(c16, n46, r46, n47, r47, r48)
🔶 CHANGING TICKERS
If you need to change tickers, you only have to change the first part of the script, USER DEFINED TICKERS
Back to our example, at line 26 in the code, you'll find:
t46 = 'BINANCE:MTLUSDT', n46 = 10e8 , r46 = 3, t47 = 'BINANCE:XMRUSDT', n47 = 10e1, r47 = 1, t48 = 'BINANCE:ORNUSDT', r48 = 4 // T16
( t46 , T16 ,... will be explained later)
You need to figure out how much you need to multiply each ticker, and the number for rounding, to get a good result.
In this case:
'BINANCE:MTLUSDT', multiply number = 10e8, round number is 3 (example value 1.153)
'BINANCE:XMRUSDT', multiply number = 10e1, round number is 1 (example value 143.4)
'BINANCE:ORNUSDT', NO multiply number, round number is 4 (example value 0.8242)
The value with most digits after the decimal point by preference is placed to the right side (ORNUSDT)
If you want to change these 3, how would you do so?
First pick your tickers and look for the round values, for example:
'MATICUSDT', example value = 0.5876 -> round -> 4
'LTCUSDT' , example value = 77.47 -> round -> 2
'ARBUSDT' , example value = 1.0231 -> round -> 4
Value with most digits after the decimal point -> MATIC or ARB, let's pick ARB to go on the right side, LTC at the left of ARB, and MATIC at the most left side.
-> 'MATICUSDT', LTCUSDT', ARBUSDT'
Then check with how much 'LTCUSDT' and 'MATICUSDT' needs to be multiplied to get this: 5876 0 7747 0 1.0231
'MATICUSDT' -> 10e10
'LTCUSDT' -> 10e3
Replace:
t46 = 'BINANCE:MTLUSDT', n46 = 10e8 , r46 = 3, t47 = 'BINANCE:XMRUSDT', n47 = 10e1, r47 = 1, t48 = 'BINANCE:ORNUSDT', r48 = 4 // T16
->
t46 = 'BINANCE:MATICUSDT', n46 = 10e10 , r46 = 4, t47 = 'BINANCE:LTCUSDT', n47 = 10e3, r47 = 2, t48 = 'BINANCE:ARBUSDT', r48 = 4 // T16
DO NOT change anything at t46, n46,... if you don't know what you're doing!
Only
• tickers ('BINANCE:MTLUSDT', 'BINANCE:XMRUSDT', 'BINANCE:ORNUSDT', ...),
• multiply numbers (10e8, 10e1, ...) and
• round numbers (3, 1, 4, ...)
should be changed.
There you go!
🔶 LIMITATIONS
🔹 The composite ticker fails when 1 of the 3 isn't in market in the weekend, while the other 2 are.
That is the reason all tickers are crypto. I think it is possible to combine stock,... tickers, but they have to share the same market hours.
🔹 The number cannot be as large as you want, the limit lays around 15-16 digits.
This means when you have for example 123, 45.67 and 0.000000000089, you'll get issues when composing to this:
-> 123045670.000000000089 (21 digits)
Make sure the numbers are close to each other as possible, with 1 zero (or 2) in between:
-> 1.230045670089 (13 digits by doing -> (123 * 10e-3) + (45.67 * 10e-7) + 0.000000000089)
🔹 This script contains examples of calculated values, % change, SMA, RMA and RSI.
These values need to be calculated from HTF close data at current TF (timeframe).
This gives challenges. For example the SMA / %change is not a problem (same values at 1h TF from Daily data).
RMA , RSI is not so easy though...
Daily values are rather similar on a 2-3h TF, but 1h TF and lower is quite different.
At the moment I haven't figured out why, if someone has an idea, don't hesitate to share.
The main goal of this publication is 'composite tickers ~ request.security()' though.
🔹 When a ticker value changes substantially (x10, x100), the multiply number needs to be adjusted accordingly.
🔶 SETTINGS
SHOW SETS
SET
• Length : length of SMA, RMA and RSI
• HTF : Higher TimeFrame (default Daily)
TABLE
• Size table : \ _ Self-explanatory
• Include exchange name : /
• Sort : If exchange names are shown, the exchanges will be sorted first
COLOURS
• CH%
• RSI
• SMA (RMA)
DEBUG
Remember t46 , T16 ,... ?
This can be used for debugging/checking
ALWAYS DISABLE " sort " when doing so.
Example:
Set string -> T1 (tickers FIL, CAKE, SOL)
(Numbers are slightly different due to time passing by between screen captures)
Placing your tickers at the side panel makes it easy to compare with the printed label below the table (right side, 332201415014.45 ),
together with the line T1 in the script:
t1 = 'BINANCE:FILUSDT' , n1 = 10e10, r1 = 4, t2 = 'BINANCE:CAKEUSDT' , n2 = 10e5 , r2 = 3, t3 = 'BINANCE:SOLUSDT' , r3 = 2 // T1
FIL : 3.322
CAKE: 1.415
SOL : 14.56
Now it is easy to check whether the tickers are placed close enough to each other, with 1-2 zero's in between.
If you want to check a specific ticker, use " Show Ticker" , see out initial example:
Set string -> T16
Show ticker -> 46 (in the code -> t46 = 'BINANCE:MTLUSDT')
(Set at 0 to disable " check string " and NONE to disable " Set string ")
-> Debug/check/set away! 😀
🔶 OTHER TECHNIQUES
• REGEX ( Regular expression ) and str.match() is used to delete the exchange name from the ticker, in other words, everything before ":" is deleted by following regex:
exch(t) => incl_exch ? t : str.match(t, "(?<=:) +")
• To sort, array.sort_indices() is used (line 675 in the code), just as in my first "sort" publication Sort array alphabetically - educational
aSort = arrT.copy()
sort_Indices = array.sort_indices(id= aSort, order= order.ascending)
• Numbers and text colour will adjust automatically when switching between light/dark mode by using chart.fg_color / chart.bg_color
🔹 DISCLAIMER
Please don't ask me for custom screeners, thank you.
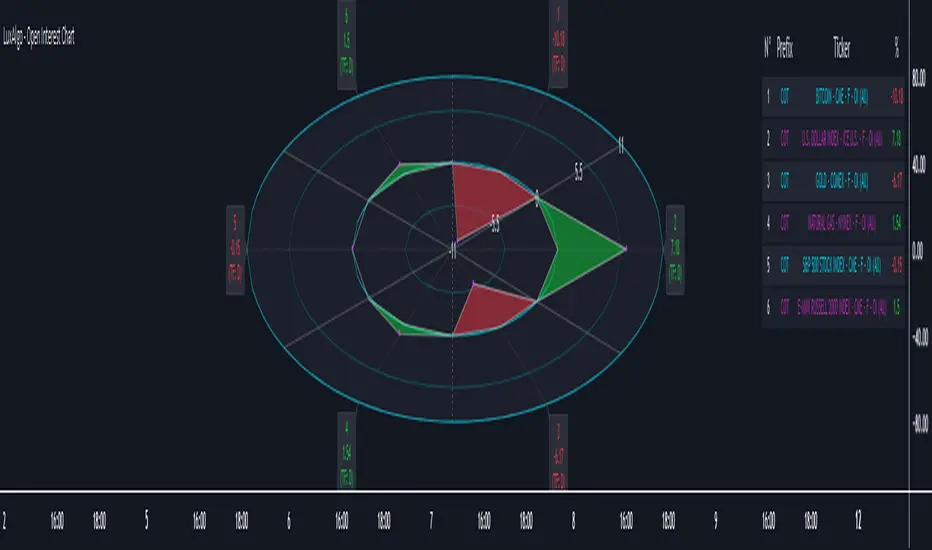
Open Interest Chart [LuxAlgo]The Open Interest Chart displays Commitments of Traders %change of futures open interest , with a unique circular plotting technique, inspired from this publication Periodic Ellipses .
🔶 USAGE
Open interest represents the total number of contracts that have been entered by market participants but have not yet been offset or delivered. This can be a direct indicator of market activity/liquidity, with higher open interest indicating a more active market.
Increasing open interest is highlighted in green on the circular plot, indicating money coming into the market, while decreasing open interests highlighted in red indicates money coming out of the market.
You can set up to 6 different Futures Open interest tickers for a quick follow up:
🔶 DETAILS
Circles are drawn, using plot() , with the functions createOuterCircle() (for the largest circle) and createInnerCircle() (for inner circles).
Following snippet will reload the chart, so the circles will remain at the right side of the chart:
if ta.change(chart.left_visible_bar_time ) or
ta.change(chart.right_visible_bar_time)
n := bar_index
Here is a snippet which will draw a 39-bars wide circle that will keep updating its position to the right.
//@version=5
indicator("")
n = bar_index
barsTillEnd = last_bar_index - n
if ta.change(chart.left_visible_bar_time ) or
ta.change(chart.right_visible_bar_time)
n := bar_index
createOuterCircle(radius) =>
var int end = na
var int start = na
var basis = 0.
barsFromNearestEdgeCircle = 0.
barsTillEndFromCircleStart = radius
startCylce = barsTillEnd % barsTillEndFromCircleStart == 0 // start circle
bars = ta.barssince(startCylce)
barsFromNearestEdgeCircle := barsTillEndFromCircleStart -1
basis := math.min(startCylce ? -1 : basis + 1 / barsFromNearestEdgeCircle * 2, 1) // 0 -> 1
shape = math.sqrt(1 - basis * basis)
rad = radius / 2
isOK = barsTillEnd <= barsTillEndFromCircleStart and barsTillEnd > 0
hi = isOK ? (rad + shape * radius) - rad : na
lo = isOK ? (rad - shape * radius) - rad : na
start := barsTillEnd == barsTillEndFromCircleStart ? n -1 : start
end := barsTillEnd == 0 ? start + radius : end
= createOuterCircle(40)
plot(h), plot(l)
🔶 LIMITATIONS
Due to the inability to draw between bars, from time to time, drawings can be slightly off.
Bar-replay can be demanding, since it has to reload on every bar progression. We don't recommend using this script on bar-replay. If you do, please choose the lowest speed and from time to time pause bar-replay for a second. You'll see the script gets reloaded.
🔶 SETTINGS
🔹 TICKERS
Toggle :
• Enabled -> uses the first column with a pre-filled list of Futures Open Interest tickers/symbols
• Disabled -> uses the empty field where you can enter your own ticker/symbol
Pre-filled list : the first column is filled with a list, so you can choose your open interest easily, otherwise you would see COT:088691_F_OI aka Gold Futures Open Interest for example.
If applicable, you will see 3 different COT data:
• COT: Legacy Commitments of Traders report data
• COT2: Disaggregated Commitments of Traders report data
• COT3: Traders in Financial Futures report data
Empty field : When needed, you can pick another ticker/symbol in the empty field at the right and disable the toggle.
Timeframe : Commitments of Traders (COT) data is tallied by the Commodity Futures Trading Commission (CFTC) and is published weekly. Therefore data won't change every day.
Default set TF is Daily
🔹 STYLE
From middle:
• Enabled (default): Drawings start from the middle circle -> towards outer circle is + %change , towards middle of the circle is - %change
• Disabled: Drawings start from the middle POINT of the circle, towards outer circle is + OR -
-> in both options, + %change will be coloured green , - %change will be coloured red .
-> 0 %change will be coloured blue , and when no data is available, this will be coloured gray .
Size circle : options tiny, small, normal, large, huge.
Angle : Only applicable if "From middle" is disabled!
-> sets the angle of the spike:
Show Ticker : Name of ticker, as seen in table, will be added to labels.
Text - fill
• Sets colour for +/- %change
Table
• Sets 2 text colours, size and position
Circles
• Sets the colour of circles, style can be changed in the Style section.
You can make it as crazy as you want:
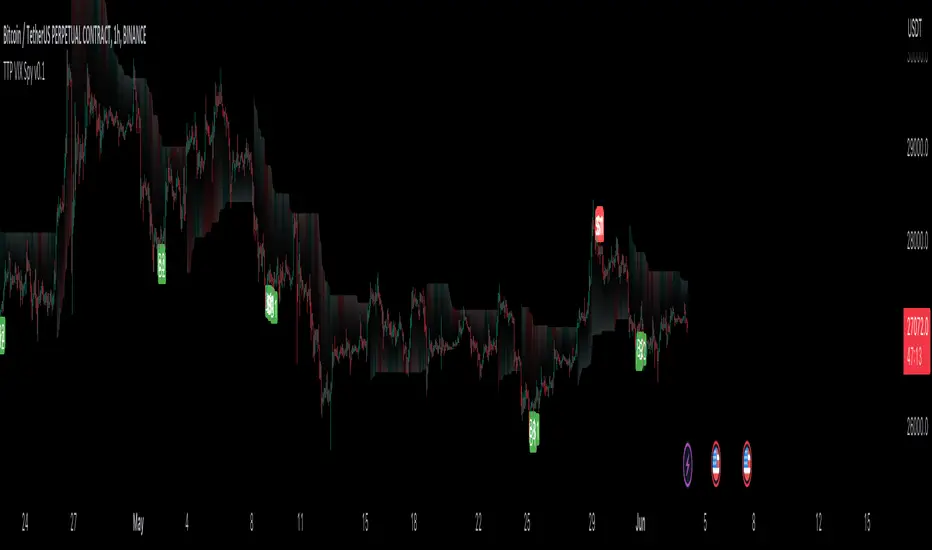
TTP VIX SpyTTP VIX Spy is an indicator that uses data from TVC:VIX to better time entries in the market.
The assumption used is that when the VIX is coming down from the top of its range then the risk on assets can move to the upside and when the VIX is is pushing higher there's a high likelihood or risk on assets going down.
This indicator observes the momentum of VIX using MACD. It offers two different signals both for longs and shorts: signal 1 and 2.
Signal 1 is activate when the begging of a new trend for the VIX is confirmed.
Signal 2 is activated when the VIX pulls back from an extreme value.
You can configure the parameters of the internal super trend and the look back for the slope applied to price and RSIs.
The indicator offers the following filter parameters:
- Price RSI slope: it filters signals that have RSI slope pointing in the opposite direction of the signal.
- Counter trend: it filters signals that are not counter trending super trend.
- Wide BBW: it filters signals that happen when there hasn't been high price volatility
- Price slope: it filters signals when the price is not pointing in the direction of the signal (buy: up, sell: down)
- VIX RSI filter: it filters VIX RSI values overextended. MACD can be in the right range, but sometimes RSI contradicts it. By default is OFF since it can cause false negatives.
- Working days only: it filters signals that occur in the weekend.
The colours below the price action show how the VIX momentum is changing. Transitions from red into pink and then green show how the fear is fading which tends to lead to lead to bullish moves, and the opposite when the transitions are from green to red.
Performance and initial thoughts.
I have tried VIX Spy on both BINANCE:BTCUSDT.P and BINANCE:ETHUSDT.P and it seems to offer a decent win ratio. As you can see I had to add many filter to remove bad entries and left toggles available to decide which ones you want to use.
I tried the signal in the 4H, 1H and 15min with mixed results. I tend to incline for the results in the 1H.
VIX signal offers a backtestable stream and alerts both for signals 1 and 2.
Z-Score Probability IndicatorThis is the Z-Score Probability indicator. As many people like my original Z-Score indicator and have expressed more interest in the powers of the Z, I decided to make this indicator which shows additional powers of the Z-Score.
Z-Score is not only useful for measuring a ticker or any other variable’s distance from the mean, it is also useful to calculate general probability in a normal distribution set. Not only can it calculate probability in a dataset, but it can also calculate the variables within said dataset by using the Standard Deviation and the Mean of the dataset.
Using these 2 aspects of the Z-Score, you can, In principle, have an indicator that operates similar to Fibonacci retracement levels with the added bonus of being able to actually ascertain the realistic probability of said retracement.
Let’s take a look at an example:
This is a chart showing SPY on the daily timeframe. If we look at the current Z-Score level, we can see that SPY is pushing into the 2 to 3 Z-Score range. We can see two things from this:
1. We can see that a retracement to a Z-Score of 2 would correspond to a price of 425.26 based on the current dataset. And
2. We can see that the probability that SPY retraces to a Z-Score of 2 is around 0.9800 or 98%.
To take it one step further, we can look at the various other variables in the distribution. If we were to bet on SPY retracing back to -1 SDs, that would correspond to a price of around 397.15, with a probability of around 0.1600 or 16% (see image below):
Let’s say, we thought SPY would go to $440. Well, we can see that the probability SPY goes to 434.64 currently is pretty low. How do we know? Because the Z-Score table shows us the probability of values falling BELOW that Z-score level in the current distribution. So if we look at this example below:
We can see that 0.9998 or roughly 99% of values in the current SPY distribution will fall below 434.64. Thus, it may be unrealistic, at this point in time, to target said value.
So what is a Z-Score Table?
Well, I need to disclose/clarify that the Z-Score Table being displayed in this indicator does Z-Score probability a HUGE injustice. However, with the constraints what is realistic to fit into an indicator, I had to make it far more succinct. Let’s take a look at an actual Z-Score Table below:
Above is a look an the actual Z-Score table. How it works is you first identify you’re Z-Score and then find the corresponding value that relates to your score. The number displayed in the dataset represents the number of variables in the dataset/density distribution that fall BELOW that particular Z-score.
So, for example, if we have a Z-Score of -2.31, we can consult that table, go to the -2.3 then scroll across to the 0.01 to represent -2.31. We would see that this Z-Score corresponds to a 0.0104 probability zone (or essentially 1%) indicating that the majority of the variables in the distribution fall below that mean Z-score. In terms of tickers and stocks, that would mean it would theoretically be “overbought”.
So what does the indicator Z-Table tell us?
I have averaged out the data for the purposes of this indicator. However, you can also reference a manual Z-Table to get the exact probability for the current precise Z-Score. However, the reality is it doesn’t necessarily matter to be exact when it comes to tickers. The reason being, ticker’s are in constant flux, and by the time you identify that probability, the ticker will already be at a different level. So generalizations are okay in these circumstances, you just need to get the “gist” of where the distribution lies.
So how do I use the indicator?
Using the indicator is pretty straightforward. Once launched, you will see the current Z-Score of the ticker, the current levels based on the distribution and the summarized Z-Table.
The Z-Table will turn gray to indicate the zone the ticker is currently in. In this case, we can see that SPY currently is in the 2 SD Zone, meaning that 0.98 or 98% of the current dataset being shown falls below the price we are at:
When we launch the settings, we can see a few inputs.
Lookback Length: This determines the number of candles back we want to calculate the distribution for. It is defaulted to 75, but you can adjust it to whichever length you want.
SMA Length: The SMA is optional but defaults to on. If you want to see the smoothed trend of the Z-Score, this will do the trick. It does not need to be set to the same
length as the Z-Score lookback. Thus, if you want a more or less responsive SMA with, say, a larger dataset, then you can reduce the SMA length yourself.
Distribution Probability Fills: This simply colour codes the distribution zones / probability zones on the indicator.
Show Z-Table: This will display the summarized Z-Table.
Show SMA: As I indicated, the SMA is optional, you can toggle it on or off to see the overall Z-Score trend.
Concluding Remarks:
And that my friends is the Z-Score Probability Indicator.
I hope you all enjoy it and find it helpful. As always leave your comments, questions and suggestions below.
Safe trades to all and take care!
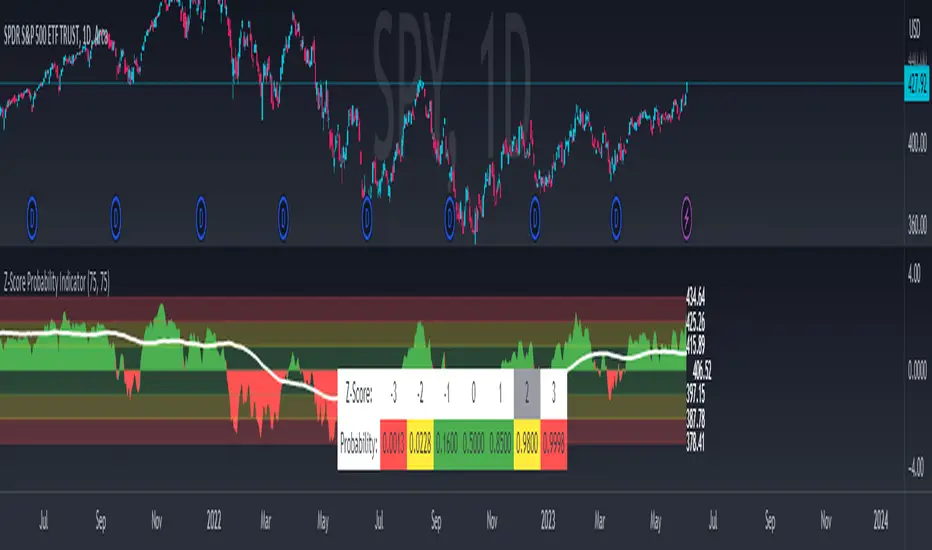
Textmate Language for Pine Script v5 2023-05Updated Syntax Colouring to include UDT and methods and libraries, and a few other extras.
Remember to Update when new built in language features are introduced.
This will not be Maintained frequently, it's an update to present times
Interactive Motive Wave ChecklistHere is an interactive tool that can be used for learning a bit about Elliott Waves
🎲 How it works?
The script upon load asks users to enter 6 pivots in an order. Once all 6 pivots are selected on the interactive chart, the script will calculate if the structure is a valid motive wave.
When you load the script, you will see a prompt on the chart to select points on the chart to form 6 pivots.
When you select the 6 pivots, the checklists are populated on the chart to notify users which conditions for qualifying the selection has passed and which of them are failed.
🎲 Conditions for Motive Wave
Motive wave can be either Impulse or Diagonal Wave. Diagonal wave can be either expanding or contracting diagonals. To learn more about diagonal waves, please go through this idea.
Rules for generic motive waves are as below
Pivots in order - Checks wether the pivots selected are in progressive order.
Directions in order - Checks if the pivot directions are correct - either PH, PL, PH, PL, PH, PL or PL, PH, PL, PH, PL, PH
Wave 2 never moves beyond the start of wave 1 - Wave 2 retracement is less than 100% of wave1
Wave 3 always moves beyond the end of wave 1 - Wave 3 retracement is more than 100% of wave2
Wave 3 is never the shortest one - Checks if Wave 3 is bigger than either Wave 1 or wave 5 or both.
Now, these are the specific rules for Impulse Waves on top of Motive Wave conditions
Wave 4 never moves beyond the end of Wave 1 - meaning wave 1 and wave 4 never overlap on price scale.
Wave 1, 3, 5 are all not extended. We check for retracement ratios of more than 200% to be considered as extended wave.
Below are the conditions for Diagonal Waves on top of Motive Wave conditions
Wave4 never moves beyond the start of Wave 3 - Wave 4 retracement is less than 100%
Wave 4 always ends within the price territory of Wave 1 - Unlike impulse wave, wave 4 intersects with wave 1 in case of diagonal waves. This is the major difference between impulse and diagonal wave.
Waves are progressively expanding or contracting - Wave1 > Wave3 > Wave5 and Wave2 > Wave4 to be contracting diagonal. Wave1 < Wave3 < Wave5 and Wave2 < Wave4 to be expanding diagonal wave.
Here is an example of diagonal wave projection
Here is an example of impulse wave projection
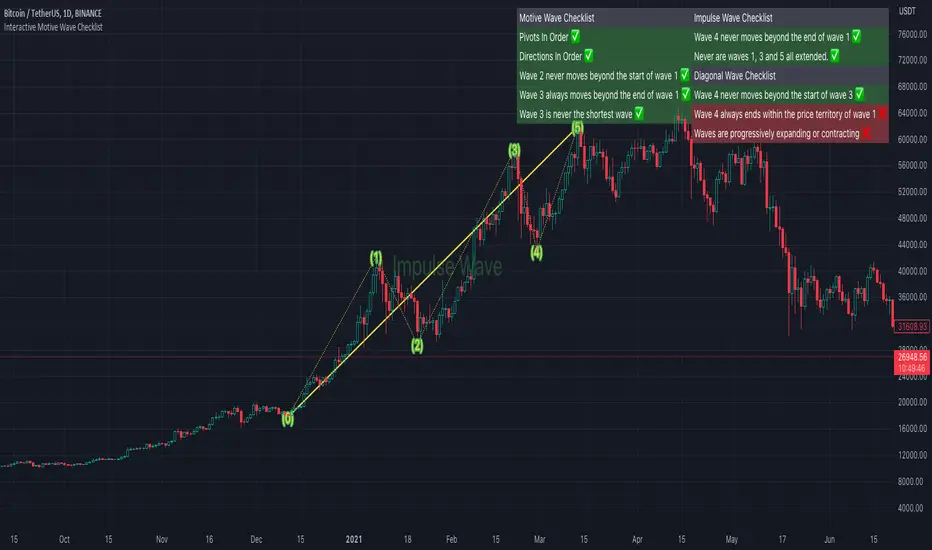
Anchored VWAP Pinch & Handoff, Intervals, and Signals"Anchored VWAP Pinch & Handoff, Intervals, and Signals" is an AVWAP toolbox for those who like to use various VWAP trading techniques. The indicator is currently comprised of the following three sections:
• The Pinch & Handoff section (shown above on chart) allows manually setting an upper and lower AVWAP (Pinch) along with an additional AVWAP (Handoff) by entering dates or by dragging the vertical anchor lines to the desired significant events on chart. Each of these three AVWAPs can also be set to show zones above and/or below by a percentage or standard deviation amount. The theory behind this method is that the upper and lower AVWAPs may act as dynamic support and resistance levels, effectively creating a price range or channel. As price moves between these two VWAP levels, it becomes squeezed or consolidated within that range. Further conjecture is that the longer the price remains within the range of the two anchored VWAP values, the higher the potential for an explosive breakout. Traders using this strategy may interpret the prolonged consolidation as a period of price compression, with the expectation that a significant move in either direction is likely to occur. Traders employing the AVWAP Pinch strategy might look for specific chart patterns or additional confirmation signals to enter a trade. For example, a breakout above the upper anchored VWAP level could trigger a long trade, while a breakdown below the lower anchored VWAP level could signal a short trade. Stop-loss orders and profit targets are typically set based on the trader's risk tolerance and the volatility of the asset. The third AVWAP (Handoff) is typically set after price has broken through the Pinch, and is used as a new level of support or resistance. The "Pinch & Handoff" phrase is believed to have been coined by Brian Shannon, who has popularized this method.
• The Intervals section (shown above on chart) is comprised of six periodic AVWAPs which cyclically reset. Their default settings are 1 Day, 2 Days, 1 Week, 1 Month, 1 Quarter, and 1 Year. They each may be set to desired period and when they are enabled the VWAPs whose periods are lower than the current chart timeframe are automatically hidden. For example a 1 Day AVWAP is not useful on a 1 Week chart so it would be hidden from that timeframe. When using AVWAPs from higher timeframes it may be helpful to set your chart to "Scale price chart only". This can be enabled by right clicking on your chart's price column and then left clicking "Scale price chart only" to enable that option.
• The Auto section (shown above on chart) is comprised of two automatic Anchored VWAPs. There are choices for setting anchors automatically based upon Highest Source, Highest Volume, Lowest Source, Lowest Volume, Pivot High, and Pivot Low. Because these two VWAPs work retroactively they are drawn with lines instead of plots. There is currently a limitation of 500 lines that may be drawn at any given time and the logic within this indicator uses a line for every bar of VWAP that is drawn, so if the combined length of both of these VWAPs exceeds 500 bars the earliest lines would disappear. For typical use of looking for the highest high in the last 50 bars or the last fractal this limitation should not be an issue.
---
All of the plots have been titled including hidden plots that are generated for the AVWAP line drawings. All of the various types of AVWAP within the indicator should be available as choices within the Alert creation dialog if use of alerts is desired.
---
NOTICE: This is an example script and not meant to be used as an actual strategy. By using this script or any portion thereof, you acknowledge that you have read and understood that this is for research purposes only and I am not responsible for any financial losses you may incur by using this script!
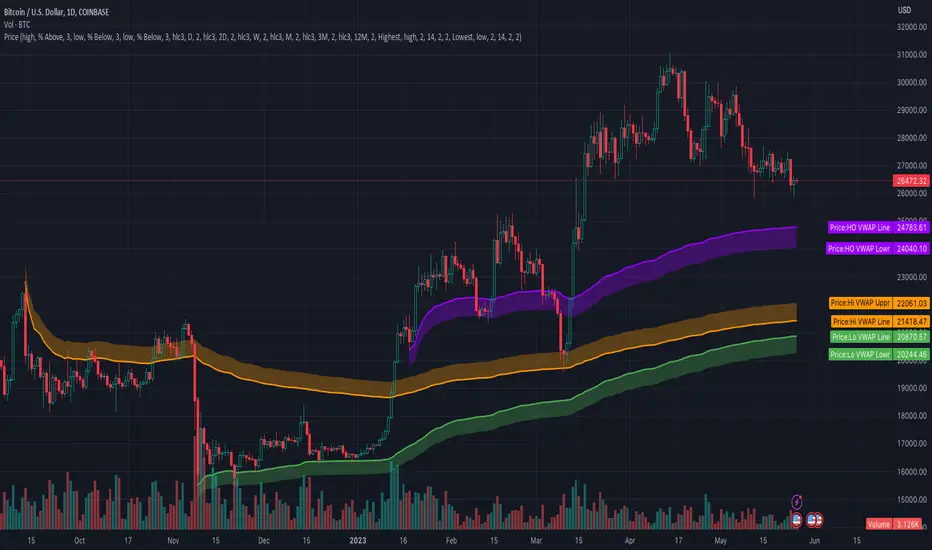
Kernel Regression ToolkitThis toolkit provides filters and extra functionality for non-repainting Nadaraya-Watson estimator implementations made by @jdehorty. For the sake of ease I have nicknamed it "kreg". Filters include a smoothing formula and zero lag formula. The purpose of this script is to help traders test, experiment and develop different regression lines. Regression lines are best used as trend lines and can be an invaluable asset for quickly locating first pullbacks and breaks of trends.
Other features include two J lines and a blend line. J lines are featured in tools like Stochastic KDJ. The formula uses the distance between K and D lines to make the J line. The blend line adds the ability to blend two lines together. This can be useful for several tasks including finding a center/median line between two lines or for blending in the characteristics of a different line. Default is set to 50 which is a 50% blend of the two lines. This can be increased and decreased to taste. This tool can be overlaid on the chart or on top of another indicator if you set the source. It can even be moved into its own window to create a unique oscillator based on whatever sources you feed it.
Below are the standard settings for the kernel estimation as documented by @jdehorty:
Lookback Window: The number of bars used for the estimation. This is a sliding value that represents the most recent historical bars. Recommended range: 3-50
Weighting: Relative weighting of time frames. As this value approaches zero, the longer time frames will exert more influence on the estimation. As this value approaches infinity, the behavior of the Rational Quadratic Kernel will become identical to the Gaussian kernel. Recommended range: 0.25-25
Level: Bar index on which to start regression. Controls how tightly fit the kernel estimate is to the data. Smaller values are a tighter fit. Larger values are a looser fit. Recommended range: 2-25
Lag: Lag for crossover detection. Lower values result in earlier crossovers. Recommended range: 1-2
For more information on this technique refer to to the original open source indicator by @jdehorty located here:
Vector3Library "Vector3"
Representation of 3D vectors and points.
This structure is used to pass 3D positions and directions around. It also contains functions for doing common vector operations.
Besides the functions listed below, other classes can be used to manipulate vectors and points as well.
For example the Quaternion and the Matrix4x4 classes are useful for rotating or transforming vectors and points.
___
**Reference:**
- github.com
- github.com
- github.com
- www.movable-type.co.uk
- docs.unity3d.com
- referencesource.microsoft.com
- github.com
\
new(x, y, z)
Create a new `Vector3`.
Parameters:
x (float) : `float` Property `x` value, (optional, default=na).
y (float) : `float` Property `y` value, (optional, default=na).
z (float) : `float` Property `z` value, (optional, default=na).
Returns: `Vector3` Generated new vector.
___
**Usage:**
```
.new(1.1, 1, 1)
```
from(value)
Create a new `Vector3` from a single value.
Parameters:
value (float) : `float` Properties positional value, (optional, default=na).
Returns: `Vector3` Generated new vector.
___
**Usage:**
```
.from(1.1)
```
from_Array(values, fill_na)
Create a new `Vector3` from a list of values, only reads up to the third item.
Parameters:
values (float ) : `array` Vector property values.
fill_na (float) : `float` Parameter value to replace missing indexes, (optional, defualt=na).
Returns: `Vector3` Generated new vector.
___
**Notes:**
- Supports any size of array, fills non available fields with `na`.
___
**Usage:**
```
.from_Array(array.from(1.1, fill_na=33))
.from_Array(array.from(1.1, 2, 3))
```
from_Vector2(values)
Create a new `Vector3` from a `Vector2`.
Parameters:
values (Vector2 type from RicardoSantos/CommonTypesMath/1) : `Vector2` Vector property values.
Returns: `Vector3` Generated new vector.
___
**Usage:**
```
.from:Vector2(.Vector2.new(1, 2.0))
```
___
**Notes:**
- Type `Vector2` from CommonTypesMath library.
from_Quaternion(values)
Create a new `Vector3` from a `Quaternion`'s `x, y, z` properties.
Parameters:
values (Quaternion type from RicardoSantos/CommonTypesMath/1) : `Quaternion` Vector property values.
Returns: `Vector3` Generated new vector.
___
**Usage:**
```
.from_Quaternion(.Quaternion.new(1, 2, 3, 4))
```
___
**Notes:**
- Type `Quaternion` from CommonTypesMath library.
from_String(expression, separator, fill_na)
Create a new `Vector3` from a list of values in a formated string.
Parameters:
expression (string) : `array` String with the list of vector properties.
separator (string) : `string` Separator between entries, (optional, default=`","`).
fill_na (float) : `float` Parameter value to replace missing indexes, (optional, defualt=na).
Returns: `Vector3` Generated new vector.
___
**Notes:**
- Supports any size of array, fills non available fields with `na`.
- `",,"` Empty fields will be ignored.
___
**Usage:**
```
.from_String("1.1", fill_na=33))
.from_String("(1.1,, 3)") // 1.1 , 3.0, NaN // empty field will be ignored!!
```
back()
Create a new `Vector3` object in the form `(0, 0, -1)`.
Returns: `Vector3` Generated new vector.
___
**Usage:**
```
.back()
```
front()
Create a new `Vector3` object in the form `(0, 0, 1)`.
Returns: `Vector3` Generated new vector.
___
**Usage:**
```
.front()
```
up()
Create a new `Vector3` object in the form `(0, 1, 0)`.
Returns: `Vector3` Generated new vector.
___
**Usage:**
```
.up()
```
down()
Create a new `Vector3` object in the form `(0, -1, 0)`.
Returns: `Vector3` Generated new vector.
___
**Usage:**
```
.down()
```
left()
Create a new `Vector3` object in the form `(-1, 0, 0)`.
Returns: `Vector3` Generated new vector.
___
**Usage:**
```
.left()
```
right()
Create a new `Vector3` object in the form `(1, 0, 0)`.
Returns: `Vector3` Generated new vector.
___
**Usage:**
```
.right()
```
zero()
Create a new `Vector3` object in the form `(0, 0, 0)`.
Returns: `Vector3` Generated new vector.
___
**Usage:**
```
.zero()
```
one()
Create a new `Vector3` object in the form `(1, 1, 1)`.
Returns: `Vector3` Generated new vector.
___
**Usage:**
```
.one()
```
minus_one()
Create a new `Vector3` object in the form `(-1, -1, -1)`.
Returns: `Vector3` Generated new vector.
___
**Usage:**
```
.minus_one()
```
unit_x()
Create a new `Vector3` object in the form `(1, 0, 0)`.
Returns: `Vector3` Generated new vector.
___
**Usage:**
```
.unit_x()
```
unit_y()
Create a new `Vector3` object in the form `(0, 1, 0)`.
Returns: `Vector3` Generated new vector.
___
**Usage:**
```
.unit_y()
```
unit_z()
Create a new `Vector3` object in the form `(0, 0, 1)`.
Returns: `Vector3` Generated new vector.
___
**Usage:**
```
.unit_z()
```
nan()
Create a new `Vector3` object in the form `(na, na, na)`.
Returns: `Vector3` Generated new vector.
___
**Usage:**
```
.nan()
```
random(max, min)
Generate a vector with random properties.
Parameters:
max (Vector3 type from RicardoSantos/CommonTypesMath/1) : `Vector3` Maximum defined range of the vector properties.
min (Vector3 type from RicardoSantos/CommonTypesMath/1) : `Vector3` Minimum defined range of the vector properties.
Returns: `Vector3` Generated new vector.
___
**Usage:**
```
.random(.from(math.pi), .from(-math.pi))
```
random(max)
Generate a vector with random properties (min set to 0.0).
Parameters:
max (Vector3 type from RicardoSantos/CommonTypesMath/1) : `Vector3` Maximum defined range of the vector properties.
Returns: `Vector3` Generated new vector.
___
**Usage:**
```
.random(.from(math.pi))
```
method copy(this)
Copy a existing `Vector3`
Namespace types: TMath.Vector3
Parameters:
this (Vector3 type from RicardoSantos/CommonTypesMath/1) : `Vector3` Source vector.
Returns: `Vector3` Generated new vector.
___
**Usage:**
```
a = .one().copy()
```
method i_add(this, other)
Modify a instance of a vector by adding a vector to it.
Namespace types: TMath.Vector3
Parameters:
this (Vector3 type from RicardoSantos/CommonTypesMath/1) : `Vector3` Source vector.
other (Vector3 type from RicardoSantos/CommonTypesMath/1) : `Vector3` Other Vector.
Returns: `Vector3` Updated source vector.
___
**Usage:**
```
a = .from(1) , a.i_add(.up())
```
method i_add(this, value)
Modify a instance of a vector by adding a vector to it.
Namespace types: TMath.Vector3
Parameters:
this (Vector3 type from RicardoSantos/CommonTypesMath/1) : `Vector3` Source vector.
value (float) : `float` Value.
Returns: `Vector3` Updated source vector.
___
**Usage:**
```
a = .from(1) , a.i_add(3.2)
```
method i_subtract(this, other)
Modify a instance of a vector by subtracting a vector to it.
Namespace types: TMath.Vector3
Parameters:
this (Vector3 type from RicardoSantos/CommonTypesMath/1) : `Vector3` Source vector.
other (Vector3 type from RicardoSantos/CommonTypesMath/1) : `Vector3` Other Vector.
Returns: `Vector3` Updated source vector.
___
**Usage:**
```
a = .from(1) , a.i_subtract(.down())
```
method i_subtract(this, value)
Modify a instance of a vector by subtracting a vector to it.
Namespace types: TMath.Vector3
Parameters:
this (Vector3 type from RicardoSantos/CommonTypesMath/1) : `Vector3` Source vector.
value (float) : `float` Value.
Returns: `Vector3` Updated source vector.
___
**Usage:**
```
a = .from(1) , a.i_subtract(3)
```
method i_multiply(this, other)
Modify a instance of a vector by multiplying a vector with it.
Namespace types: TMath.Vector3
Parameters:
this (Vector3 type from RicardoSantos/CommonTypesMath/1) : `Vector3` Source vector.
other (Vector3 type from RicardoSantos/CommonTypesMath/1) : `Vector3` Other Vector.
Returns: `Vector3` Updated source vector.
___
**Usage:**
```
a = .from(1) , a.i_multiply(.left())
```
method i_multiply(this, value)
Modify a instance of a vector by multiplying a vector with it.
Namespace types: TMath.Vector3
Parameters:
this (Vector3 type from RicardoSantos/CommonTypesMath/1) : `Vector3` Source vector.
value (float) : `float` value.
Returns: `Vector3` Updated source vector.
___
**Usage:**
```
a = .from(1) , a.i_multiply(3)
```
method i_divide(this, other)
Modify a instance of a vector by dividing it by another vector.
Namespace types: TMath.Vector3
Parameters:
this (Vector3 type from RicardoSantos/CommonTypesMath/1) : `Vector3` Source vector.
other (Vector3 type from RicardoSantos/CommonTypesMath/1) : `Vector3` Other Vector.
Returns: `Vector3` Updated source vector.
___
**Usage:**
```
a = .from(1) , a.i_divide(.forward())
```
method i_divide(this, value)
Modify a instance of a vector by dividing it by another vector.
Namespace types: TMath.Vector3
Parameters:
this (Vector3 type from RicardoSantos/CommonTypesMath/1) : `Vector3` Source vector.
value (float) : `float` Value.
Returns: `Vector3` Updated source vector.
___
**Usage:**
```
a = .from(1) , a.i_divide(3)
```
method i_mod(this, other)
Modify a instance of a vector by modulo assignment with another vector.
Namespace types: TMath.Vector3
Parameters:
this (Vector3 type from RicardoSantos/CommonTypesMath/1) : `Vector3` Source vector.
other (Vector3 type from RicardoSantos/CommonTypesMath/1) : `Vector3` Other Vector.
Returns: `Vector3` Updated source vector.
___
**Usage:**
```
a = .from(1) , a.i_mod(.back())
```
method i_mod(this, value)
Modify a instance of a vector by modulo assignment with another vector.
Namespace types: TMath.Vector3
Parameters:
this (Vector3 type from RicardoSantos/CommonTypesMath/1) : `Vector3` Source vector.
value (float) : `float` Value.
Returns: `Vector3` Updated source vector.
___
**Usage:**
```
a = .from(1) , a.i_mod(3)
```
method i_pow(this, exponent)
Modify a instance of a vector by modulo assignment with another vector.
Namespace types: TMath.Vector3
Parameters:
this (Vector3 type from RicardoSantos/CommonTypesMath/1) : `Vector3` Source vector.
exponent (Vector3 type from RicardoSantos/CommonTypesMath/1) : `Vector3` Exponent Vector.
Returns: `Vector3` Updated source vector.
___
**Usage:**
```
a = .from(1) , a.i_pow(.up())
```
method i_pow(this, exponent)
Modify a instance of a vector by modulo assignment with another vector.
Namespace types: TMath.Vector3
Parameters:
this (Vector3 type from RicardoSantos/CommonTypesMath/1) : `Vector3` Source vector.
exponent (float) : `float` Exponent Value.
Returns: `Vector3` Updated source vector.
___
**Usage:**
```
a = .from(1) , a.i_pow(2)
```
method length_squared(this)
Squared length of the vector.
Namespace types: TMath.Vector3
Parameters:
this (Vector3 type from RicardoSantos/CommonTypesMath/1)
Returns: `float` The squared length of this vector.
___
**Usage:**
```
a = .one().length_squared()
```
method magnitude_squared(this)
Squared magnitude of the vector.
Namespace types: TMath.Vector3
Parameters:
this (Vector3 type from RicardoSantos/CommonTypesMath/1) : `Vector3` Source vector.
Returns: `float` The length squared of this vector.
___
**Usage:**
```
a = .one().magnitude_squared()
```
method length(this)
Length of the vector.
Namespace types: TMath.Vector3
Parameters:
this (Vector3 type from RicardoSantos/CommonTypesMath/1) : `Vector3` Source vector.
Returns: `float` The length of this vector.
___
**Usage:**
```
a = .one().length()
```
method magnitude(this)
Magnitude of the vector.
Namespace types: TMath.Vector3
Parameters:
this (Vector3 type from RicardoSantos/CommonTypesMath/1) : `Vector3` Source vector.
Returns: `float` The Length of this vector.
___
**Usage:**
```
a = .one().magnitude()
```
method normalize(this, magnitude, eps)
Normalize a vector with a magnitude of 1(optional).
Namespace types: TMath.Vector3
Parameters:
this (Vector3 type from RicardoSantos/CommonTypesMath/1) : `Vector3` Source vector.
magnitude (float) : `float` Value to manipulate the magnitude of normalization, (optional, default=1.0).
eps (float)
Returns: `Vector3` Generated new vector.
___
**Usage:**
```
a = .new(33, 50, 100).normalize() // (x=0.283, y=0.429, z=0.858)
a = .new(33, 50, 100).normalize(2) // (x=0.142, y=0.214, z=0.429)
```
method to_String(this, precision)
Converts source vector to a string format, in the form `"(x, y, z)"`.
Namespace types: TMath.Vector3
Parameters:
this (Vector3 type from RicardoSantos/CommonTypesMath/1) : `Vector3` Source vector.
precision (string) : `string` Precision format to apply to values (optional, default='').
Returns: `string` Formated string in a `"(x, y, z)"` format.
___
**Usage:**
```
a = .one().to_String("#.###")
```
method to_Array(this)
Converts source vector to a array format.
Namespace types: TMath.Vector3
Parameters:
this (Vector3 type from RicardoSantos/CommonTypesMath/1) : `Vector3` Source vector.
Returns: `array` List of the vector properties.
___
**Usage:**
```
a = .new(1, 2, 3).to_Array()
```
method to_Vector2(this)
Converts source vector to a Vector2 in the form `x, y`.
Namespace types: TMath.Vector3
Parameters:
this (Vector3 type from RicardoSantos/CommonTypesMath/1) : `Vector3` Source vector.
Returns: `Vector2` Generated new vector.
___
**Usage:**
```
a = .from(1).to_Vector2()
```
method to_Quaternion(this, w)
Converts source vector to a Quaternion in the form `x, y, z, w`.
Namespace types: TMath.Vector3
Parameters:
this (Vector3 type from RicardoSantos/CommonTypesMath/1) : `Vector3` Sorce vector.
w (float) : `float` Property of `w` new value.
Returns: `Quaternion` Generated new vector.
___
**Usage:**
```
a = .from(1).to_Quaternion(w=1)
```
method add(this, other)
Add a vector to source vector.
Namespace types: TMath.Vector3
Parameters:
this (Vector3 type from RicardoSantos/CommonTypesMath/1) : `Vector3` Source vector.
other (Vector3 type from RicardoSantos/CommonTypesMath/1) : `Vector3` Other vector.
Returns: `Vector3` Generated new vector.
___
**Usage:**
```
a = .from(1).add(.unit_z())
```
method add(this, value)
Add a value to each property of the vector.
Namespace types: TMath.Vector3
Parameters:
this (Vector3 type from RicardoSantos/CommonTypesMath/1) : `Vector3` Source vector.
value (float) : `float` Value.
Returns: `Vector3` Generated new vector.
___
**Usage:**
```
a = .from(1).add(2.0)
```
add(value, other)
Add each property of a vector to a base value as a new vector.
Parameters:
value (float) : `float` Value.
other (Vector3 type from RicardoSantos/CommonTypesMath/1) : `Vector3` Vector.
Returns: `Vector3` Generated new vector.
___
**Usage:**
```
a = .from(2) , b = .add(1.0, a)
```
method subtract(this, other)
Subtract vector from source vector.
Namespace types: TMath.Vector3
Parameters:
this (Vector3 type from RicardoSantos/CommonTypesMath/1) : `Vector3` Source vector.
other (Vector3 type from RicardoSantos/CommonTypesMath/1) : `Vector3` Other vector.
Returns: `Vector3` Generated new vector.
___
**Usage:**
```
a = .from(1).subtract(.left())
```
method subtract(this, value)
Subtract a value from each property in source vector.
Namespace types: TMath.Vector3
Parameters:
this (Vector3 type from RicardoSantos/CommonTypesMath/1) : `Vector3` Source vector.
value (float) : `float` Value.
Returns: `Vector3` Generated new vector.
___
**Usage:**
```
a = .from(1).subtract(2.0)
```
subtract(value, other)
Subtract each property in a vector from a base value and create a new vector.
Parameters:
value (float) : `float` Value.
other (Vector3 type from RicardoSantos/CommonTypesMath/1) : `Vector3` Vector.
Returns: `Vector3` Generated new vector.
___
**Usage:**
```
a = .subtract(1.0, .right())
```
method multiply(this, other)
Multiply a vector by another.
Namespace types: TMath.Vector3
Parameters:
this (Vector3 type from RicardoSantos/CommonTypesMath/1) : `Vector3` Source vector.
other (Vector3 type from RicardoSantos/CommonTypesMath/1) : `Vector3` Other vector.
Returns: `Vector3` Generated new vector.
___
**Usage:**
```
a = .from(1).multiply(.up())
```
method multiply(this, value)
Multiply each element in source vector with a value.
Namespace types: TMath.Vector3
Parameters:
this (Vector3 type from RicardoSantos/CommonTypesMath/1) : `Vector3` Source vector.
value (float) : `float` Value.
Returns: `Vector3` Generated new vector.
___
**Usage:**
```
a = .from(1).multiply(2.0)
```
multiply(value, other)
Multiply a value with each property in a vector and create a new vector.
Parameters:
value (float) : `float` Value.
other (Vector3 type from RicardoSantos/CommonTypesMath/1) : `Vector3` Vector.
Returns: `Vector3` Generated new vector.
___
**Usage:**
```
a = .multiply(1.0, .new(1, 2, 1))
```
method divide(this, other)
Divide a vector by another.
Namespace types: TMath.Vector3
Parameters:
this (Vector3 type from RicardoSantos/CommonTypesMath/1) : `Vector3` Source vector.
other (Vector3 type from RicardoSantos/CommonTypesMath/1) : `Vector3` Other vector.
Returns: `Vector3` Generated new vector.
___
**Usage:**
```
a = .from(1).divide(.from(2))
```
method divide(this, value)
Divide each property in a vector by a value.
Namespace types: TMath.Vector3
Parameters:
this (Vector3 type from RicardoSantos/CommonTypesMath/1) : `Vector3` Source vector.
value (float) : `float` Value.
Returns: `Vector3` Generated new vector.
___
**Usage:**
```
a = .from(1).divide(2.0)
```
divide(value, other)
Divide a base value by each property in a vector and create a new vector.
Parameters:
value (float) : `float` Value.
other (Vector3 type from RicardoSantos/CommonTypesMath/1) : `Vector3` Vector.
Returns: `Vector3` Generated new vector.
___
**Usage:**
```
a = .divide(1.0, .from(2))
```
method mod(this, other)
Modulo a vector by another.
Namespace types: TMath.Vector3
Parameters:
this (Vector3 type from RicardoSantos/CommonTypesMath/1) : `Vector3` Source vector.
other (Vector3 type from RicardoSantos/CommonTypesMath/1) : `Vector3` Other vector.
Returns: `Vector3` Generated new vector.
___
**Usage:**
```
a = .from(1).mod(.from(2))
```
method mod(this, value)
Modulo each property in a vector by a value.
Namespace types: TMath.Vector3
Parameters:
this (Vector3 type from RicardoSantos/CommonTypesMath/1) : `Vector3` Source vector.
value (float) : `float` Value.
Returns: `Vector3` Generated new vector.
___
**Usage:**
```
a = .from(1).mod(2.0)
```
mod(value, other)
Modulo a base value by each property in a vector and create a new vector.
Parameters:
value (float) : `float` Value.
other (Vector3 type from RicardoSantos/CommonTypesMath/1) : `Vector3` Vector.
Returns: `Vector3` Generated new vector.
___
**Usage:**
```
a = .mod(1.0, .from(2))
```
method negate(this)
Negate a vector in the form `(zero - this)`.
Namespace types: TMath.Vector3
Parameters:
this (Vector3 type from RicardoSantos/CommonTypesMath/1) : `Vector3` Source vector.
Returns: `Vector3` Generated new vector.
___
**Usage:**
```
a = .one().negate()
```
method pow(this, other)
Modulo a vector by another.
Namespace types: TMath.Vector3
Parameters:
this (Vector3 type from RicardoSantos/CommonTypesMath/1) : `Vector3` Source vector.
other (Vector3 type from RicardoSantos/CommonTypesMath/1) : `Vector3` Other vector.
Returns: `Vector3` Generated new vector.
___
**Usage:**
```
a = .from(2).pow(.from(3))
```
method pow(this, exponent)
Raise the vector elements by a exponent.
Namespace types: TMath.Vector3
Parameters:
this (Vector3 type from RicardoSantos/CommonTypesMath/1) : `Vector3` Source vector.
exponent (float) : `float` The exponent to raise the vector by.
Returns: `Vector3` Generated new vector.
___
**Usage:**
```
a = .from(1).pow(2.0)
```
pow(value, exponent)
Raise value into a vector raised by the elements in exponent vector.
Parameters:
value (float) : `float` Base value.
exponent (Vector3 type from RicardoSantos/CommonTypesMath/1) : `Vector3` The exponent to raise the vector of base value by.
Returns: `Vector3` Generated new vector.
___
**Usage:**
```
a = .pow(1.0, .from(2))
```
method sqrt(this)
Square root of the elements in a vector.
Namespace types: TMath.Vector3
Parameters:
this (Vector3 type from RicardoSantos/CommonTypesMath/1) : `Vector3` Source vector.
Returns: `Vector3` Generated new vector.
___
**Usage:**
```
a = .from(1).sqrt()
```
method abs(this)
Absolute properties of the vector.
Namespace types: TMath.Vector3
Parameters:
this (Vector3 type from RicardoSantos/CommonTypesMath/1) : `Vector3` Source vector.
Returns: `Vector3` Generated new vector.
___
**Usage:**
```
a = .from(1).abs()
```
method max(this)
Highest property of the vector.
Namespace types: TMath.Vector3
Parameters:
this (Vector3 type from RicardoSantos/CommonTypesMath/1) : `Vector3` Source vector.
Returns: `float` Highest value amongst the vector properties.
___
**Usage:**
```
a = .new(1, 2, 3).max()
```
method min(this)
Lowest element of the vector.
Namespace types: TMath.Vector3
Parameters:
this (Vector3 type from RicardoSantos/CommonTypesMath/1) : `Vector3` Source vector.
Returns: `float` Lowest values amongst the vector properties.
___
**Usage:**
```
a = .new(1, 2, 3).min()
```
method floor(this)
Floor of vector a.
Namespace types: TMath.Vector3
Parameters:
this (Vector3 type from RicardoSantos/CommonTypesMath/1) : `Vector3` Source vector.
Returns: `Vector3` Generated new vector.
___
**Usage:**
```
a = .new(1.33, 1.66, 1.99).floor()
```
method ceil(this)
Ceil of vector a.
Namespace types: TMath.Vector3
Parameters:
this (Vector3 type from RicardoSantos/CommonTypesMath/1) : `Vector3` Source vector.
Returns: `Vector3` Generated new vector.
___
**Usage:**
```
a = .new(1.33, 1.66, 1.99).ceil()
```
method round(this)
Round of vector elements.
Namespace types: TMath.Vector3
Parameters:
this (Vector3 type from RicardoSantos/CommonTypesMath/1) : `Vector3` Source vector.
Returns: `Vector3` Generated new vector.
___
**Usage:**
```
a = .new(1.33, 1.66, 1.99).round()
```
method round(this, precision)
Round of vector elements to n digits.
Namespace types: TMath.Vector3
Parameters:
this (Vector3 type from RicardoSantos/CommonTypesMath/1) : `Vector3` Source vector.
precision (int) : `int` Number of digits to round the vector elements.
Returns: `Vector3` Generated new vector.
___
**Usage:**
```
a = .new(1.33, 1.66, 1.99).round(1) // 1.3, 1.7, 2
```
method fractional(this)
Fractional parts of vector.
Namespace types: TMath.Vector3
Parameters:
this (Vector3 type from RicardoSantos/CommonTypesMath/1) : `Vector3` Source vector.
Returns: `Vector3` Generated new vector.
___
**Usage:**
```
a = .from(1.337).fractional() // 0.337
```
method dot_product(this, other)
Dot product of two vectors.
Namespace types: TMath.Vector3
Parameters:
this (Vector3 type from RicardoSantos/CommonTypesMath/1) : `Vector3` Source vector.
other (Vector3 type from RicardoSantos/CommonTypesMath/1) : `Vector3` Other vector.
Returns: `float` Dot product.
___
**Usage:**
```
a = .from(2).dot_product(.left())
```
method cross_product(this, other)
Cross product of two vectors.
Namespace types: TMath.Vector3
Parameters:
this (Vector3 type from RicardoSantos/CommonTypesMath/1) : `Vector3` Source vector.
other (Vector3 type from RicardoSantos/CommonTypesMath/1) : `Vector3` Other vector.
Returns: `Vector3` Generated new vector.
___
**Usage:**
```
a = .from(1).cross_produc(.right())
```
method scale(this, scalar)
Scale vector by a scalar value.
Namespace types: TMath.Vector3
Parameters:
this (Vector3 type from RicardoSantos/CommonTypesMath/1) : `Vector3` Source vector.
scalar (float) : `float` Value to scale the the vector by.
Returns: `Vector3` Generated new vector.
___
**Usage:**
```
a = .from(1).scale(2)
```
method rescale(this, magnitude)
Rescale a vector to a new magnitude.
Namespace types: TMath.Vector3
Parameters:
this (Vector3 type from RicardoSantos/CommonTypesMath/1) : `Vector3` Source vector.
magnitude (float) : `float` Value to manipulate the magnitude of normalization.
Returns: `Vector3` Generated new vector.
___
**Usage:**
```
a = .from(20).rescale(1)
```
method equals(this, other)
Compares two vectors.
Namespace types: TMath.Vector3
Parameters:
this (Vector3 type from RicardoSantos/CommonTypesMath/1) : `Vector3` Source vector.
other (Vector3 type from RicardoSantos/CommonTypesMath/1) : `Vector3` Other vector.
Returns: `Vector3` Generated new vector.
___
**Usage:**
```
a = .from(1).equals(.one())
```
method sin(this)
Sine of vector.
Namespace types: TMath.Vector3
Parameters:
this (Vector3 type from RicardoSantos/CommonTypesMath/1) : `Vector3` Source vector.
Returns: `Vector3` Generated new vector.
___
**Usage:**
```
a = .from(1).sin()
```
method cos(this)
Cosine of vector.
Namespace types: TMath.Vector3
Parameters:
this (Vector3 type from RicardoSantos/CommonTypesMath/1) : `Vector3` Source vector.
Returns: `Vector3` Generated new vector.
___
**Usage:**
```
a = .from(1).cos()
```
method tan(this)
Tangent of vector.
Namespace types: TMath.Vector3
Parameters:
this (Vector3 type from RicardoSantos/CommonTypesMath/1) : `Vector3` Source vector.
Returns: `Vector3` Generated new vector.
___
**Usage:**
```
a = .from(1).tan()
```
vmax(a, b)
Highest elements of the properties from two vectors.
Parameters:
a (Vector3 type from RicardoSantos/CommonTypesMath/1) : `Vector3` Vector.
b (Vector3 type from RicardoSantos/CommonTypesMath/1) : `Vector3` Vector.
Returns: `Vector3` Generated new vector.
___
**Usage:**
```
a = .vmax(.one(), .from(2))
```
vmax(a, b, c)
Highest elements of the properties from three vectors.
Parameters:
a (Vector3 type from RicardoSantos/CommonTypesMath/1) : `Vector3` Vector.
b (Vector3 type from RicardoSantos/CommonTypesMath/1) : `Vector3` Vector.
c (Vector3 type from RicardoSantos/CommonTypesMath/1) : `Vector3` Vector.
Returns: `Vector3` Generated new vector.
___
**Usage:**
```
a = .vmax(.new(0.1, 2.5, 3.4), .from(2), .from(3))
```
vmin(a, b)
Lowest elements of the properties from two vectors.
Parameters:
a (Vector3 type from RicardoSantos/CommonTypesMath/1) : `Vector3` Vector.
b (Vector3 type from RicardoSantos/CommonTypesMath/1) : `Vector3` Vector.
Returns: `Vector3` Generated new vector.
___
**Usage:**
```
a = .vmin(.one(), .from(2))
```
vmin(a, b, c)
Lowest elements of the properties from three vectors.
Parameters:
a (Vector3 type from RicardoSantos/CommonTypesMath/1) : `Vector3` Vector.
b (Vector3 type from RicardoSantos/CommonTypesMath/1) : `Vector3` Vector.
c (Vector3 type from RicardoSantos/CommonTypesMath/1) : `Vector3` Vector.
Returns: `Vector3` Generated new vector.
___
**Usage:**
```
a = .vmin(.one(), .from(2), .new(3.3, 2.2, 0.5))
```
distance(a, b)
Distance between vector `a` and `b`.
Parameters:
a (Vector3 type from RicardoSantos/CommonTypesMath/1) : `Vector3` Source vector.
b (Vector3 type from RicardoSantos/CommonTypesMath/1) : `Vector3` Target vector.
Returns: `Vector3` Generated new vector.
___
**Usage:**
```
a = distance(.from(3), .unit_z())
```
clamp(a, min, max)
Restrict a vector between a min and max vector.
Parameters:
a (Vector3 type from RicardoSantos/CommonTypesMath/1) : `Vector3` Source vector.
min (Vector3 type from RicardoSantos/CommonTypesMath/1) : `Vector3` Minimum boundary vector.
max (Vector3 type from RicardoSantos/CommonTypesMath/1) : `Vector3` Maximum boundary vector.
Returns: `Vector3` Generated new vector.
___
**Usage:**
```
a = .clamp(a=.new(2.9, 1.5, 3.9), min=.from(2), max=.new(2.5, 3.0, 3.5))
```
clamp_magnitude(a, radius)
Vector with its magnitude clamped to a radius.
Parameters:
a (Vector3 type from RicardoSantos/CommonTypesMath/1) : `Vector3` Source vector.object, vector with properties that should be restricted to a radius.
radius (float) : `float` Maximum radius to restrict magnitude of vector.
Returns: `Vector3` Generated new vector.
___
**Usage:**
```
a = .clamp_magnitude(.from(21), 7)
```
lerp_unclamped(a, b, rate)
`Unclamped` linearly interpolates between provided vectors by a rate.
Parameters:
a (Vector3 type from RicardoSantos/CommonTypesMath/1) : `Vector3` Source vector.
b (Vector3 type from RicardoSantos/CommonTypesMath/1) : `Vector3` Target vector.
rate (float) : `float` Rate of interpolation, range(0 > 1) where 0 == source vector and 1 == target vector.
Returns: `Vector3` Generated new vector.
___
**Usage:**
```
a = .lerp_unclamped(.from(1), .from(2), 1.2)
```
lerp(a, b, rate)
Linearly interpolates between provided vectors by a rate.
Parameters:
a (Vector3 type from RicardoSantos/CommonTypesMath/1) : `Vector3` Source vector.
b (Vector3 type from RicardoSantos/CommonTypesMath/1) : `Vector3` Target vector.
rate (float) : `float` Rate of interpolation, range(0 > 1) where 0 == source vector and 1 == target vector.
Returns: `Vector3` Generated new vector.
___
**Usage:**
```
a = lerp(.one(), .from(2), 0.2)
```
herp(start, start_tangent, end, end_tangent, rate)
Hermite curve interpolation between provided vectors.
Parameters:
start (Vector3 type from RicardoSantos/CommonTypesMath/1) : `Vector3` Start vector.
start_tangent (Vector3 type from RicardoSantos/CommonTypesMath/1) : `Vector3` Start vector tangent.
end (Vector3 type from RicardoSantos/CommonTypesMath/1) : `Vector3` End vector.
end_tangent (Vector3 type from RicardoSantos/CommonTypesMath/1) : `Vector3` End vector tangent.
rate (int) : `float` Rate of the movement from `start` to `end` to get position, should be range(0 > 1).
Returns: `Vector3` Generated new vector.
___
**Usage:**
```
s = .new(0, 0, 0) , st = .new(0, 1, 1)
e = .new(1, 2, 2) , et = .new(-1, -1, 3)
h = .herp(s, st, e, et, 0.3)
```
___
**Reference:** en.m.wikibooks.org
herp_2(a, b, rate)
Hermite curve interpolation between provided vectors.
Parameters:
a (Vector3 type from RicardoSantos/CommonTypesMath/1) : `Vector3` Source vector.
b (Vector3 type from RicardoSantos/CommonTypesMath/1) : `Vector3` Target vector.
rate (Vector3 type from RicardoSantos/CommonTypesMath/1) : `Vector3` Rate of the movement per component from `start` to `end` to get position, should be range(0 > 1).
Returns: `Vector3` Generated new vector.
___
**Usage:**
```
h = .herp_2(.one(), .new(0.1, 3, 2), 0.6)
```
noise(a)
3D Noise based on Morgan McGuire @morgan3d
Parameters:
a (Vector3 type from RicardoSantos/CommonTypesMath/1) : `Vector3` Source vector.
Returns: `Vector3` Generated new vector.
___
**Usage:**
```
a = noise(.one())
```
___
**Reference:**
- thebookofshaders.com
- www.shadertoy.com
rotate(a, axis, angle)
Rotate a vector around a axis.
Parameters:
a (Vector3 type from RicardoSantos/CommonTypesMath/1) : `Vector3` Source vector.
axis (string) : `string` The plane to rotate around, `option="x", "y", "z"`.
angle (float) : `float` Angle in radians.
Returns: `Vector3` Generated new vector.
___
**Usage:**
```
a = .rotate(.from(3), 'y', math.toradians(45.0))
```
rotate_x(a, angle)
Rotate a vector on a fixed `x`.
Parameters:
a (Vector3 type from RicardoSantos/CommonTypesMath/1) : `Vector3` Source vector.
angle (float) : `float` Angle in radians.
Returns: `Vector3` Generated new vector.
___
**Usage:**
```
a = .rotate_x(.from(3), math.toradians(90.0))
```
rotate_y(a, angle)
Rotate a vector on a fixed `y`.
Parameters:
a (Vector3 type from RicardoSantos/CommonTypesMath/1) : `Vector3` Source vector.
angle (float) : `float` Angle in radians.
Returns: `Vector3` Generated new vector.
___
**Usage:**
```
a = .rotate_y(.from(3), math.toradians(90.0))
```
rotate_yaw_pitch(a, yaw, pitch)
Rotate a vector by yaw and pitch values.
Parameters:
a (Vector3 type from RicardoSantos/CommonTypesMath/1) : `Vector3` Source vector.
yaw (float) : `float` Angle in radians.
pitch (float) : `float` Angle in radians.
Returns: `Vector3` Generated new vector.
___
**Usage:**
```
a = .rotate_yaw_pitch(.from(3), math.toradians(90.0), math.toradians(45.0))
```
project(a, normal, eps)
Project a vector off a plane defined by a normal.
Parameters:
a (Vector3 type from RicardoSantos/CommonTypesMath/1) : `Vector3` Source vector.
normal (Vector3 type from RicardoSantos/CommonTypesMath/1) : `Vector3` The normal of the surface being reflected off.
eps (float) : `float` Minimum resolution to void division by zero (default=0.000001).
Returns: `Vector3` Generated new vector.
___
**Usage:**
```
a = .project(.one(), .down())
```
project_on_plane(a, normal, eps)
Projects a vector onto a plane defined by a normal orthogonal to the plane.
Parameters:
a (Vector3 type from RicardoSantos/CommonTypesMath/1) : `Vector3` Source vector.
normal (Vector3 type from RicardoSantos/CommonTypesMath/1) : `Vector3` The normal of the surface being reflected off.
eps (float) : `float` Minimum resolution to void division by zero (default=0.000001).
Returns: `Vector3` Generated new vector.
___
**Usage:**
```
a = .project_on_plane(.one(), .left())
```
project_to_2d(a, camera_position, camera_target)
Project a vector onto a two dimensions plane.
Parameters:
a (Vector3 type from RicardoSantos/CommonTypesMath/1) : `Vector3` Source vector.
camera_position (Vector3 type from RicardoSantos/CommonTypesMath/1) : `Vector3` Camera position.
camera_target (Vector3 type from RicardoSantos/CommonTypesMath/1) : `Vector3` Camera target plane position.
Returns: `Vector2` Generated new vector.
___
**Usage:**
```
a = .project_to_2d(.one(), .new(2, 2, 3), .zero())
```
reflect(a, normal)
Reflects a vector off a plane defined by a normal.
Parameters:
a (Vector3 type from RicardoSantos/CommonTypesMath/1) : `Vector3` Source vector.
normal (Vector3 type from RicardoSantos/CommonTypesMath/1) : `Vector3` The normal of the surface being reflected off.
Returns: `Vector3` Generated new vector.
___
**Usage:**
```
a = .reflect(.one(), .right())
```
angle(a, b, eps)
Angle in degrees between two vectors.
Parameters:
a (Vector3 type from RicardoSantos/CommonTypesMath/1) : `Vector3` Source vector.
b (Vector3 type from RicardoSantos/CommonTypesMath/1) : `Vector3` Target vector.
eps (float) : `float` Minimum resolution to void division by zero (default=1.0e-15).
Returns: `float` Angle value in degrees.
___
**Usage:**
```
a = .angle(.one(), .up())
```
angle_signed(a, b, axis)
Signed angle in degrees between two vectors.
Parameters:
a (Vector3 type from RicardoSantos/CommonTypesMath/1) : `Vector3` Source vector.
b (Vector3 type from RicardoSantos/CommonTypesMath/1) : `Vector3` Target vector.
axis (Vector3 type from RicardoSantos/CommonTypesMath/1) : `Vector3` Axis vector.
Returns: `float` Angle value in degrees.
___
**Usage:**
```
a = .angle_signed(.one(), .left(), .down())
```
___
**Notes:**
- The smaller of the two possible angles between the two vectors is returned, therefore the result will never
be greater than 180 degrees or smaller than -180 degrees.
- If you imagine the from and to vectors as lines on a piece of paper, both originating from the same point,
then the /axis/ vector would point up out of the paper.
- The measured angle between the two vectors would be positive in a clockwise direction and negative in an
anti-clockwise direction.
___
**Reference:**
- github.com
angle2d(a, b)
2D angle between two vectors.
Parameters:
a (Vector3 type from RicardoSantos/CommonTypesMath/1) : `Vector3` Source vector.
b (Vector3 type from RicardoSantos/CommonTypesMath/1) : `Vector3` Target vector.
Returns: `float` Angle value in degrees.
___
**Usage:**
```
a = .angle2d(.one(), .left())
```
transform_Matrix(a, M)
Transforms a vector by the given matrix.
Parameters:
a (Vector3 type from RicardoSantos/CommonTypesMath/1) : `Vector3` Source vector.
M (matrix) : `matrix` A 4x4 matrix. The transformation matrix.
Returns: `Vector3` Generated new vector.
___
**Usage:**
```
mat = matrix.new(4, 0)
mat.add_row(0, array.from(0.0, 0.0, 0.0, 1.0))
mat.add_row(1, array.from(0.0, 0.0, 1.0, 0.0))
mat.add_row(2, array.from(0.0, 1.0, 0.0, 0.0))
mat.add_row(3, array.from(1.0, 0.0, 0.0, 0.0))
b = .transform_Matrix(.one(), mat)
```
transform_M44(a, M)
Transforms a vector by the given matrix.
Parameters:
a (Vector3 type from RicardoSantos/CommonTypesMath/1) : `Vector3` Source vector.
M (M44 type from RicardoSantos/CommonTypesMath/1) : `M44` A 4x4 matrix. The transformation matrix.
Returns: `Vector3` Generated new vector.
___
**Usage:**
```
a = .transform_M44(.one(), .M44.new(0,0,0,1,0,0,1,0,0,1,0,0,1,0,0,0))
```
___
**Notes:**
- Type `M44` from `CommonTypesMath` library.
transform_normal_Matrix(a, M)
Transforms a vector by the given matrix.
Parameters:
a (Vector3 type from RicardoSantos/CommonTypesMath/1) : `Vector3` Source vector.
M (matrix) : `matrix` A 4x4 matrix. The transformation matrix.
Returns: `Vector3` Generated new vector.
___
**Usage:**
```
mat = matrix.new(4, 0)
mat.add_row(0, array.from(0.0, 0.0, 0.0, 1.0))
mat.add_row(1, array.from(0.0, 0.0, 1.0, 0.0))
mat.add_row(2, array.from(0.0, 1.0, 0.0, 0.0))
mat.add_row(3, array.from(1.0, 0.0, 0.0, 0.0))
b = .transform_normal_Matrix(.one(), mat)
```
transform_normal_M44(a, M)
Transforms a vector by the given matrix.
Parameters:
a (Vector3 type from RicardoSantos/CommonTypesMath/1) : `Vector3` Source vector.
M (M44 type from RicardoSantos/CommonTypesMath/1) : `M44` A 4x4 matrix. The transformation matrix.
Returns: `Vector3` Generated new vector.
___
**Usage:**
```
a = .transform_normal_M44(.one(), .M44.new(0,0,0,1,0,0,1,0,0,1,0,0,1,0,0,0))
```
___
**Notes:**
- Type `M44` from `CommonTypesMath` library.
transform_Array(a, rotation)
Transforms a vector by the given Quaternion rotation value.
Parameters:
a (Vector3 type from RicardoSantos/CommonTypesMath/1) : `Vector3` Source vector. The source vector to be rotated.
rotation (float ) : `array` A 4 element array. Quaternion. The rotation to apply.
Returns: `Vector3` Generated new vector.
___
**Usage:**
```
a = .transform_Array(.one(), array.from(0.2, 0.2, 0.2, 1.0))
```
___
**Reference:**
- referencesource.microsoft.com
transform_Quaternion(a, rotation)
Transforms a vector by the given Quaternion rotation value.
Parameters:
a (Vector3 type from RicardoSantos/CommonTypesMath/1) : `Vector3` Source vector. The source vector to be rotated.
rotation (Quaternion type from RicardoSantos/CommonTypesMath/1) : `array` A 4 element array. Quaternion. The rotation to apply.
Returns: `Vector3` Generated new vector.
___
**Usage:**
```
a = .transform_Quaternion(.one(), .Quaternion.new(0.2, 0.2, 0.2, 1.0))
```
___
**Notes:**
- Type `Quaternion` from `CommonTypesMath` library.
___
**Reference:**
- referencesource.microsoft.com
Intraday Intensity ModesIntraday Intensity Index was created by David Bostian and its use was later featured by John Bollinger in his book "Bollinger on Bollinger Bands" . It is categorically a volume indicator and considered to be a useful tool for analyzing supply and demand dynamics in the market. By measuring the level of buying and selling pressure within a given trading session it attempts to provide insights into the strength of market participants' interest and their aggressiveness in executing trades throughout the day. It can be used in conjunction with Bollinger Bands® or other envelope type indicators as a complimentary indicator to aid in trying to identify potential turning points or trends.
Intraday intensity is calculated based upon the relationship between the price change and the volume of shares traded during each daily interval. It aims to capture the level of buying or selling activity relative to the overall volume. A high intraday intensity value suggests a higher level of buying or selling pressure, indicating a more active and potentially volatile market. Conversely, a low intraday intensity value indicates less pronounced trading activity and a potentially quieter market. Overall, intraday intensity provides a concise description of the intensity of trading activity during a particular trading session, giving traders an additional perspective on market dynamics. Note that because the calculation uses volume this indicator will only work on symbols where volume is available.
While there are pre-existing versions within community scripts, none were found to have applied the calculations necessary for the various modes that are presented within this version, which are believed to be operating in the manner originally intended when first described by Bostian and again later by Bollinger. When operating in default modes on daily or lower chart timeframes the logic used within this script tracks the intraday high, low, close and volume for the day with each progressing intraday bar.
The BB indicator was included on the top main chart to help illustrate example usage as described below. The Intraday Intensity Modes indicator is pictured operating in three different modes beneath the main chart:
• The top pane beneath the main chart shows the indicator operating as a normalized 21 day II% oscillator. A potential use while in this mode would be to look for positive values as potential confirmation of strength when price tags the upper or lower Bollinger bands, and to look for negative values as potential confirmation of weakness when price tags the upper or lower Bollinger bands.
• The middle pane shows the indicator operating as an "open ended" cumulative sum of II. A potential use while in this mode would be to look for convergence or divergence of trend when price is making new highs or lows, or while price is walking the upper or lower Bollinger bands.
• The bottom pane shows the indicator operating in standard III mode, which provides independent values per session.
Indicator Settings: Inputs tab:
Osc Length : Set to 1 disables oscillation, values greater than 1 enables oscillation for II% (Intraday Intensity percent) mode.
Tootip : Hover mouse over (i) to show recommended example Settings for various modes.
Cumulative : When enabled values are cumulatively summed for the entire chart and indicator operates in II mode.
Normalized : When enabled a rolling window of Osc Length values are summed and normalized to the rolling window's volume.
Intrabar : When enabled price range and volume are evaluated for intensity per bar instead of per day which is a departure from the original
concept. Whenever this setting is enabled the indicator should be regarded as operating in an experimental mode.
Colors For Up Down : Sets the plot colors used, may be overridden in Settings:Style tab.
Styles / Width : Sets the plot style and width used, may be overridden in Settings:Style tab.
This indicator is designed to work with any chart timeframe, with the understanding that when used on timeframes higher than daily the indicator becomes "IntraPeriod" intensity, for example on weekly bars it would be "IntraWeek" intensity. On Daily or lower timeframes the indicator operates as "IntraDay" intensity and is being updated on each bar as each day progresses. If the experimental setting Intrabar is enabled then the indicator operates as "IntraBar" intensity and is no longer constrained to daily or higher evaluations, for example with Intrabar enabled on a 4H timeframe the indicator would operate as "Intra4H" intensity.
NOTICE: This is an example script and not meant to be used as an actual strategy. By using this script or any portion thereof, you acknowledge that you have read and understood that this is for research purposes only and I am not responsible for any financial losses you may incur by using this script!
