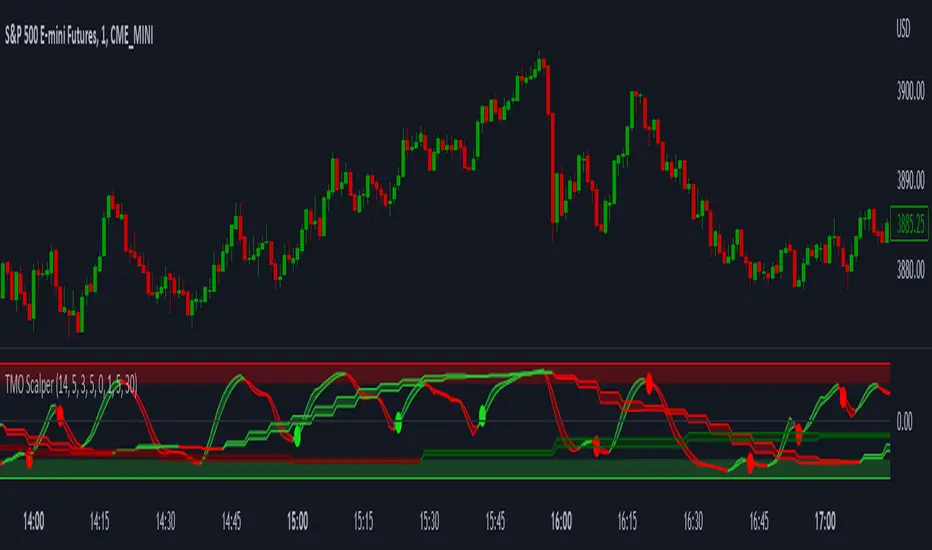
TMO ScalperTMO - (T)rue (M)omentum (O)scillator) MTF Scalper Version
TMO Scalper is a special custom version of the popular TMO Oscillator. Scalper version was designed specifically for the lower time frames (1-5min intraday scalps). This version prints in the signals directly on top of the oscillator only when the higher aggregations are aligned with the current aggregation (the big wheels must be spinning in order for a small wheel to spin). The scalper consist of three MTF TMO oscillators. First one is the one that plot signals (should be the fastest aggregation), second serves as a short term trend gauge (good rule of thumb is to us 2-5x of the chart time frame or the first aggregation). The third one (optional) is shaded in the background & should only serve as a trend gauge for the day (usually higher time frames 30min+).
Time Frames Preffered by Traders:
1. 1m / 5m / 30m - This one is perfect for catching the fastest moves. However, during choppy days the 1min can produce more false signals..
2. 2m / 10m / 30m - Healthy middle, the 2min aggregation nicely smooths out the 1min mess. Short term gauge is turning slowly (10min for a signal to confirm).
3. 3m / 30m / 60m - This TF is awesome for day traders that prefer to take it slow. Obviously, this combination will produce far less signals during the day.
Hope it helps.
Delta
MTF TMOTMO - (T)rue (M)omentum (O)scillator) MTF (Higher Aggregation) Version
TMO calculates momentum using the DELTA of price. Giving a much better picture of the trend, reversals & divergences than most momentum oscillators using price. Aside from the regular TMO, this study combines four different TMO aggregations into one indicator for an even better picture of the trend. Once you look deeper into this study you will realize how complex this tool is. This version also produce much more information like crosses, divergences, overbought / oversold signals, higher aggregation fades etc. It is probably not even possible to explain them all, there could easily be an entire e-book about this study.
I have been using this tool for a couple of years now, and this is what i have learned so far:
Favorite Time Frame Variations:
1. 1m / 5m / 30m - Great for intraday futures or options scalps. 30m TMO serves as the overall trend gauge for the day. 5min dictates the longer term intraday moves as well as direction of the 1min. 1min is for the scalps. When the 5min TMO is sloping higher focus should be on 1min buy signals (red to green cross) and vice versa for the 5min agg. sloping down.
2. 5m / 30m / 60m - Also an interesting variation for day trading the 3-5 min charts. Producing more cleaner & beginner-friendly signals that lasts couple of minutes instead of seconds.
3. 120m / Day / 2 Day - For the 30m to 1H or 2H timeframes. Daily & 2 Day dictates the overall trend. 120 min for the signals. Great for a multi-day swings.
4. Day / 2 Day / Week - Good for the daily charts, swing trading analysis as the weekly dictates the overall trend, daily dictates the signals and the 2 day cleans out the daily signals. If the daily & 2 day are not aligned togather, daily signal means nothing. Weekly dictates 2 day - 2 day dictates daily.
5. Week / Month / 3 Month - Same thing as the previous variation but for the weekly charts.
TMO Length:
The default vanilla settings are 14,5,3. Some traders prefer 21,5,3 as the TMO length is litle higher = TMO will potenially last little longer which could teoretically produce less false signals but slower crosses which means signals will lag more behind price. The lower the length, the faster the oscillator oscillates. It is the noice vs. the lag debate. The Length can be changed, but i would not personally touch the other two. Few points up or down on length will not drastically change much. But changes on Calc Length and Smooth Length can produce totally different signals from the original.
Tips & Tricks:
1. Observe
- This is the best tip & trick I can give you. The #1 best way to learn how any study operates is to just observe how it works in certain situations from the past. MTF TMO is not
an exception.
2. The Power of the Higher Aggregation
- The higher aggregation ALWAYS dictates the lower one. Best way to see this? Just 2x the current timeframe aggregation = so on daily chart, plot the daily & two day TMOs and you will notice how the higher agg. smooths out the current agg. The higher the aggregation is, the smoother (but slower) will the TMO turn. The real power kicks in when the 3 or 4 aggregations are aligned togather in one direction.
3. Position of the Higher Aggregation in Relation to the Extremes
- Overbought / oversold signals might not really work on the current aggregation. But pay attention to the higher aggregations in relation to the extremes. Ex: on the daily chart - daily TMO inside the OB / OS extremes might not mean much. But once the higher aggregations such as 3 day or Weekly TMO enters OB/OS zone togather with the daily, this can be a very powerful signal for a TMO reversion to the zeroline.
4. Crosses
- Yes, crosses do work. Personally, I never really focused on them. The thing about the crosses is that it is crucial to pick the right higher aggregation to the combination of the current one that would be reliable but also print enough signals. The closer the cross is to the OB / OS extremes, the more bigger move can occur. Crosses around the zero line can be considered as less quality crosses.
5. Divergences
- TMO can print awesome divergences. The best divergences are on the current aggregation (TMO agg. same as the chart) since the current agg. oscillates fast, it can usually produce lower lows & higher highs faster then any higher aggregations. Easy setup: wait for the higher aggregation to reach the OB / OS extremes and watch the current (chart) aggregation to print a divergence.
6. Three is Enough
- I personally find more than three aggregations messy and hard to read. But there is always the option to turn on the 4th one. Just switch the TMO 4 Main, TMO 4 Signal and TMO 4 Fill in the style settings.
Hope it helps.

Multi Type RSI [Misu]█ This Indicator is based on RSI ( Relative Strength Index ) & multiple type of MA (Moving Average) to show different variations of RSI.
The relative strength index (RSI) is a momentum indicator used in technical analysis to evaluate overvalued or undervalued conditions in the price of that security.
█ Usages:
The purpose of this indicator is to obtain the RSI calculated with different MAs modes instead of the classic RMA.
The red and green zones indicate the oversold and overbought zones.
Buy or sell signals are marked by the green and red circles
We have 2 different signal modes : when the different size RSIs cross and when the fast RSI crosses the extreme bands.
Alerts are setup.
█ Parameters:
Lenght RSI: The lenght of the RSI. (14 by default)
RSI MA Type: The type of MA with which the rsi will be calculated. ("SMA", "EMA", "SMMA (RMA)", "WMA", "VWMA")
Fast Lenght MA: The fast lenght smoothing MA.
Slow Lenght MA: The Slow lenght smoothing MA.
Lower Band: The lenght of the lower band. (25 by default)
Upper Band: The lenght of the upper band. (75 by default)
Signal Type: The mode with which buy and sell signals are triggered. ("Cross 2 Mas", "Cross Ma/Bands")

Realtime Volume Analysis ToolbarThis script displays an intrabar volume analysis in realtime
displayed data is the following
Total volume
Up volume
Down volume
Delta
Buyers %
More options will be added in the future, at least customization of the colors.
Binance Big Open Interest Delta Change v2 Note: This script will only work properly with Binance Futures symbols.
This script simply looks at the open interest for the symbol you are currently viewing and determines if a large change in open interest has occurred, which triggers a background color alert.
It does this by comparing the absolute value of the range of the current open interest bar with a simple average (length set by user) of the past x range. The user also determines what is considered a 'large' change in open interest by setting a multiplier with which the current range must exceed compared to the average range in order to trigger an alert.
If the change in open interest is an increase in OI, the alert is blue, and if the change in open interest is a decrease, the alert is orange.
The open interest ticker that is used for calculation is derived by adding the current ticker and "_OI" so that it auto changes each time you switch to a new Binance futures contract.
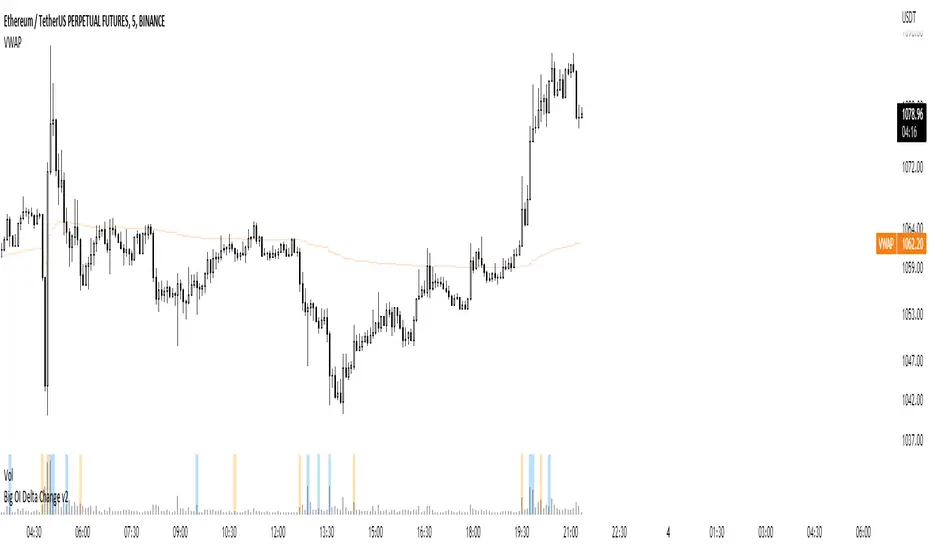
Singular and Cumulative Volume Delta (SVD+CVD)This a Volume Delta indicator with Cumulative Volume Delta.
I have been studying Volume Delta and CVD trading strategies and indicator styles.
This implementation was developed to test a basic trailing window / oscillator approach.
Script has been republished as public and searchable.
Changelog from private era follows.
Jun 9 (2022)
Release Notes:
Added option to use EMA/SMA based cumulation. This will not scale well with singular data, so default view is still SUM.
Jun 9 (2022)
Release Notes:
Outdated comment correction.
Jun 9 (2022)
Release Notes:
Added default option to normalilze visual scale of MA cumulation types. The averaging creates a singular value sized results, instead of a range-sums. This multiples that candle result by the range length to get a range-sum sized result.
Added option to scale the cumulation size relative to the volume size. 1-to-1 scaling creates singular deltas that can be hard to see with all options on. This allows you to beef them up for visual or weighting purposes.
Jun 15 (2022)
Release Notes: * Added break even level for current delta. Tells where current delta must land for cumulative delta to stay flat.
* Added comparison of historical cumulative levels to current level. The historical levels are the initial values going into current accumulation window.
* Changed title of indicator to be more generic, clear, and searchable.
Jun 15 (2022)
Release Notes: * Added option to have the cumulation cutoff line AFTER or OVER the end of the cumulation window. This change is to ensure the indicator clearly documents it's behavior and avoids confusion on this / last cumulation window semantics.
* Bugfix: Initial levels were pulled from cumulation line which was AFTER end of window. This has been changed to the initial values INSIDE the cumulation window.
* Code cleanup.
June 17th (2022)
Release Notes: Marked as beta because TV confirmed they no longer allow private scripts to be changed to public. (Despite lingering documentation that says otherwise.
June 17th (2022)
Re-published as public.

Educational LTF -> HTF volume deltaThis script shows 1 of several technique to gather volume delta
-> more explanation can be found in the script itself,
Cheers!

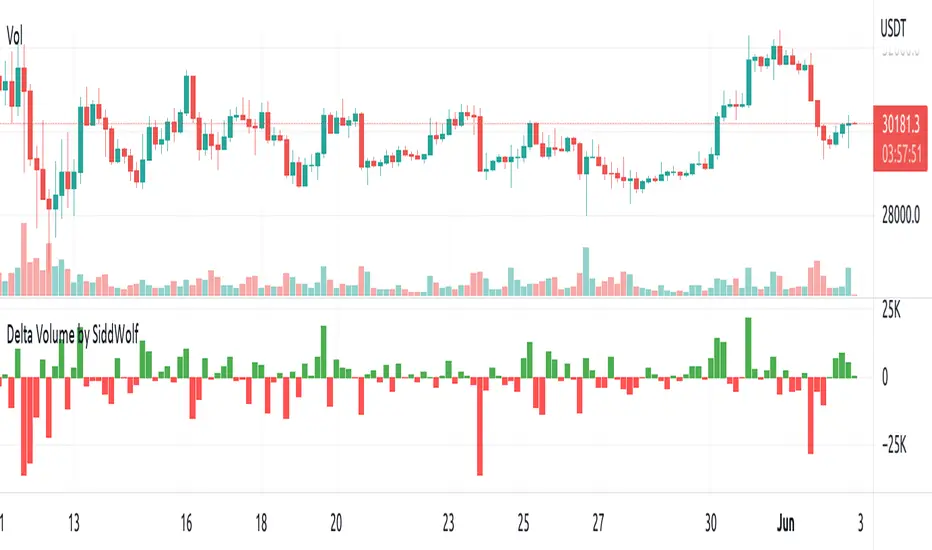
Delta Volume by SiddWolfDelta Volume is Difference between Buying Volume and Selling Volume. This indicator gives the Delta Volume based on Lower TimeFrame Candles. It utilizes security_lower_tf() function, a function that provides Lower TF candle data in Higher TF Chart.
security_lower_tf() is a new function provided by TradingView yesterday. If you are a PineScript Programmer, I suggest you to read about it, as it is a very powerful function that can extremely improve your trading strategy.
How this indicator works:
This indicator checks volume data on lower TimeFrame Candles and Shows it's delta in the current Chart Timeframe. For example: If you open 4 hours chart, this indicator checks volume of 1 minute chart and separates Buying-Selling volume. Then it subtracts Candle's Selling volume from Candle's Buying volume, finally calculating the Delta Volume.
This indicator also provides a Smooth Delta Volume, which is moving average of Delta Volume. As Delta Volume changes a lot, Smooth Delta Volume can be very helpful for identifying Trends . Goto settings and in "Show" section select "Smooth Delta Volume" to lay it on the chart.
Settings is the Key:
Settings are key to all of my indicators. Play around with it a bit. You can change what to show on the chart from settings. Smooth Delta Volume moving average length can be changed from the settings. You can also select "Show as Percentage", which shows Delta Volume as Percentage of Overall Candle's Volume. If you use Weekly or Monthly Timeframe, change increase lower timeframe from settings. Read the tooltips to understand what each settings mean. Tooltips are the (i) button in-front of each settings.
FAQs:
Q. Does the indicator Repaint ?
--- No. None of my indicators repaints. What you see now is what's drawn in real time.
Q. What TimeFrame is Best for this Indicator ?
--- It can be used on timeframes from 5 minutes to higher. But I would prefer to use it from timeframes higher than 30 minutes, as it gathers data from 1 minute TF.
Q. Indicator doesn't show anything ?
--- This indicator only works on security with Volume data. Also use it from higher timeframe than specified in Settings, because Volume Delta is calculated using Data from Lower TimeFrame.
Q. Delta volume is not provided by TradingView, So how exactly does this indicator work?
--- This indicator takes advantage of new pinescript function security_lower_tf(), and calculates volume for smaller timeframe data and calculates delta on higher timeframe.
Q. Does this indicator give financial advice?
--- No. Nope. Nein. Não. नहीं.
Conclusion:
This indicator is very basic but if used correctly it can be very powerful. If you have any questions or suggestions feel free to comment below. I'd love to connect with you. Thank you.
~ @SiddWolf
Heikin Ashi OscillatorThis indicator plots a delta between the Heiken Ashi close price and the regular candlestick closing price as a histogram, which allows you to quickly analyse changes in trend
direction.
It also provides a reverse-engineered closing price for regular candlesticks, to reach in order to maintain the momentum, which allows you to be forewarned of potential pivot points to change in bias in direction.
Feel free to use this indicator to modify and add to your charts as you wish.
Realtime FootprintThe purpose of this script is to gain a better understanding of the order flow by the footprint. To that end, i have added unusual features in addition to the standard features.
I use "Real Time 5D Profile by LucF" main engine to create basic footprint(profile type) and added some popular features and my favorites.
This script can only be used in realtime, because tradingview doesn't provide historical Bid/Ask date.
Bid/Ask date used this script are up/down ticks.
This script can only be used by time based chart (1m, 5m , 60m and daily etc)
This script use many labels and these are limited max 500, so you can't display many bars.
If you want to display foot print bars longer, turn off the unused sub-display function.
Default setting is footprint is 25 labels, IB count is 1, COT high and Ratio high is 1, COT low and Ratio low is 1 and Delta Box Ratio Volume is 1 , total 29.
plus UA , IB stripes , ladder fading mark use several labels.
///////// General Setting ///////////
Resets on Volume / Range bar
: If you want to use simple time based Resets on, please set Total Volume is 0.
Your timeframe is always the first condition. So if you set Total Volume is 1000, both conditions(Volume >= 1000 and your timeframe start next bar) must be met. (that is, new footprint bar doesn't start at when total volume = exactly 1000).
Ticks per row and Maximum row of Bar
: 1 is minimum size(tick). "Maximum row of Bar" decide the number of rows used in one footprint. 1 row is created from 1 label, so you need to reduce this number to display many footprints (Max label is 500).
Volume Filter and For Calculation and Display
: "Volume Filter" decide minimum size of using volume for this script.
"For Calculation and Display" is used to convert volume to an integer.
This script only use integer to make profile look better (I contained Bid number and Ask number in one row( one label) to saving labels. This require to make no difference in width by the number of digits and this script corresponds integers from 0 to 3 digits).
ex) Symbol average volume size is from 0.0001 to 0.001. You decide only use Volume >= 0.0005 by "Volume Filter".
Next, you convert volume to integer, by setting "For Calculation and Display" is 1000 (0.0005 * 1000 = 5).
If 0.00052 → 5.2 → 5, 0.00058 → 5.8 → 6 (Decimal numbers are rounded off)
This integer is used to all calculation in this script.
//////// Main Display ///////
Footprint, Total, Row Delta, Diagonal Delta and Profile
: "Footprint" display Ask and Bid per row. "Total" display Ask + Bid per row.
"Row Delta" display Ask - Bid per row. "Diagonal Delta" display Ask(row N) - Bid(row N -1) per row.
Profile display Total Volume(Ask + Bid) per row by using Block. Profile Block coloring are decided by Row Delta value(default: positive Row Delta (Ask > Bid) is greenish colors and negative Row Delta (Ask < Bid) is reddish colors.)
Volume per Profile Block, Row Imbalance Ratio and Delta Bull/Bear/Neutral Colors
: "Volume per Profile Block" decide one block contain how many total volume.
ex) When you set 20, Total volume 70 display 3 block.
The maximum number of blocks that can be used per low is 20.
So if you set 20, Total volume 400 is 20 blocks. total volume 800 is 20 blocks too.
"Row Imbalance Ratio" decide block coloring. The row imbalance is that the difference between Ask and Bid (row delta) is large.
default is x3, x2 and x1. The larger the difference, the brighter the color.
ex) Ask 30 Bid 10 is light green. Ask 20 Bid 10 is green. Ask 11 Bid 10 is dark green.
Ask 0 Bid 1 is light red. Ask 1 Bid 2 is red. ask 30 Bid 59 is dark green.
Ask 10 Bid 10 is neutral color(gray)
profile coloring is reflected same row's other elements(Ask, Bid, Total and Delta) too.
It's because one label can only use one text color.
/////// Sub Display ///////
Delta, total and Commitment of Traders
: "Delta" is total Ask - total Bid in one footprint bar. Total is total Ask + total Bid in one footprint bar.
"Commitment of traders" is variation of "Delta". COT High is reset to 0 when current highest is touched. COT Low is opposite.
Basic concept of Delta is to compare price with Delta. Ordinary, when price move up, delta is positive. Price move down is negative delta.
This is because market orders move price and market orders are counted by Delta (although this description is not exactly correct).
But, sometimes prices do not move even though many market orders are putting pressure on price , or conversely, price move strongly without many market orders.
This is key point. Big player absorb market orders by iceberg order(Subdivide large orders and pretend to be small limit orders.
Small limit orders look weak in the order book, but they are added each time you fill, so they are more powerful than they look.), so price don't move.
On the other hand, when the price is moving easily, smart players may be aiming to attract and counterattack to a better price for them.
It's more of a sport than science, and there's always no right response. Pay attention to the relationship between price, volume and delta.
ex) If COT Low is large negative value, it means many sell market orders is coming, but iceberg order is absorbing their attack at limit order.
you should not do buy entry, only this clue. but this is one of the hints.
"Delta, Box Ratio and Total texts is contained same label and its color are "Delta" coloring. Positive Delta is Delta Bull color(green),Negative Delta is Delta Bear Color
and Delta = 0 is Neutral Color(gray). When Delta direction and price direction are opposite is Delta Divergence Color(yellow).
I didn't add the cumulative volume delta because I prefer to display the CVD line on the price chart rather than the number.
Box Ratio , Box Ratio Divisor and Heavy Box Ratio Ratio
: This is not ordinary footprint features, but I like this concept so I added.
Box Ratio by Richard W. Arms is simple but useful tool. calculation is "total volume (one bar) divided by Bar range (highest - lowest)."
When Bull and bear are fighting fiercely this number become large, and then important price move happen.
I made average BR from something like 5 SMA and if current BR exceeds average BR x (Heavy Box Ratio Ratio), BR box mark will be filled.
Box Ratio Divisor is used to good looking display(BR multiplied by Box Ratio Divisor is rounded off and displayed as an integer)
Diagonal Imbalance Count , D IB Mark and D IB Stripes
: Diagonal Imbalance is defined by "Diagonal Imbalance Ratio".
ex) You set 2. When Ask(row N) 30 Bid(row N -1)10, it's 30 > 10*2, so positive Diagonal Imbalance.
When Ask(row N) 4 Bid(row N -1)9, it's 4*2 < 9, so negative Diagonal Imbalance.
This calculation does not use equals to avoid Ask(row N) 0 Bid(row N -1)0 became Diagonal Imbalance.
Ask(row N) 0 Bid(row N -1)0, it's 0 = 0*2, not Diagonal Imbalance. Ask(row N) 10 Bid(row N -1)5, it's 10 = 5*2, not Diagonal Imbalance.
"D IB Mark" emphasize Ask or Bid number which is dominant side(Winner of Diagonal Imbalance calculation), by under line.
"Diagonal Imbalance Count" compare Ask side D IB Mark to Bid side D IB Mark in one footprint.
Coloring depend on which is more aggressive side (it has many IB Mark) and When Aggressive direction and price direction are opposite is Delta Divergence Color(yellow).
"D IB Stripes" is a function that further emphasizes with an arrow Mark, when a DIB mark is added on the same side for three consecutive row. Three consecutive arrow is added at third row.
Unfinished Auction, Ratio Bounds and Ladder fading Mark
: "Unfinished Auction" emphasize highest or lowest row which has both Ask and Bid, by Delta Divergence Color(yellow) XXXXXX mark.
Unfinished Auction sometimes has magnet effect, price may touch and breakout at UA side in the future.
This concept is famous as profit taking target than entry decision.
But, I'm interested in the case that Big player make fake breakout at UA side and trapped retail traders, and then do reversal with retail traders stop-loss hunt.
Anyway, it's not stand alone signal.
"Ratio Bounds" gauge decrease of pressure at extreme price. Ratio Bounds High is number which second highest ask is divided by highest ask.
Ratio Bounds Low is number which second lowest bid is divided by lowest bid. The larger the number, the less momentum the price has.
ex)first footprint bar has Ratio Bounds Low 2, second footprint bar has RBL 4, third footprint bar has RBL 20.
This indicates that the bear's power is gradually diminishing.
"Ladder fading mark" emphasizes the decrease of the value in 3 consecutive row at extreme price. I added two type Marks.
Ask/Bid type(triangle Mark) is Ask/Bid values are decreasing of three consecutive row at extreme price.
Row Imbalance type(Diamond Mark) are row Imbalance values are decreasing of three consecutive row at extreme price.
ex)Third lowest Bid 40, second lowest Bid 10 and lowest Bid 5 have triangle up Mark. That is bear's power is gradually diminishing.
(This Mark only check Bid value at lowest price and Ask value at highest price).
Third highest row delta + 60, second highest row delta + 5, highest delta - 20 have diamond Mark. That is Bull's power is gradually diminishing.
Sub display use Delta colors at bottom of Sub display section.
////// Candle & POC /////////
candle and POC
: Ordinary, "POC" Point of Control is row of largest total volume, but this script'POC is volume weighted average.
This is because the regular POC was visually displayed by the profile ,and I was influenced LucF's ideas.
POC coloring is decided in relation to the previous POC. When current POC is higher than previous POC, color is UP Bar Color(green).
In the opposite case, Down Bar color is used.
POC Divergence Color is used when Current POC is up but current bar close is lower than open (Down price Bar),or in the opposite case.
POC coloring has option also highlight background by Delta Divergence Color(yellow). but bg color is displayed at your time frame current price bar not current footprint bar.
The basic explanation is over.
I add some image to promote understanding basic ideas.

Aggr. CDV / Delta Volume - InFinitoModified & Updated script from MARKET VOLUME by Ricardo M Arjona @XeL_Arjona that Includes Aggregated Volume, Delta Volume, Volume by Side
Aggregation code originally from Crypt0rus
Candle Plotting code from LonesomeTheBlue
***The indicator can be used for any coin/symbol to aggregate volume , but it has to be set up manually***
***The indicator can be used with specific symbol data only by disabling the aggregation option, which allows for it to be used on any symbol***
- Calculated based on Aggregated Volume instead of by symbol volume . Using aggregated data makes it more accurate and allows to compare volume flow between different kinds of markets (Spot, Futures , Perpetuals, Futures+Perpetuals and All Volume ).
- As well, in order to make the data as accurate as possible, the data from each exchange aggregated is normalized to report always in terms of 1 BTC . In case this indicator is used for another symbol, the calculations can be adjusted manually to make it always report data in terms of 1 contract/coin.
All Aggregated Volume By Side: Based of Xel_Arjona's calculation, buy and sell volume is estimated each period. This indicators can display both Buy Volume and Sell Volume for each period.
Aggregated Delta Volume By Side: Displays the difference between Buy & Sell Volume as Delta (Down if Sell Vol - Up if Buy Vol)
Aggregated Cumulative Delta Volume: Displays the sum of Delta Volume as a line, candles or Heiken Aishi Candles. Great for observing Volume Flow and spotting divergences
- It is Possible to add an MA to the CVD and to color fill in between the indicator and the MA
- It is possible to reset the indicators basis to 0 periodically

XBT Price DeltaCoinbase spot versus Bybit Perps Indicator
Red = Perps price above Spot price-Perps leading
Green = Spot price above Perps price-Spot Leading

OmegaDeltaExperimental:
- calculates the trajectory of every price change at each bar accordingly to the delta change on the next and so forth,
- the name is just a *pun* at the code☺☺☺
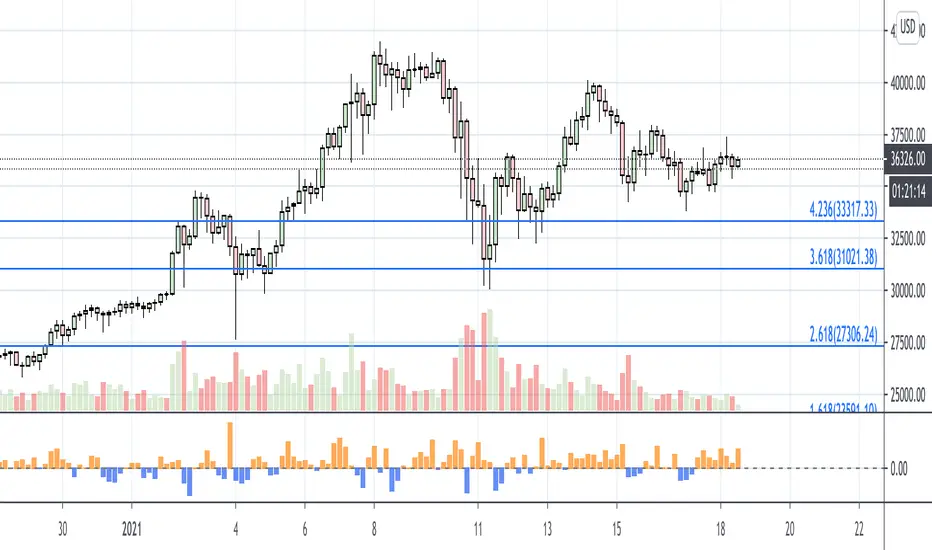
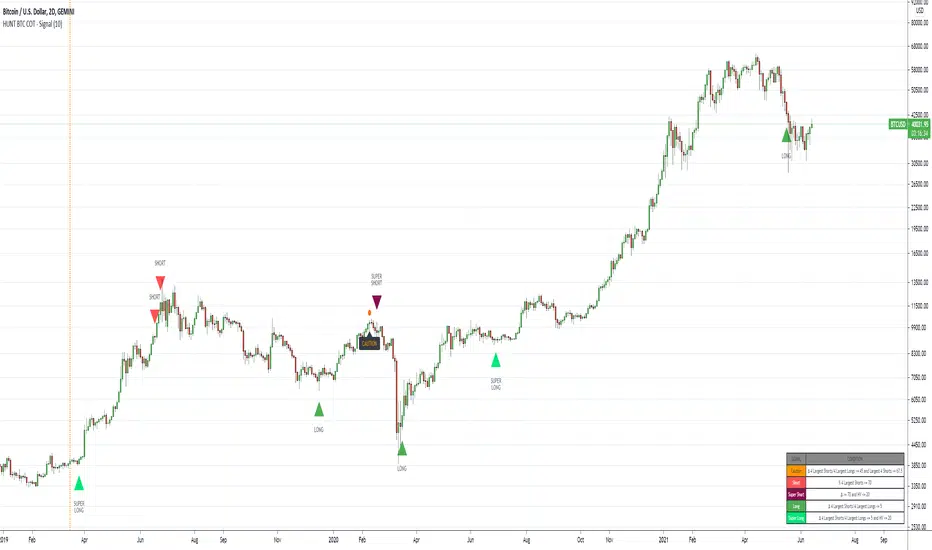
The Insider - Hunt Bitcoin CoT DeltaThe Insider - Hunt Bitcoin CoT Delta
The gift of the Squeeze in the Largest 4 open Interest Shorts vs Longs.
Why Bother another CoT signal?
Its different & focused on the Insider's.
Performance -
This Indicator provided a
1. Signal 1 = 26th March 2019 = SUPER LONG at $4,500 that saw a near $14,000 run up
2. Signal 2 = 18th & 24th June 2019 = SHORT at the second & final level $11,700 after repeated attempts & failure in the $13K range, the mini Echo Bitcoin Bull of 2019
3. Signal 3 = 17th December 2019 = LONG $6,900, Bitcoin rallied to Mid $10,500's
4. Signal 4 = 18th Feb 2020 = SUPER SHORT from $9,700's to a final extreme Low of $3,000, calling the CV-19 collapse
5. Signal 5 = 17th March 2020 = LONG from $5,400 no closure point yet
6. Signal 6 = 29th June 2020 = SUPER LONG reiterate from $10,700 no closure sell signal yet
7. Signal 7 = 17th May 2020 = LONG another accumulate LONG with no sell signal yet generated at Post H&S's low of $33,000
Note - This indicator only commences March 2019, as Bitcoin futures were a recent introduction and needed to settle for 6 months in both use and data, no signals were meaningful prior & data was light.
What is Provided. - Please note the need to also add the Hunt Bitcoin Historical Volatility Indicator for full understanding.
We provide 3 things with the 3 indicators.
'Insider' indications from Largest players in the futures market.
1. Bitcoin Macro Buy Signals.
a) The Bitcoin Commitment of Traders results see us focus solely on Largest 4 Short Open Interest & Largest 4 Long Open Interest aspects of the CoT Release data.
When the difference - is tight, a kind of pinch, these have been great Buy signals in Bitcoin.
We call this difference the Delta & When Delta is 5% or less Bitcoin is a Buy.
2. Bitcoin Macro Sells.
a) A sell signal is Triggered in Bitcoin at any point the Largest 4 short OI > or = to 70
3. AMPLIFIER Trade signals 'Super' Longs or Shorts -
Extreme low volatility events leads to highly impulsive & volatile subsequent moves, if either of 1 or 2 above occur, combined with extreme low volatility
a 'Super Long' or 'SUPER SELL' is generated. In the case of the short side, given Bitcoins general expansive and MACRO Bull trend since inception, we seek an additional component
that is an extreme differential/Delta reading between 4 biggest Longs & Shorts OI.
Namely CoT Delta also must be > 47.5%
We also have a Cautionary level, where it is not necessarily a good idea to accumulate Bitcon, as a better opportunity lower may avail itself, see conditions below.
So the required logic explicitly stated below for all Signals.
1. Long - Hunt Bitcoin CoT Delta < or = 5
2. SUPER Long - Hunt Bitcoin CoT Delta < or = 5; and 2 Day Historical Bitcoin Volatility = or < 20
3. Short - Largest 4 Sellers OI = or > 70
4. SUPER Short - Largest 4 Sellers OI = or > 70; AND..
Hunt Bitcoin CoT Delta = or > 47.5 AND 2 Day Historical BTC Volatility = or < 20
5. Caution - Largest 4 Sellers OI = or > 67.5 AND Hunt Bitcoin CoT Delta = or > 45
WARNING SEE Notes Below
Note 1 - = Largest 4 Open Interest Shorts
Note 2 - = Largest 4 Open Interest Longs
Note 3 - = Hunt Cot Delta = (Largest 4 sellers OI) -( Largest 4 Buyers OI)
Caution = Avoid new Bitcoin Accumulation Right Now, A sell signal might follow Enter on next Long
Note 4 - The Hunt Bitcoin COT Delta signal is a Largest 'Insider' Tracking tool based on a segment of Commitment of Traders data on Bitcoin Futures, released once a week on a Friday.
It is a Macro Timeframe signal , and should not be used for Day trading and Short Timeframe analysis , Entries may be optimised after a Hunt Bitcoin CoT Signal is generated by separate shorter Timeframe analysis.
Note 5 - The Historical Bitcoin Volatility is an additional 'Amplifier' component to the 'Hunt Bitcoin Cot Delta' Insider Signal
Note 6 - The Historical Bitcoin Volatility criteria varies by timeframe, the above levels are those applying on a Two Day TF Chart, select this custom timeframe in Trading View.
if additional criteria are met for LONG & SHORT insider signals, they may become 'Super Longs/Shorts', see conditions box above.

The Signal - Hunt Bitcoin CoT Buy/SellThe Signal - Hunt Bitcoin CoT Buy/Sell
Why Bother with another CoT signal?
Its different & focused on the Insider's. The Largest 4 Open Interest Seller and the Largest 4 open Interest Longs, plus the distance they are apart, the Delta, what does high percentage of Largest 4 sellers mean with a low 4 OI Buyers. , what when the usually higher Sellers are low and the largest 4 buyers almost the same value , Time to track the insiders Delta..
Performance -
This Indicator provided a
1. Signal 1 = 26th March 2019 = SUPER LONG at $4,500 that saw a near $14,000 run up
2. Signal 2 = 18th & 24th June 2019 = SHORT at the second & final level $11,700 after repeated attempts & failure in the $13K range, the mini Echo Bitcoin Bull of 2019
3. Signal 3 = 17th December 2019 = LONG $6,900, Bitcoin rallied to Mid $10,500's
4. Signal 4 = 18th Feb 2020 = SUPER SHORT from $9,700's to a final extreme Low of $3,000, calling the CV-19 collapse
5. Signal 5 = 17th March 2020 = LONG from $5,400 no closure point yet
6. Signal 6 = 29th June 2020 = SUPER LONG reiterate from $10,700 no closure sell signal yet
7. Signal 7 = 17th May 2020 = LONG another accumulate LONG with no sell signal yet generated at Post H&S's low of $33,000
Note - This indicator only commences March 2019, as Bitcoin futures were a recent introduction and needed to settle for 6 months in both use and data, no signals were meaningful prior & data was light.
What is Provided. - Please note the need to also add the Hunt Bitcoin Historical Volatility Indicator for full understanding.
We provide 3 things with the 3 indicators.
'Insider' indications from Largest players in the futures market.
1. Bitcoin Macro Buy Signals.
a) The Bitcoin Commitment of Traders results see us focus solely on Largest 4 Short Open Interest & Largest 4 Long Open Interest aspects of the CoT Release data.
When the difference - is tight, a kind of pinch, these have been great Buy signals in Bitcoin.
We call this difference the Delta & When Delta is 5% or less Bitcoin is a Buy.
2. Bitcoin Macro Sells.
a) A sell signal is Triggered in Bitcoin at any point the Largest 4 short OI > or = to 70
3. AMPLIFIER Trade signals 'Super' Longs or Shorts -
Extreme low volatility events leads to highly impulsive & volatile subsequent moves, if either of 1 or 2 above occur, combined with extreme low volatility
a 'Super Long' or 'SUPER SELL' is generated. In the case of the short side, given Bitcoins general expansive and MACRO Bull trend since inception, we seek an additional component
that is an extreme differential/Delta reading between 4 biggest Longs & Shorts OI.
Namely CoT Delta also must be > 47.5%
We also have a Cautionary level, where it is not necessarily a good idea to accumulate Bitcon, as a better opportunity lower may avail itself, see conditions below.
So the required logic explicitly stated below for all Signals.
1. Long - Hunt Bitcoin CoT Delta < or = 5
2. SUPER Long - Hunt Bitcoin CoT Delta < or = 5; and 2 Day Historical Bitcoin Volatility = or < 20
3. Short - Largest 4 Sellers OI = or > 70
4. SUPER Short - Largest 4 Sellers OI = or > 70; AND..
Hunt Bitcoin CoT Delta = or > 47.5 AND 2 Day Historical BTC Volatility = or < 20
5. Caution - Largest 4 Sellers OI = or > 67.5 AND Hunt Bitcoin CoT Delta = or > 45
WARNING SEE Notes Below
Note 1 - = Largest 4 Open Interest Shorts
Note 2 - = Largest 4 Open Interest Longs
Note 3 - = Hunt Cot Delta = (Largest 4 sellers OI) -( Largest 4 Buyers OI)
Caution = Avoid new Bitcoin Accumulation Right Now, A sell signal might follow Enter on next Long
Note 4 - The Hunt Bitcoin COT Delta signal is a Largest 'Insider' Tracking tool based on a segment of Commitment of Traders data on Bitcoin Futures, released once a week on a Friday.
It is a Macro Timeframe signal , and should not be used for Day trading and Short Timeframe analysis , Entries may be optimised after a Hunt Bitcoin CoT Signal is generated by separate shorter Timeframe analysis.
Note 5 - The Historical Bitcoin Volatility is an additional 'Amplifier' component to the 'Hunt Bitcoin Cot Delta' Insider Signal
Note 6 - The Historical Bitcoin Volatility criteria varies by timeframe, the above levels are those applying on a Two Day TF Chart, select this custom timeframe in Trading View.
if additional criteria are met for LONG & SHORT insider signals, they may become 'Super Longs/Shorts', see conditions box above.
Hunt Bitcoin CoT Open Interest DeltaWhy Bother another CoT signal?
Its different & focused on the Insider's.
Performance -
This Indicator provided a
1. Signal 1 = 26th March 2019 = SUPER LONG at $4,500 that saw a near $14,000 run up
2. Signal 2 = 18th & 24th June 2019 = SHORT at the second & final level $11,700 after repeated attempts & failure in the $13K range, the mini Echo Bitcoin Bull of 2019
3. Signal 3 = 17th December 2019 = LONG $6,900, Bitcoin rallied to Mid $10,500's
4. Signal 4 = 18th Feb 2020 = SUPER SHORT from $9,700's to a final extreme Low of $3,000, calling the CV-19 collapse
5. Signal 5 = 17th March 2020 = LONG from $5,400 no closure point yet
6. Signal 6 = 29th June 2020 = SUPER LONG reiterate from $10,700 no closure sell signal yet
7. Signal 7 = 17th May 2020 = LONG another accumulate LONG with no sell signal yet generated at Post H&S's low of $33,000
Note - This indicator only commences March 2019, as Bitcoin futures were a recent introduction and needed to settle for 6 months in both use and data, no signals were meaningful prior & data was light.
What is Provided. - Please note the need to also add the Hunt Bitcoin Historical Volatility Indicator for full understanding.
We provide 3 things with the 3 indicators.
'Insider' indications from Largest players in the futures market.
1. Bitcoin Macro Buy Signals.
a) The Bitcoin Commitment of Traders results see us focus solely on Largest 4 Short Open Interest & Largest 4 Long Open Interest aspects of the CoT Release data.
When the difference - is tight, a kind of pinch, these have been great Buy signals in Bitcoin.
We call this difference the Delta & When Delta is 5% or less Bitcoin is a Buy.
2. Bitcoin Macro Sells.
a) A sell signal is Triggered in Bitcoin at any point the Largest 4 short OI > or = to 70
3. AMPLIFIER Trade signals 'Super' Longs or Shorts -
Extreme low volatility events leads to highly impulsive & volatile subsequent moves, if either of 1 or 2 above occur, combined with extreme low volatility
a 'Super Long' or 'SUPER SELL' is generated. In the case of the short side, given Bitcoins general expansive and MACRO Bull trend since inception, we seek an additional component
that is an extreme differential/Delta reading between 4 biggest Longs & Shorts OI.
Namely CoT Delta also must be > 47.5%
We also have a Cautionary level, where it is not necessarily a good idea to accumulate Bitcon, as a better opportunity lower may avail itself, see conditions below.
So the required logic explicitly stated below for all Signals.
1. Long - Hunt Bitcoin CoT Delta < or = 5
2. SUPER Long - Hunt Bitcoin CoT Delta < or = 5; and 2 Day Historical Bitcoin Volatility = or < 20
3. Short - Largest 4 Sellers OI = or > 70
4. SUPER Short - Largest 4 Sellers OI = or > 70; AND..
Hunt Bitcoin CoT Delta = or > 47.5 AND 2 Day Historical BTC Volatility = or < 20
5. Caution - Largest 4 Sellers OI = or > 67.5 AND Hunt Bitcoin CoT Delta = or > 45
WARNING SEE Notes Below
Note 1 - = Largest 4 Open Interest Shorts
Note 2 - = Largest 4 Open Interest Longs
Note 3 - = Hunt Cot Delta = (Largest 4 sellers OI) -( Largest 4 Buyers OI)
Caution = Avoid new Bitcoin Accumulation Right Now, A sell signal might follow Enter on next Long
Note 4 - The Hunt Bitcoin COT Delta signal is a Largest 'Insider' Tracking tool based on a segment of Commitment of Traders data on Bitcoin Futures, released once a week on a Friday.
It is a Macro Timeframe signal , and should not be used for Day trading and Short Timeframe analysis , Entries may be optimised after a Hunt Bitcoin CoT Signal is generated by separate shorter Timeframe analysis.
Note 5 - The Historical Bitcoin Volatility is an additional 'Amplifier' component to the 'Hunt Bitcoin Cot Delta' Insider Signal
Note 6 - The Historical Bitcoin Volatility criteria varies by timeframe, the above levels are those applying on a Two Day TF Chart, select this custom timeframe in Trading View.
if additional criteria are met for LONG & SHORT insider signals, they may become 'Super Longs/Shorts', see conditions box above.

Tape [LucF]█ OVERVIEW
This script prints an ersatz of a trading console's "tape" section to the right of your chart. It displays the time, price and volume of each update of the chart's feed. It also calculates volume delta for the bar. As it calculates from realtime information, it will not display information on historical bars.
█ FEATURES
Calculations
Each new line in the tape displays the last price/volume update from the TradingView feed that's building your chart. These updates do not necessarily correspond to ticks from the originating broker/exchange's matching engine. Multiple broker/exchange ticks are often aggregated in one chart update.
The script first determines if price has moved up or down since the last update. The polarity of the price change, in turn, determines the polarity of the volume for that specific update. If price does not move between consecutive updates, then the last known polarity is used. Using this method, we can calculate a running volume delta accumulation for the bar, which becomes the bar's final volume delta value when the bar closes (you can inspect values of elapsed realtime bars in the Data Window or the indicator's values). Note that these values will all reset if the script re-executes because of a change in inputs or a chart refresh.
While this method of calculating volume delta is not perfect, it is currently the most precise way of calculating volume delta available on TradingView at the moment. Calculating more precise results would require scripts to have access to bid/ask levels from any chart timeframe. Charts at seconds timeframes do use exchange/broker ticks when the feeds you are using allow for it, and this indicator will run on them, but tick data is not yet available from higher timeframes, for now. Also note that the method used in this script is far superior to the intrabar inspection technique used on historical bars in my other "Delta Volume" indicators. This is because volume delta here is calculated from many more realtime updates than the available intrabars in history.
Inputs
You can use the script's inputs to configure:
• The number of lines displayed in the tape.
• If new lines appear at the top or bottom.
• If you want to hide lines with low volume.
• The precision of volume values.
• The size of the text and the colors used to highlight either the tape's text or background.
• The position where you want the tape on your chart.
• Conditions triggering three different markers.
Display
Deltas are shown at the bottom of the tape. They are reset on each bar. Time delta displays the time elapsed since the beginning of the bar, on intraday timeframes only. Contrary to the price change display by TradingView at the top left of charts, which is calculated from the close of the previous bar, the price delta in the tape is calculated from the bar's open, because that's the information used in the calculation of volume delta. The time will become orange when volume delta's polarity diverges from that of the bar. The volume delta value represents the current, cumulative value for the bar. Its color reflects its polarity.
When new realtime bars appear on the chart, a ↻ symbol will appear before the volume value in tape lines.
Markers
There are three types of markers you can choose to display:
• Marker 1 on volume bumps. A bump is defined as two consecutive and increasing/decreasing plus/minus delta volume values,
when no divergence between the polarity of delta volume and the bar occurs on the second bar.
• Marker 2 on volume delta for the bar exceeding a limit of your choice when there is no divergence between the polarity of delta volume and the bar. These trigger at the bar's close.
• Marker 3 on tape lines with volume exceeding a threshold. These trigger in realtime. Be sure to set a threshold high enough so that it doesn't generate too many alerts.
These markers will only display briefly under the bar, but another marker appears next to the relevant line in the tape.
The marker conditions are used to trigger alerts configured on the script. Alert messages will mention the marker(s) that triggered the specific alert event, along with the relevant volume value that triggered the marker. If more than one marker triggers a single alert, they will overprint under the bar, which can make it difficult to distinguish them.
For more detailed on-chart analysis of realtime volume delta, see my Delta Volume Realtime Action .
█ NOTES FOR CODERS
This script showcases two new Pine features:
• Tables, which allow Pine programmers to display tabular information in fixed locations of the chart. The tape uses this feature.
See the Pine User Manual's page on Tables for more information.
• varip -type variables which we can use to save values between realtime updates.
See the " Using `varip` variables " publication by PineCoders for more information.

Average Directional Index + ΔDI± (Delta)Average Directional Index (ADX) and Difference between DI+ and DI- (ΔDI±), I call it Delta for short.
The idea explained:
ADX is a common indicator for analysing trend strength. Values over 25 usually indicate the symbol is in "trend mode", meaning there is a lot of momentum, upwards or downwards, - while values under 25 suggest it is in "range mode", the price moves sideways, lacking energy. Note that this indicator is not volume-based.
I moved the graph (red) down 25 points; this version shows positive values in "trend mode" (>25), and negative values in "range mode" (<25). The line sits at 0. The underlying code for the ADX is basically identical to the official TradingView built-in version.
Now the exciting part: DI+ and DI- are used to calculate the ADX. They are sometimes included in the ADX indicator chart, I included a version that shows them in the graphic, at the bottom. Traditionally, DI+ (green) crossing DI- (dark red) from below shows the beginning of an upward trend, and therefore a good LONG entry position. However, I noticed that this is usually not the case: this method responds very slowly to the actual price movement. At the point the indicator tells you to enter, the trend is usually already exhausted.
I found a better way to use this data; instead of waiting for both graphs to cross, meaning the difference in their respective values is 0, we look for the greatest possible difference. That is what the purple graph of my indicator shows (ΔDI±). It utilizes the zero-line we already created for the ADX. High positive values declare that the DI+ is much greater than the DI-, and vice versa. Delta is the greek letter used in mathematics for difference, so that is what I call this indicator.
How to use it:
When you look at the graph, low Delta values seem to be good entry points for LONG positions, high Delta values good exits. This is similar to how RSI and CCI work, which is why included them in the chart above (). However, this is only reliable, when the ADX is above 25, or 0 in this version, indicating the symbol is in "trend mode". This is important .
When you look at the examples in the chart, you can confirm that. The marked candles show good entry and exit points, with Delta being notably low/high (±25 seems to be a good threshold, the dashed lines sit at +30/-30), and the ADX above 0 (25). Now, you might have noticed that around mid-december the Delta actually registers the highest value for this symbol in the given time frame, indicating a strong SHORT after a steep climb. But, importantly , the ADX is not in "trend mode" as required for a clear signal, it is in "range mode": the price discovers this new level and takes a few days to get used to it. It does not fall. This shows why only the combination of both Delta and ADX gives desirable results.
I noticed that this seems to work best for 1D and 1H candles; if you find any other time frames or scenarios, let me know!
PLEASE NOTE THAT THIS IS BASED ON PERSONAL, EMPIRICAL OBSERVATIONS. PAST RESULTS DO NOT GUARANTEE SUCCESS IN THE FUTURE. DO NOT TAKE THIS AS INVESTMENT ADVICE!
Thanks to TradingView and robertkowalski for providing the basis on which the code is built. Credit goes to the appropriate developers/owners.
()
Let me know if you make any other observations, or find other ways to use the data!

Cumulative Symbol ChangeSome symbols in trading view are cumulative - meaning they increment continuously throughout the trading day and are reset to 0 at the new trading day.
For example USI:CVOLM (Call Volume in Miami).
This script subtracts the current cumulative value from the prior cumulative value, so the change/delta in the cumulative value can be determined bar-by-bar.

Tick Delta VolumeExperimental:
this script only works on live updating bars(market open and live), the longer it runs the more accurate it will be.
displays:
- total intrabar volume processed(may not be equal to volume).
- last delta tick change in volume.
- this bar delta avg and stdev per tick.
- a overall of all live candles processed avg and stdev of the deltas processed.

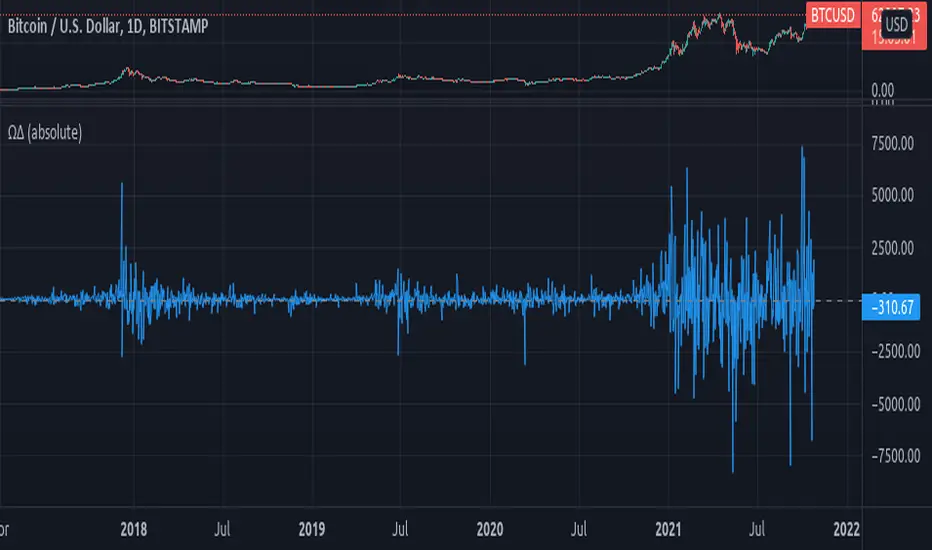
Cumulative Volume DeltaCumulative Delta Volume is one of the key analysis in figuring out the Volume Price Action dependencies
Its very Intuitive in nature,
The below image shows how it is computed!
Enjoy
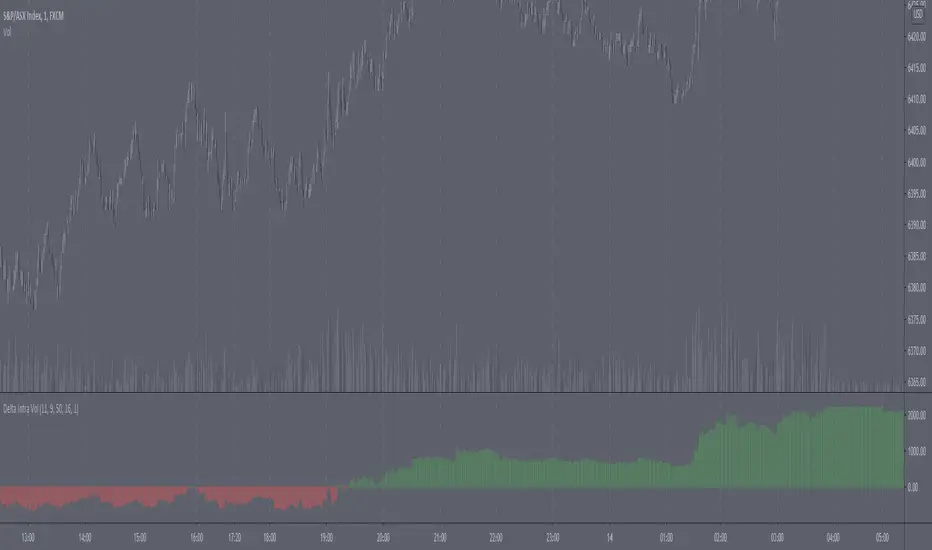
Delta Volume Weighted - IntradayResets at the start of the day's session (9:50 am on the ASX).
Takes the first candle and checks if its a green candle (close > open), and adds the volume to a total (which starts at 0 at the start of the day).
Subtracts it if the candles in red.
Continues to do this along with all the candles.
The volume is also multiplied by the difference between open and close so that large candles with large volume have more weight and move the indicator more.
Perp vs Spot Delta (Bybit-CB)Simple script showing the delta of Bybit BTCUSD perp vs Coinbase BTCUSD spot. Orange positive candles show bybit is higher, blue negative candles show Coinbase is higher.