Midnight Open (UTC - 5) - Until NoonMidnight Opening
Default to UTC -5
Adjust Timezone in Timestamp variable.
Циклический анализ

Price % Above/Below 20 EMADelta between current price and EMA20, calculated as percent difference between EMA and closing price.

Midpoint of Last 3 CandlesThis indicator highlights the market structure by plotting the midpoints of the current and previous two candles. It draws a horizontal line at the average of the high and low for each of these candles, giving a visual cue of the short-term balance point in price action. These midpoints can act as dynamic support and resistance levels, helping traders assess areas of potential reaction or continuation.
Each line is color-coded for clarity: green represents the current candle, orange marks the previous candle, and yellow indicates the one before that. All lines extend into the future on the chart, allowing you to see how price interacts with these levels as new candles form. This simple yet effective tool can be useful in various strategies, especially those focused on price action, scalping, or intraday analysis.

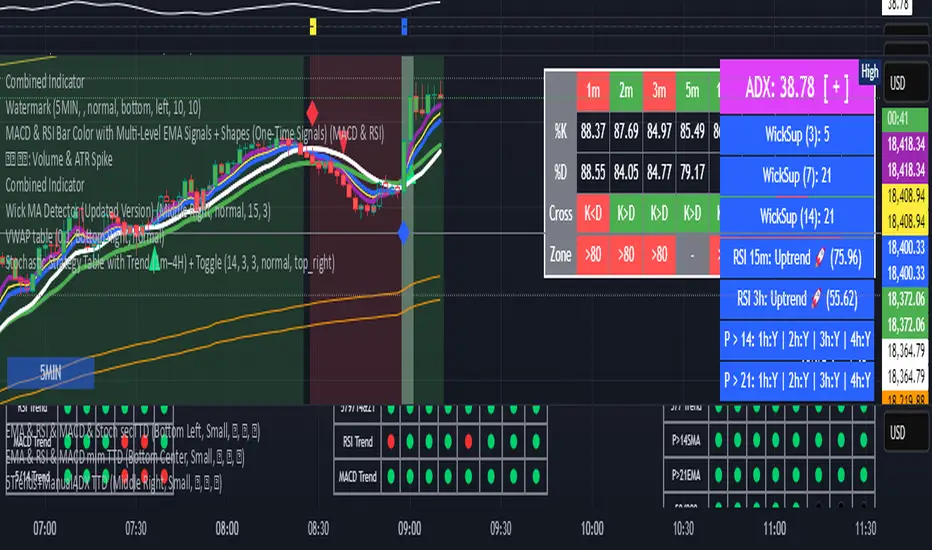
Stochastic Strategy Table with Trend (1m–4H) + Toggle📊 Multi-Timeframe Stochastic Strategy Table with Trend Detection
This script is designed for intraday and swing traders who want to monitor Stochastic momentum across multiple timeframes in real-time — all directly on the main chart.
🔎 What This Script Does
This script builds a compact, color-coded table that displays:
✅ %K and %D values of the Stochastic oscillator
✅ Cross direction (K > D or K < D)
✅ Overbought/Oversold zone conditions
✅ Short-term trend detection via %K movement
It covers ten timeframes:
1m, 2m,3m,5m, 15m, 30m, 1H, 2H, 3H, 4H
🟩 How to Use It
Trend colors in header:
🟢 Green = %K is rising (uptrend)
🔴 Red = %K is falling (downtrend)
⚪ Gray = flat or neutral
Cross Row:
Green background = Bullish (%K > %D)
Red background = Bearish (%K < %D)
Zone Row:
Green = Oversold (%K and %D below 20)
Red = Overbought (%K and %D above 80)
Gray = Neutral zone
Use Case:
Look for multiple timeframes aligning in trend
Enter trades on short timeframes (e.g. 5m) when HTFs confirm direction
Especially powerful when used with price action on 5m/15m candles
⚙️ Configurable Inputs
%K Length
%K Smoothing
%D Length
Table location
Table size
💡 Why This Script Is Unique
Shows true higher timeframe Stochastic values (not interpolated from current chart)
Works in real-time with consistent updates
Trend direction is visualized without needing extra space
Built for serious intraday traders who rely on clean data and signal alignment
🙏 Credits & Notes
This tool was created to solve a real problem: getting accurate HTF stochastic data in a clean, real-time, decision-friendly format.
I built it for my own use — and now I'm sharing it for luck, and for anyone else looking to trade more clearly and confidently.
Feel free to fork, customize, or build upon it.
Good luck, and trade safe! 🍀💹

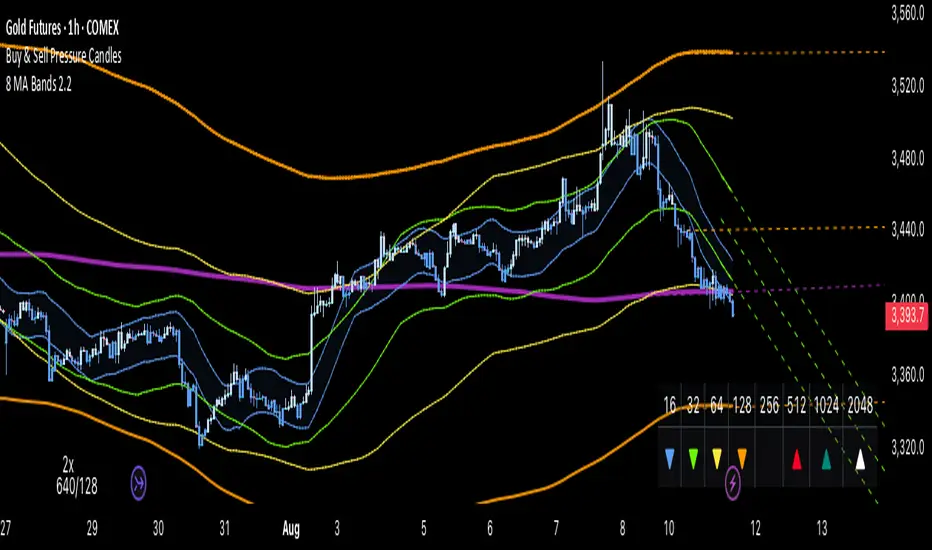
ONE RING 8 MA Bands with RaysCycle analysis tool ...
MAs: Eight moving averages (MA1–MA8) with customizable lengths, types (RMA, WMA, EMA, SMA), and offsets
Bands: Upper/lower bands for each MA, calculated based on final_pctX (Percentage mode) or final_ptsX (Points mode), scaled by multiplier
Rays: Forward-projected lines for bands, with customizable start points, styles (Solid, Dashed, Dotted), and lengths (up to 500 bars)
Band Choices
Manual: Uses individual inputs for band offsets
Uniform: Sets all offsets to base_pct (e.g., 0.1%) or base_pts (e.g., 0.1 points)
Linear: Scales linearly (e.g., base_pct * 1, base_pct * 2, base_pct * 3 ..., base_pct * 8)
Exponential: Scales exponentially (e.g., base_pct * 1, base_pct * 2, base_pct * 4, base_pct * 8 ..., base_pct * 128)
ATR-Based: Offsets are derived from the Average True Range (ATR), scaled by a linear factor. Dynamic bands that adapt to market conditions, useful for breakout or mean-reversion strategies. (final_pct1 = base_pct * atr, final_pct2 = base_pct * atr * 2, ..., final_pct8 = base_pct * atr * 8)
Geometric: Offsets follow a geometric progression (e.g., base_pct * r^0, base_pct * r^1, base_pct * r^2, ..., where r is a ratio like 1.5) This is less aggressive than Exponential (which uses powers of 2) and provides a smoother progression.
Example: If base_pct = 0.1, r = 1.5, then final_pct1 = 0.1%, final_pct2 = 0.15%, final_pct3 = 0.225%, ..., final_pct8 ≈ 1.71%
Harmonic: Offsets are based on harmonic flavored ratios. final_pctX = base_pct * X / (9 - X), final_ptsX = base_pts * X / (9 - X) for X = 1 to 8 This creates a harmonic-like progression where offsets increase non-linearly, ensuring MA8 bands are wider than MA1 bands, and avoids duplicating the Linear choice above.
Ex. offsets for base_pct = 0.1: MA1: ±0.0125% (0.1 * 1/8), MA2: ±0.0286% (0.1 * 2/7), MA3: ±0.05% (0.1 * 3/6), MA4: ±0.08% (0.1 * 4/5), MA5: ±0.125% (0.1 * 5/4), MA6: ±0.2% (0.1 * 6/3), MA7: ±0.35% (0.1 * 7/2), MA8: ±0.8% (0.1 * 8/1)
Square Root: Offsets grow with the square root of the band index (e.g., base_pct * sqrt(1), base_pct * sqrt(2), ..., base_pct * sqrt(8)). This creates a gradual widening, less aggressive than Linear or Exponential. Set final_pct1 = base_pct * sqrt(1), final_pct2 = base_pct * sqrt(2), ..., final_pct8 = base_pct * sqrt(8).
Example: If base_pct = 0.1, then final_pct1 = 0.1%, final_pct2 ≈ 0.141%, final_pct3 ≈ 0.173%, ..., final_pct8 ≈ 0.283%.
Fibonacci: Uses Fibonacci ratios (e.g., base_pct * 1, base_pct * 1.618, base_pct * 2.618
Percentage vs. Points Toggle:
In Percentage mode, bands are calculated as ma * (1 ± (final_pct / 100) * multiplier)
In Points mode, bands are calculated as ma ± final_pts * multiplier, where final_pts is in price units.
Threshold Setting for Slope:
Threshold setting for determining when the slope would be significant enough to call it a change in direction. Can check efficiency by setting MA1 to color on slope temporarily
Arrow table: Shows slope direction of 8 MAs using an Up or Down triangle, or shows Flat condition if no triangle.
Perfect MA Touch (EMA/SMA + Font Size) – ExtendedThis is an extension of the Perfect MA touch with 6 total spaces for the Moving Averages.
When the candle touches the MA for the first time it will have a 1, and then the 5 the time it will leave a 5. Make you trading decisions with help from the 5 candle high and low.

DUONG_EURWhat is the RSI indicator? Instructions on how to use RSI in stock trading
Currently, technical analysis indicators are widely used to confirm the strength or weakness of the market. In this article, let's learn more about the RSI indicator with DSC to easily confirm the current strength of the market.
What is the RSI indicator?
The RSI indicator, also known as the relative strength indicator, is widely used in the financial and stock markets. RSI is calculated by the price of the most recent previous closing sessions. Therefore, it is often considered normal when it moves in phase with the price line.
RSI calculation formula
In which:
RS = AvgU/AvgD
AvgU is the average of the closing price changes of the increasing sessions in 14 sessions.

KI_30wmaWeekly EMA with Label
This indicator plots the Weekly EMA on any timeframe chart and shows a clean label for easy reference. Useful for tracking higher timeframe trend support or resistance zones.

Líneas Horizontales cada 100 Pips - XAUUSDlineas horizontales, del oro cada 100pips para valores sicologicos y tener una mejor operativa

Market Sessions & Viewer Panel [By MUQWISHI]▋ INTRODUCTION :
The “Market Sessions & Viewer Panel” is a clean and intuitive visual indicator tool that highlights up to four trading sessions directly on the chart. Each session is fully customizable with its name, session time, and color. It also generates a panel that provides a quick-glance summary of each session’s candle/bar shape, helping traders gain insight into the volatility across all trading sessions.
_______________________
▋ OVERVIEW:
_______________________
▋ CREDIT:
This indicator utilizes the “ Timezone — Library ”. A huge thanks to @n00btraders for effort and well-organized work.
_______________________
▋ SESSION PANEL:
The Session Panel allows traders to visually compare session volatility using a candlestick/bar pattern.
Each bar represents the price action during a session and includes the session status, session name, closing price, change(%) from open, and a tooltip that reveals detailed OHLC and volume when hovered over.
Chart Type:
It offers two styles Bar or Candle to display based on traders’ preference
Sorting:
Allowing to arrange session candles/bars based on…
—Left to Right: The most recently opened on the left, moving backward in time to the right.
—Right to Left: The most recently opened on the right, moving backward in time to the left.
—Default: Arrange sessions in the user-defined input order.
_______________________
▋ CHART VISUALIZATION:
The chart visualization highlights each trading session using color-coded backgrounds in two selectable drawing styles that span their respective active timeframes. Each session block provides session’s name, close price, and change from open.
Chart Type: Candle
Chart Type: Box
Extra Drawing Feature:
This feature may not exist in other indicators within the same category, it extends the session block drawing to the projected end of the session. This's done through estimation based on historical data; however, it doesn’t function fully on seconds-based timeframes due to drawing limitations.
_______________________
▋ INDICATOR SETTINGS:
Section(1): Sessions
(1) Universal Timezone.
(2) Each Session: Enable/Disable, Name, Color, and Time.
Section(2): Session Panel
(1) Show/Hide Session Panel.
(2) Chart Type: Candle/Bar.
(3) Bar’s Up/Down color.
(4) Width and Height of the bar.
(5) Location of Session Panel on chat.
(6) Sort: Left to Right (most recent session is placed on the left), Right to Left (most recent session is placed on the right), and Default (as input arrangement).
Section(3): Chart Visualization
(1) Show/Hide Chart Block Visualization.
(2) Draw Shape: Box/Candle.
(3) Border Style and Size.
(4) Label Styling includes location, size, and some essential selectable infos.
Please let me know if you have any questions

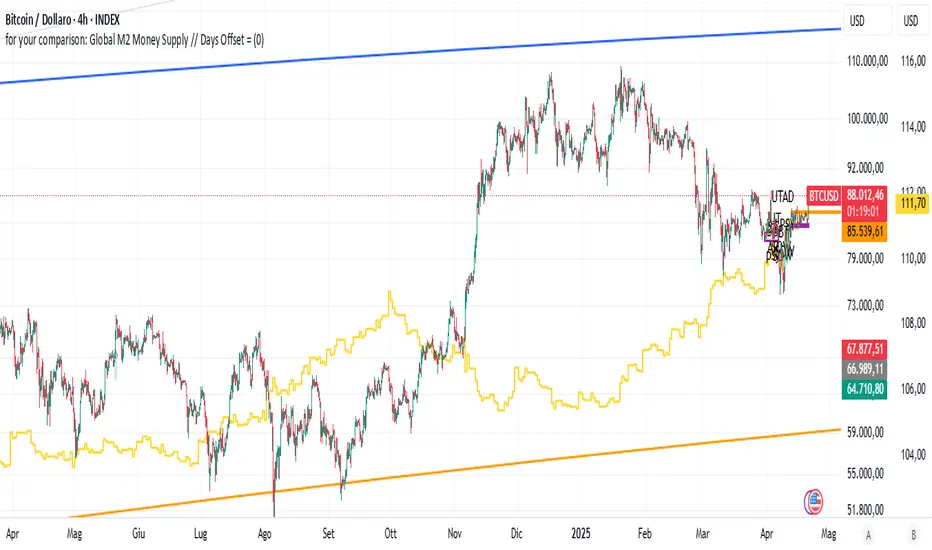
for your comparison: Global M2 Money Supply // Days Offset =📈 Global M2 Money Supply Overlay – Offset Adjustable
This script plots an aggregated, FX-adjusted global M2 money supply index directly on your TradingView chart. It pulls M2 data from multiple global regions—including North America, Europe, Asia, Latin America, and more—and normalizes it for comparison in USD terms.
You can apply a custom time offset to the M2 line using the settings, allowing you to test potential leading or lagging correlations between global liquidity and market price action (e.g., Bitcoin, equities, commodities).
💡 Ideal for macro traders, long-term investors, and anyone interested in liquidity-driven market behavior.
Features:
Combines M2 data from 20+ countries and currency zones
FX-adjusted for consistency in USD terms
Offset slider to shift M2 data forward or backward in time
Scaled to trillions for readability
Plots directly on the main chart for visual comparison
Uptrend Filter: Price > 50 & 200 MA + Upward SlopeThis indicator is designed to help traders instantly identify strong uptrend conditions based on two simple yet powerful criteria:
Price is above both the 50-day and 200-day moving averages
Both moving averages are sloping upward (positive momentum)
When both conditions are met, the indicator plots a green “UP” label below the candle, signaling a valid uptrend setup. This filter is ideal for asset selection in strategy-building, portfolio rotation, or trend-following systems.
🧠 Why it works:
The 50-day MA reflects medium-term momentum.
The 200-day MA represents the long-term trend.
When both are aligned and sloping upward, it confirms strong market structure and trend health.
🧰 Best used for:
Token screening (e.g., filtering altcoins)
Momentum-based entries
Trend confirmation
Risk filtering in strategy backtesting


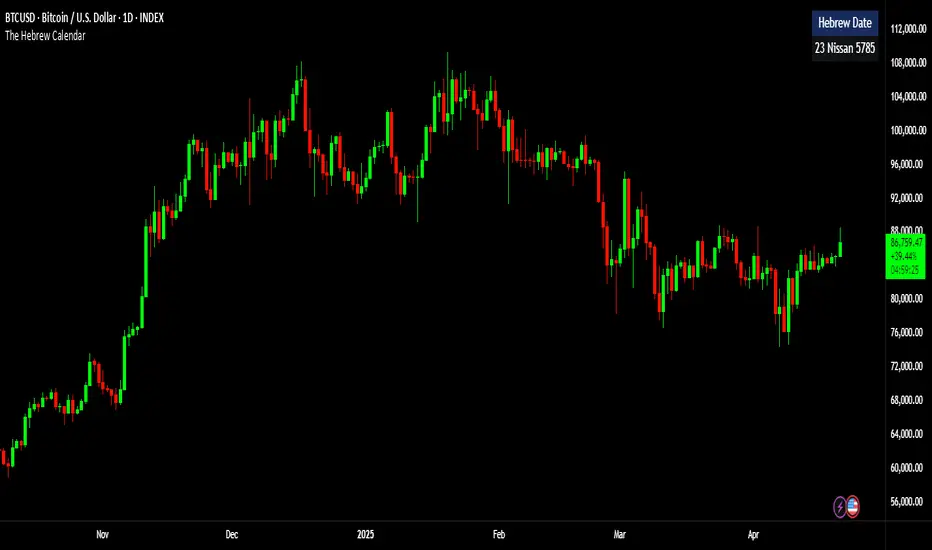
The Hebrew CalendarThis indicator displays the current Hebrew (Jewish) calendar date based on the real-time Gregorian calendar. Features included:
Calculates and displays the current Hebrew day, month, and year.
Recognizes leap years and adjusts month counts accordingly.
Aligns with traditional Hebrew month names (Tishrei, Cheshvan, Kislev, etc.).
The calculations align with the Hebrew Calendar Converter from:
👉 www.chabad.org
The results are shown in a table overlay on your chart's top-right corner. This indicator is great for symbolic traders, astro enthusiasts, or anyone interested in ancient timekeeping systems woven into financial timeframes. Enjoy, time travelers! ⌛
The Mayan CalendarThis indicator displays the current date in the Mayan Calendar, based on real-time UTC time. It calculates and presents:
🌀 Long Count (Baktun.Katun.Tun.Uinal.Kin) – A linear count of days since the Mayan epoch (August 11, 3114 BCE).
🔮 Tzolk'in Date – A 260-day sacred cycle combining a number (1–13) and one of 20 day names (e.g., 4 Ajaw).
🌾 Haab' Date – A 365-day civil cycle divided into 18 months of 20 days + 5 "nameless" days (Wayeb').
The calculations follow Smithsonian standards and align with the Maya Calendar Converter from the National Museum of the American Indian:
👉 maya.nmai.si.edu
The results are shown in a table overlay on your chart's top-right corner. This indicator is great for symbolic traders, astro enthusiasts, or anyone interested in ancient timekeeping systems woven into financial timeframes. Enjoy, time travelers! ⌛

Pivot Points Projected Dates with ±1SD (Daily/Weekly)Work in progress, projecting expected window of daily and weekly High Low formation based on mean pivot high and low counts

High/Low Day + Operacionais (com RSI)📌 Indicator Name: High/Low Day + Operational Levels (with RSI)
Short title: HL Day + RSI
Version: Pine Script v6
Overlay: Yes (draws directly on the chart)
🧠 What This Script Does
This indicator is a comprehensive tool designed for intraday and swing traders, combining daily high/low levels, custom operational zones, and a scaled RSI visual directly on the chart. It helps traders identify key price zones for entries or exits and overlays the RSI indicator in a unique way that’s dynamically scaled to the day’s range.
⚙️ Main Features
🔹 Daily High & Low Lines
Automatically detects the current day’s high and low.
Updates dynamically as new highs/lows form.
Optionally displays labels for "High Day" and "Low Day".
🔹 Operational Zones
Two customizable strategies for setting trade zones around the high/low:
Operational 01: Projects levels above the High and below the Low using a user-defined distance (e.g., ±20 points).
Operational 02: Projects levels inside the daily range using a reversed logic (e.g., High - X and Low + X).
Each has customizable visibility and color.
🔹 RSI Visualization
Plots the RSI scaled between the day’s high and low prices.
Highlights overbought (default 80), oversold (default 20), and midpoint (default 50) RSI levels with color-coded lines.
Dynamically places a visual marker and RSI value label aligned to the price chart.
The RSI is smoothed using ATR to account for market volatility.
🛠️ How to Use It
Add the Script: Paste the code into a new Pine Script editor on TradingView and add it to your chart.
Timeframe: Best used on intraday charts (1m to 1h), but works on any timeframe.
Settings Panel:
Toggle the display of High/Low lines.
Adjust point distances for Operational 01 and 02.
Choose whether to show each operational zone and assign their colors.
Enable or disable RSI display, and customize RSI settings (length, ATR smoothing, levels, and colors).
Trade with Context:
Use Operational levels as potential zones for breakout or reversal entries.
Observe RSI in relation to the price range to gauge momentum or overbought/oversold conditions.
Combine the high/low zones and RSI signal for confirmation.
🔍 Example Scenarios
Breakout Strategy: Use Op. 01 levels for buying above the high + 20 pts or selling below the low – 20 pts.
Reversal Strategy: Use Op. 02 to identify potential fade/reversal levels within the day's range.
Momentum Confirmation: When price breaks Op.01 levels and RSI is above 70 or below 30, this may add confluence to the setup.

🔺 Smart Money Candle HighlightThis highlights SMC Candles red which helps in identifying retracements zones

Auto Step Horizontal LinesAuto Step Horizontal lines by custom range
Create automatic horizontal lines by specifying the price range for each line, with each line serving as an observation point for support and resistance levels.

🟨 Major Shift Order Block HighlightHighlights order block candles on the market that banks use to shift price direction


📈 Volume Surge with EMA Trend ConfirmationVolume Surge Indicator arrows populate - uses 200 ema and 20
