Williams Percent Range proWilliams Percent Range with Divergences (Williams %R Div)
Description:
This indicator enhances the traditional Williams %R oscillator by detecting both Regular Divergence and Hidden Divergence directly on the %R line. It helps traders spot potential trend reversals and trend continuations with high precision.
Key Features:
Williams %R calculation (standard, normalized between -100 and 0).
Pivot-based detection of divergences:
Regular Bullish Divergence: Price makes a lower low, but %R makes a higher low → potential upward reversal.
Regular Bearish Divergence: Price makes a higher high, but %R makes a lower high → potential downward reversal.
Hidden Bullish Divergence: Price makes a higher low, but %R makes a lower low → potential trend continuation upward.
Hidden Bearish Divergence: Price makes a lower high, but %R makes a higher high → potential trend continuation downward.
Customizable settings:
Enable/disable Regular and Hidden Divergences separately.
Customize colors for each divergence type.
Visual plotting:
Divergence signals are marked with labels (Bull, Bear, H Bull, H Bear) directly on the %R panel.
Built-in alert conditions:
Instant alerts when a Regular or Hidden Divergence is detected.
Usage Recommendation:
Regular Divergences are best used to anticipate trend reversals.
Hidden Divergences are useful for confirming trend continuations.
Combining divergence detection with key support/resistance levels, candlestick patterns, or moving averages can significantly enhance trading accuracy.
Циклический анализ

🇺🇸 US Unemployment Rate (FRED:UNRATE)The Coffee That Stopped Time
It was an ordinary Tuesday morning when Lena ordered a cappuccino at her favorite café, Zeitlos. Nothing about the day hinted that her life was about to take a wildly absurd turn.
The barista — an old man with eyes like melting clock hands — smiled at her and handed over the cup. “A little magic on the house today,” he said with a wink.
Lena chuckled, took a sip — and everything stopped. Literally. The spoon she was dipping into the sugar froze mid-air. The guy by the window paused mid-yawn. Outside, a bird hung in the air like a badly paused video.
Only Lena could move.
Confused, she walked through the streets. Everything was frozen. The world was a still image.
Then she found it: a small note in her jacket pocket that definitely hadn’t been there before. It simply read:
“You have one hour. Do something you’ve never dared to do.”
She thought for a moment. First, she stole a croissant — pure curiosity. Then she climbed to the roof of a hotel she'd always dreamed of photographing the city from. Finally, she sat in an abandoned vintage car, placed her hands on the steering wheel — and imagined herself just driving away from everything.
When the hour was up, the world resumed. The spoon clinked into the cup. The bird flew on. And Lena was back in the café, her cappuccino still half full.
The barista nodded. “How was it?”
“Unforgettable,” she said — and she didn’t mean the coffee.

📉 Advanced 2s10s Yield Spread MonitorThe Coffee That Stopped Time
It was an ordinary Tuesday morning when Lena ordered a cappuccino at her favorite café, Zeitlos. Nothing about the day hinted that her life was about to take a wildly absurd turn.
The barista — an old man with eyes like melting clock hands — smiled at her and handed over the cup. “A little magic on the house today,” he said with a wink.
Lena chuckled, took a sip — and everything stopped. Literally. The spoon she was dipping into the sugar froze mid-air. The guy by the window paused mid-yawn. Outside, a bird hung in the air like a badly paused video.
Only Lena could move.
Confused, she walked through the streets. Everything was frozen. The world was a still image.
Then she found it: a small note in her jacket pocket that definitely hadn’t been there before. It simply read:
“You have one hour. Do something you’ve never dared to do.”
She thought for a moment. First, she stole a croissant — pure curiosity. Then she climbed to the roof of a hotel she'd always dreamed of photographing the city from. Finally, she sat in an abandoned vintage car, placed her hands on the steering wheel — and imagined herself just driving away from everything.
When the hour was up, the world resumed. The spoon clinked into the cup. The bird flew on. And Lena was back in the café, her cappuccino still half full.
The barista nodded. “How was it?”
“Unforgettable,” she said — and she didn’t mean the coffee.

M2SL/DXY vs CryptoJust a test.With this indicator, we will be able to predict the trends of economic cycles and cash flow within the market.

Niveles decimalesCREATOR: SANTIAGO CANO
this indicator marks decimals in 10s on a graph for easier reading in assets such as indices or raw materials

Umair SuperchartThis indicator combines traditional pivot point analysis with volume surge detection to provide comprehensive trading signals. Here are its key features:
Main Components:
1. Daily Pivot Points (PP, R1-R3, S1-S3)
- Automatically calculates and displays pivot levels
- Color-coded lines (Red for Resistance, Blue for Pivot, Green for Support)
- Movable information box showing all levels
- Works across all timeframes
2. Volume Surge Detection
- Monitors volume increases above 20-period average
- Shows small triangles for immediate volume surges
• Green triangle below bar for bullish volume
• Red triangle above bar for bearish volume
3. Strong Buy/Sell Signals
- Tracks sustained volume surges (default 10 minutes)
- Displays blinking "STRONG BUY!" or "STRONG SELL!" messages
- Provides alerts for sustained momentum
Customizable Features:
- Adjustable volume surge threshold
- Customizable sustained period duration
- Movable pivot level display box
- Adjustable line widths and colors
- Flexible position settings
Alerts:
- Price breaks above R1/below S1
- Immediate volume surges
- Sustained bullish/bearish volume movements
Perfect for:
- Day traders monitoring volume-price relationship
- Swing traders using pivot points for support/resistance
- Technical analysts requiring multiple confirmation signals

Price-Based Strategybasic strategy to help struggling traders improve. Wait for 1 min candle to close above or below line then enter the trade

Triad Macro Gauge__________________________________________________________________________________
Introduction
__________________________________________________________________________________
The Triad Macro Gauge (TMG) is designed to provide traders with a comprehensive view of the macroeconomic environment impacting financial markets. By synthesizing three critical market signals— VIX (volatility) , Credit Spreads (credit risk) , and the Stocks/Bonds Ratio (SPY/TLT) —this indicator offers a probabilistic assessment of market sentiment, helping traders identify bullish or bearish macro conditions.
Holistic Macro Analysis: Combines three distinct macroeconomic indicators for multi-dimensional insights.
Customization & Flexibility: Adjust weights, thresholds, lookback periods, and visualization styles.
Visual Clarity: Dynamic table, color-coded plots, and anomaly markers for quick interpretation.
Fully Consistent Scores: Identical values across all timeframes (4H, daily, weekly).
Actionable Signals: Clear bull/bear thresholds and volatility spike detection.
Optimized for timeframes ranging from 4 hour to 1 week , the TMG equips swing traders and long-term investors with a robust tool to navigate macroeconomic trends.
__________________________________________________________________________________
Key Indicators
__________________________________________________________________________________
VIX (CBOE:VIX): Measures market volatility (negatively weighted for bearish signals).
Credit Spreads (FRED:BAMLH0A0HYM2EY): Tracks high-yield bond spreads (negatively weighted).
Stocks/Bonds Ratio (SPY/TLT): Evaluates equity sentiment relative to treasuries (positively weighted).
__________________________________________________________________________________
Originality and Purpose
__________________________________________________________________________________
The TMG stands out by combining VIX, Credit Spreads, and SPY/TLT into a single, cohesive indicator. Its unique strength lies in its fully consistent scores across all timeframes, a critical feature for multi-timeframe analysis.
Purpose: To empower traders with a clear, actionable tool to:
Assess macro conditions
Spot market extremes
Anticipate reversals
__________________________________________________________________________________
How It Works
__________________________________________________________________________________
VIX Z-Score: Measures volatility deviations (inverted for bearish signals).
Credit Z-Score: Tracks credit spread deviations (inverted for bearish signals).
Ratio Z-Score: Assesses SPY/TLT strength (positively weighted for bullish signals).
TMG Score: Weighted composite of z-scores (bullish > +0.30, bearish < -0.30).
Anomaly Detection: Identifies extreme volatility spikes (z-score > 3.0).
All calculations are performed using daily data, ensuring that scores remain consistent across all chart timeframes.
__________________________________________________________________________________
Visualization & Interpretation
__________________________________________________________________________________
The script visualizes data through:
A dynamic table displaying TMG Score , VIX Z, Credit Z, Ratio Z, and Anomaly status, with color gradients (green for positive, red for negative, gray for neutral/N/A).
A plotted TMG Score in Area, Histogram, or Line mode , with adaptive opacity for clarity.
Bull/Bear thresholds as horizontal lines (+0.30/-0.30) to signal market conditions.
Anomaly markers (orange circles) for volatility spikes.
Crossover signals (triangles) for bull/bear threshold crossings.
The table provides an immediate snapshot of macro conditions, while the plot offers a visual trend analysis. All values are consistent across timeframes, simplifying multi-timeframe analysis.
__________________________________________________________________________________
Script Parameters
__________________________________________________________________________________
Extensive customization options:
Symbol Selection: Customize VIX, Credit Spreads, SPY, TLT symbols
Core Parameters: Adjust lookback periods, weights, smoothing
Anomaly Detection: Enable/disable with custom thresholds
Visual Style: Choose display modes and colors
__________________________________________________________________________________
Conclusion
__________________________________________________________________________________
The Triad Macro Gauge by Ox_kali is a cutting-edge tool for analyzing macroeconomic trends. By integrating VIX, Credit Spreads, and SPY/TLT, TMG provides traders with a clear, consistent, and actionable gauge of market sentiment.
Recommended for: Swing traders and long-term investors seeking to navigate macro-driven markets.
__________________________________________________________________________________
Credit & Inspiration
__________________________________________________________________________________
Special thanks to Caleb Franzen for his pioneering work on macroeconomic indicator blends – his research directly inspired the core framework of this tool.
__________________________________________________________________________________
Notes & Disclaimer
__________________________________________________________________________________
This is the initial public release (v2.5.9). Future updates may include additional features based on user feedback.
Please note that the Triad Macro Gauge is not a guarantee of future market performance and should be used with proper risk management. Past performance is not indicative of future results.

ORB-LD-NY-Trail StrategyOpening range breakout strategy.
This runs after the first 15 min of London and New York opens.
Once price breaks either the high or low of the first 15 and order is placed in that direction. Trailing stop for more money!
Have fun!
I've had success, and failures. As with any strategy.
Use at your own risk!
Trading isn't easy!
Neither is automation!
Nothing is guaranteed!


Weekday Divider Lines//@version=5
indicator("Weekday Divider Lines", overlay=true)
// === Define line colors for each weekday ===
mondayColor = color.gray
tuesdayColor = color.yellow
wednesdayColor = color.orange
thursdayColor = color.green
fridayColor = color.blue
// === Plot vertical lines at the beginning of each day (on daily timeframes and below) ===
isNewDay = ta.change(time("D"))
// === Get current day of the week ===
// Monday = 1, ..., Sunday = 7
day = dayofweek
if (isNewDay)
if (day == dayofweek.monday)
line.new(x1=bar_index, y1=low, x2=bar_index, y2=high, color=mondayColor, width=1, style=line.style_dotted)
if (day == dayofweek.tuesday)
line.new(x1=bar_index, y1=low, x2=bar_index, y2=high, color=tuesdayColor, width=1, style=line.style_dotted)
if (day == dayofweek.wednesday)
line.new(x1=bar_index, y1=low, x2=bar_index, y2=high, color=wednesdayColor, width=1, style=line.style_dotted)
if (day == dayofweek.thursday)
line.new(x1=bar_index, y1=low, x2=bar_index, y2=high, color=thursdayColor, width=1, style=line.style_dotted)
if (day == dayofweek.friday)
line.new(x1=bar_index, y1=low, x2=bar_index, y2=high, color=fridayColor, width=1, style=line.style_dotted)

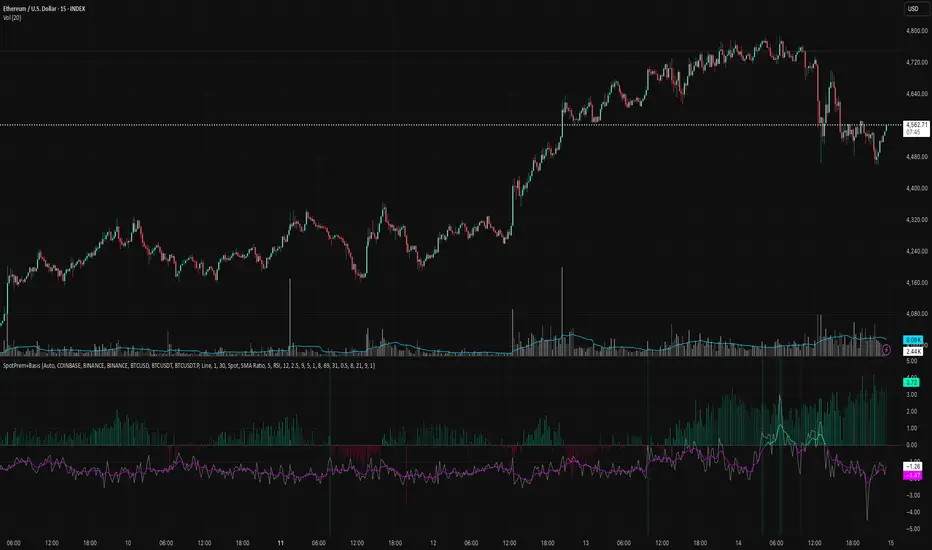
Spot Premium with ROCDescription:
This indicator tracks the spot premium of BTC by comparing the perpetual futures price (perp) from Binance against the spot price on Coinbase. The histogram displays the price difference (spot minus perp) with green bars when spot is higher and red when perp carries a premium. The Rate of Change (ROC) line measures how quickly this premium shifts, with an option to normalize fluctuations for greater stability.
Implications & Possible Use Cases:
• Market Sentiment Gauge: A sustained positive premium often indicates bullish sentiment, while a discount can signal bearish bias.
• Arbitrage Signals: Significant divergences between perp and spot may present short-term arbitrage opportunities across exchanges.
• Risk Management & Hedging: Traders can align derivatives and spot positions when premiums deviate sharply, reducing funding cost exposures.
• Funding Rate Insights: Since perp funding rates tend to follow premium levels, this indicator can act as an early warning for funding spikes.
• Trend Confirmation: Use the normalized ROC to confirm continuation or reversal of premium trends, filtering out noise around small diff values.
Let me know if you would like additional features.
Market Pulse TableMarket Pulse Table — Multi-Asset Momentum Dashboard
This indicator creates a customizable dashboard that monitors key market assets and their momentum using MACD and RSI signals. It's designed to give a quick pulse of market sentiment and trend strength in one glance.
📊 What it shows:
% Daily Change of selected symbols (e.g., VIX, ES1!, NQ1!, YM1!, RTY1!, DXY)
MACD Signal: Buy / Sell / Neutral, based on your selected timeframe
RSI Value: Color-coded by strength and potential overbought/oversold conditions
⚙️ How to use:
Select the assets you want to track in the settings.
Choose your preferred timeframes for MACD and RSI.
The table updates in real time with:
Price % change (colored by intensity)
MACD signal direction
RSI value (green/red for oversold/overbought)
📍 Table placement:
You can position the table anywhere on your chart (top, middle, bottom — left, center, or right).

Horizontal Lines from Arrayđây công cụ kẻ
cực hữu dụng
cho trend ngang
quá tuyệt với
đánh mọi khung thời gian

SAR Pullback By TradingConTotoName & Version
SAR Pullback UX Improved (Pine Script v5)
Core Logic
Calculates two EMAs (fast and slow) to identify overall trend direction.
Uses the Parabolic SAR to detect “flip” points (when SAR crosses price), marking micro-trend reversals.
Micro-Trend Extremes
Tracks the highest high after a bullish flip (SAR below price) and the lowest low after a bearish flip (SAR above price).
These extremes feed into the stop-loss approximation.
Approximate Stop-Loss (“SL aprox”)
If SAR is below price (bullish), SL ≔ (micro-trend high − current SAR).
If SAR is above price (bearish), SL ≔ (current SAR − micro-trend low).
Leverage Calculation
User-defined “UR in USD” input.
Computes leverage as UR ÷ SL, giving you an estimate of position sizing potential.
On-Chart Signals
BUY label at each bullish flip, with SL and leverage printed.
SELL label at each bearish flip, likewise showing SL and leverage.
Customizable UI
Inputs to toggle display of SL, leverage, or both.
Choose your UR value, panel background/text colors, and BUY/SELL label colors.
Panel position fixed at top-right by default, showing a 2×3 table:
Header row (“Metric” / “Value”)
“SL aprox” row
“Leverage” row
Visuals
Plots the slow EMA colored by trend.
Draws SAR as crosses.
Bar colors shade green/red according to bullish/bearish conditions.
Semi-transparent, styled panel for quick glance of key metrics.
This indicator combines trend filtering, automated stop-loss sizing, and leverage guidance into a single, fully-configurable Pine Script tool—giving you clear on-chart signals plus a neat metrics panel for streamlined decision-making.

📦 Sessions + 🎯 Killzones (Brussels Time)📦 Sessions + 🎯 Killzones (Brussels Time)
This script visually highlights the main Forex trading sessions and killzones directly on your chart, adjusted to Brussels Time (automatically handles summer/winter time). It includes:
✅ Asia, London, and New York Sessions — shown with colored background zones
🎯 Killzones for London & New York — marked with darker overlays during high-probability trading windows
📍 Session Opens — triangle markers at the start of each session
📈 Previous Day's High & Low — automatically plotted with dynamic lines that reset each day
Ideal for ICT-style traders and anyone who uses session-based strategies. Clean, clear, and timezone-aware.

SMC + EMA + Candles + RSI/CCI + BOS + Trailingfind SMC + EMA + Candles + RSI/CCI + BOS + Trailing in chart

Mother Fish ตีเส้น 0 กับ 5 TCMother Fish line 0 and 5
This indicator draws horizontal lines on your price chart at price levels ending in 0 and 5 within a price range you specify. You can adjust the starting and ending prices of the range, as well as choose the colors for lines ending in 0 and 5. This helps you easily visualize potential support and resistance levels based on these key price points.

Correction Candle CounterIndicator that identifies “correction” candles using the classic 3-1-3 pattern, highlights them with customizable colors and arrow markers, and tallies occurrences across all data, a selected year, or any defined month range. Flexible styling and date-filter options make it ideal for quick, focused analysis.

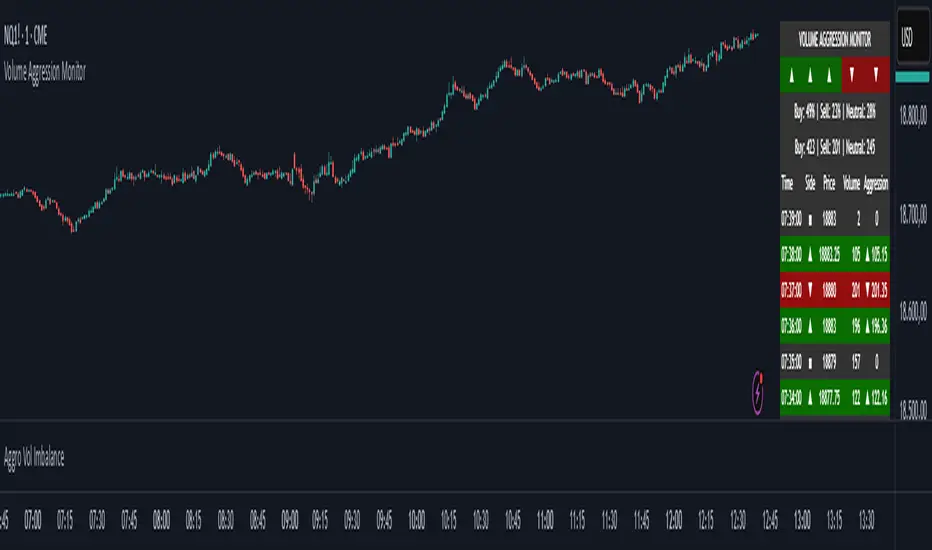
Volume Aggression Monitor📌 Volume Aggression Monitor — Overview
This indicator helps identify buying and selling pressure (aggression) in real-time by analyzing how market participants are executing trades. It is composed of three main components:
🔍 What Does It Show?
🧭 1. The Thermometer (Above Candles)
🟢 Green Arrow (▲) → Buy Aggression: Buyers are lifting the ask.
🔴 Red Arrow (▼) → Sell Aggression: Sellers are hitting the bid.
⚪ Gray Square (■) → Neutral: No significant price movement or aggression.
💡 Neutral in this context means:
The price barely moved during the candle (open-close % change < direction_threshold, default 0.05%).
No clear buyer or seller dominance. It often appears during low volatility, equilibrium, or market indecision periods. This prevents noise and false directional readings due to random micro-movements.
📊 2. Percentage Panel
A table displaying recent trades or candle data (from a lower timeframe). Colored arrows indicate the direction of aggression (buy/sell). Shows volume, delta, and aggression %.
✅ Use it to:
Track clusters of buy/sell aggression. Spot momentum builds.
⏱️ 3. Cumulative Times & Sales Bar
A horizontal progress bar representing cumulative aggression.
Positive = Buy Aggression dominates.
Negative = Sell Aggression dominates.
📉 Even in sideways price movement, this bar shows who is winning the fight under the surface.
---
🧠 How to Use It:
🔹 Confirm Trades
Use the thermometer and aggression signals to confirm your strategy entries (e.g., breakouts, pullbacks, support/resistance).
🔹 Detect Dominance
Observe who is in control: buyers or sellers? Are they pressing or hesitating?
🔹 Filter Market Noise
The neutral state avoids misinterpreting small, meaningless movements as strong signals.
---
Component | Meaning
🌡️ Thermometer (▲ ▼ ■) | Who’s in control in each candle
📊 Percentage Panel | Trade details: direction, delta, aggression
📈 Cumulative T&S Bar | Overall aggression bias over time
---
Maancyclus Volatiliteitsindicator (2025)This Moon Cycle Volatility Indicator for TradingView is designed to help traders track and analyze market volatility around specific lunar phases, namely the Full Moon and New Moon. The indicator marks the dates of these moon phases on the chart and measures volatility using the Average True Range (ATR) indicator, which gauges market price fluctuations.
Key Features:
Moon Phase Markers: The indicator marks the Full Moon and New Moon on the chart using labels. Blue labels are placed below bars for Full Moons, while red labels are placed above bars for New Moons. These markers are based on a manually curated list of moon phase dates for the year 2025.
Volatility Calculation: The indicator calculates market volatility using the ATR (14), which provides a sense of market movement and potential risk. Volatility is plotted as histograms, with blue histograms representing volatility around Full Moons and red histograms around New Moons.
Comparative Analysis: By comparing the volatility around these moon phases to the average volatility, traders can spot potential patterns or heightened market movements. This can inform trading strategies, such as anticipating increased market activity around specific lunar events.
In essence, this tool helps traders identify potential high-volatility periods tied to lunar cycles, which could impact market sentiment and price action.

MA backgroundAllows you to use various MAs with % bands set as a background. What it does is divides the % range selected into 1/4's and colors the bottom 1/4 green (your choice) and the top 1/4 red (your choice) then it stacks these ranges above and below the initial selected range. Screenshot is sma 16 but you can do session vwap with .1% measured moves, etc. I use it as a background under some other indicators but you can use it standalone for a pretty clean chart. It's an experiment...

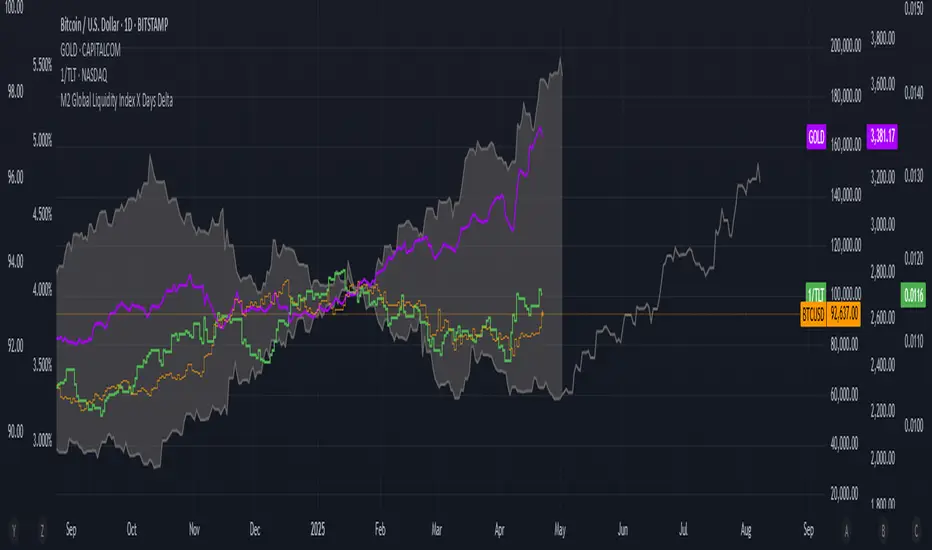
M2 Global Liquidity Index X Days DeltaCapture the delta between different global M2 time lags, and utilize width to increase or decrease the span between the two.