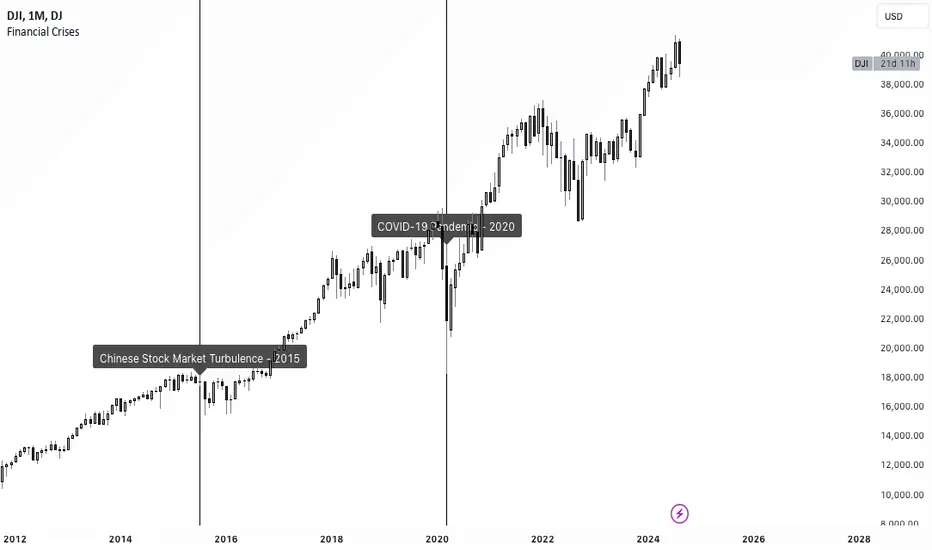
75: Notable Financial CrisesThe TradingView script named "75: Notable Financial Crises" visualizes and marks significant financial crises on a financial chart.
This script plots vertical lines on the a chart corresponding to specific dates associated with notable financial crises in history. These crises could include events like the Great Depression (1929), Black Monday (1987), the Dot-com Bubble (2000), the Global Financial Crisis (2008), and others. By marking these dates on a chart, traders and analysts can easily observe the impact of these events on market behavior.
Crashingmarket
Hindenburg Omen [QuantNomad]New record highs is good time to look at a market crash indicators )
This is a Hindenburg Omen indicator.
The Hindenburg Omen looks for a statistical deviation from the premise that under normal conditions, securities are either making new 52-week highs or 52-week lows. The abnormality would be if both were occurring at the same time. According to the Hindenburg Omen, an occurrence such as this is considered to be a harbinger of impending danger for a stock market. The signal typically occurs during an uptrend, where new highs are expected and new lows are rare, suggesting that the market is becoming nervous and indecisive, traits that often lead to a bear market.
For it to be on 4 conditions should be satisfied:
1. Number of new 52-week highs and 52-week lows in a stock market are greater than a threshold (2.2% for example).
2. Positive recent trend. Index > index
3. The McClellan Oscillator (MCO) is negative.
4. 52-week highs cannot be more than two times the 52-week lows.
You can read more about the indicator on Investopedia:
www.investopedia.com
Based on indicator created by @Boombotcom:
