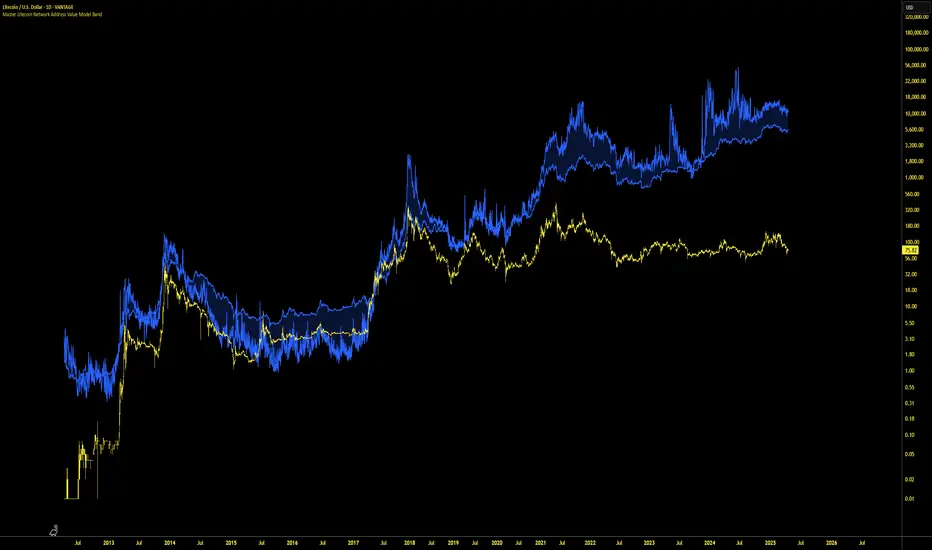
Master Litecoin Network Address Value Model BandThe Master Litecoin Network Address Value Model Band indicator compares Litecoin (LTC) and Bitcoin (BTC) network address activity to estimate LTC's value relative to BTC's price. It plots a band using new and total address ratios, adjusted by supply differences. Note: It excludes Litecoin's MWEB addresses, likely undervaluing the Litecoin network over time as MWEB adoption grows.
Графические паттерны
Short Strategy - B2 v2.37-Core Production📌 Strategy Overview – B2 v2.37-Core Production
This script is a short-only algorithmic strategy designed for altcoins, using Bitcoin’s multi-timeframe MACD histogram trends to guide and validate short entries. It flips all long logic from the A2 model to focus on bearish momentum, breakdowns, and trend reversals.
🔍 What It Does
Detects high-confidence short entries based on multiple bearish signals.
Confirms direction using BTC MACD histogram downtrends across 4H, 1H, 15M, and 5M charts.
Avoids premature exits during flat momentum phases with a custom lull detection system.
🧠 How It Works
🔻 Bearish Indicators Used
Price below EMA
RSI decreasing
MACD histogram falling
Strong MACD drop detection
Volume surge confirmation
ADX trend strength check
VWAP rejection
📉 BTC Trend Filters
BTC must be in a 4H MACD downtrend for short entries to be valid.
Adds weighted confidence from 1H and 15M MACD downtrend confirmations.
5M MACD checks for rolling weakness, no pops, momentum flush, and steep slope.
📊 Scoring System
Each bearish signal adds weighted points (e.g. MACD drop = +2, RSI down = +0.5).
Entry only happens if total score ≥ entry threshold (default: 7.0) and BTC confirms downtrend.
Exit occurs if score < exit threshold (default: 6.0) or BTC starts recovering.
⏳ Lull Logic for Shorts
Prevents exit during temporary MACD flattening unless recovery is confirmed.
Requires confirmation that BTC hasn’t shifted trend back up.
🪧 Labels and Visualization
Entry/exit markers show BTCUSDT price at the time of signal using request.security().
Entry labels are red (top of candle), exit labels are green (bottom of candle).
✅ Result
This model is optimized for short trades during BTC-led market downturns, filtering out false positives by demanding multi-timeframe alignment and multiple bearish confirmations.

Long Strategy - A2 v2.37-Core Production✅ Condensed Strategy Overview
This is a long-only trading strategy that uses multiple technical indicators combined with Bitcoin’s multi-timeframe MACD histogram trends to generate and filter trade entries.
🔧 Core Functionality
Uses a scoring system that adds weighted points from various signals:
Local indicators: EMA trend, RSI momentum, ATR volatility, VWAP, volume strength, and ADX.
Bitcoin MACD trends: 4H, 1H, 15M, and 5M histogram patterns (including slope, rise consistency, and momentum burst).
Entry Condition:
Triggered when:
The total score exceeds the entryThreshold (default: 7.0)
BTC 4H MACD histogram trend is confirmed to be rising
Exit Condition:
Triggered when:
The score falls below the exitThreshold (default: 6.0)
Or the MACD slope shows weakness or reversal on 4H BTC
Lull Logic:
Temporarily suppresses exits during minor MACD flattening as long as BTC’s trend remains intact
Price Labels:
Entry and exit signals are annotated with the live BTCUSDT price using request.security()

Master Litecoin Network Growth BandsThe "Master Litecoin Network Growth Bands" indicator (Pine Script v5) plots 26 horizontal bands on the Litecoin price chart (VANTAGE:LTCUSD) by dividing IntoTheBlock’s total Litecoin addresses by divisors (400 to 20,000,000). Each band (Band1 to Band26) is drawn with a white, thin line (linewidth=1), showing network growth relative to price to help identify support, resistance, or valuation levels. Note that this indicator does not include addresses on Litecoin’s MWEB (MimbleWimble Extension Blocks).

Master Litecoin Miner Sell PressureThe "Master Litecoin Miner Sell Pressure" indicator (Pine Script v5) tracks Litecoin miner selling pressure by comparing 14-day miner outflows to reserves, using IntoTheBlock data. It highlights high sell pressure with a blue background when the metric exceeds a 200-day Bollinger Band upper threshold, signaling potential bearish price pressure. Licensed under Mozilla Public License 2.0, adapted from © capriole_charles' Bitcoin indicator.

BusinessHut Stochastic Long/Short StrategyWhen the slow stochastics are below 20, 30, and 50, buy when the fast 9,3,3 stochastic crosses above 20.
Sell on the opposite.

Full‑Featured Multi‑Signal Strategy By Andi TanThis is my first strategy indicator, please try the backtest and use it, hopefully it will be useful

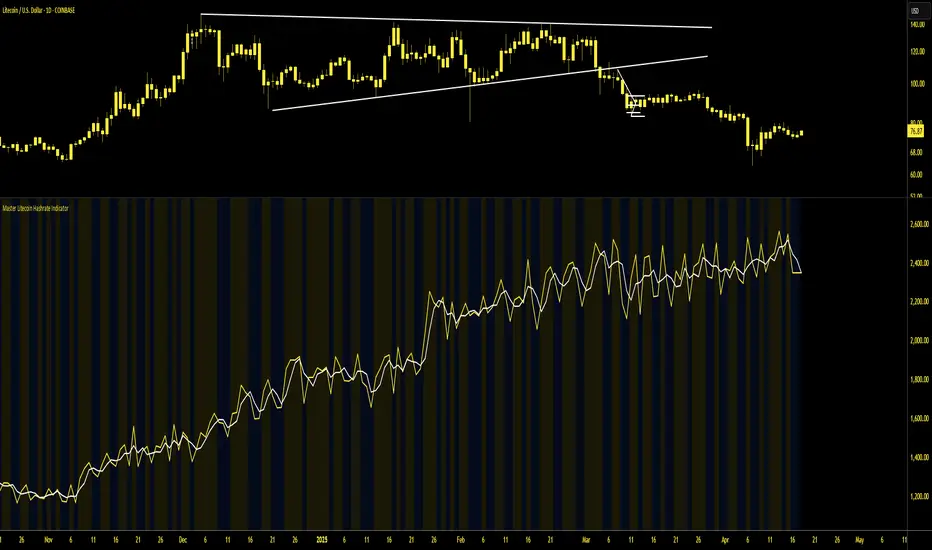
Master Litecoin Hashrate IndicatorThis script is a custom indicator called "Master Litecoin Hashrate Indicator," designed to track and visualize Litecoin's hashrate trends in the form of both a moving average and raw hashrate data. Here’s a breakdown of how it works:
Overview:
Indicator Type: It’s an overlay set to false, meaning it won’t be plotted directly on the price chart but on a separate pane beneath it.
Litecoin Hashrate: This tracks the computational power used to mine Litecoin, in PH/s (Peta Hashes per second).
Key Components:
Inputs:
ma_length: This is the length of the moving average, calculated as half of 7 (which equals 3.5), to smooth out the hashrate data.
Hashrate Data:
hashrate: The script pulls real-time Litecoin hashrate data using the INTOTHEBLOCK:LTC_HASHRATE security symbol from TradingView.
ma_hashrate: A simple moving average (SMA) is applied to the raw hashrate data over the defined period (ma_length), helping to smooth out short-term fluctuations.
Plotting:
hashrate: The raw hashrate is plotted in yellow with a linewidth of 2.
ma_hashrate: The moving average of the hashrate is plotted in white with a linewidth of 2.
Background Color:
The background color changes dynamically depending on the relationship between the raw hashrate and its moving average:
If the raw hashrate is greater than the moving average, the background turns a yellow color (with 90% transparency).
If the raw hashrate is less than the moving average, the background turns blue (with 90% transparency).
If they are equal, there is no background color change.
Purpose:
This indicator helps to visualize the current hashrate trends and compare them with the longer-term moving average. By doing so, it can highlight periods where the hashrate is either increasing or decreasing significantly, giving traders insights into network activity and mining strength.
4H Color Sync for 15m, 30m, 90m, 1H4H Time Theory Session Colour Sync
- session colour sync to lower timeframes
- highlighting the sessions of 4h candles
- using the fractal nature of 4h time theory and applying it to the 1h/15m/5m/1m chart
- option to change the colours of 3 PAIRS for the 4h timeframe candles
- automatically syncs to your timezone

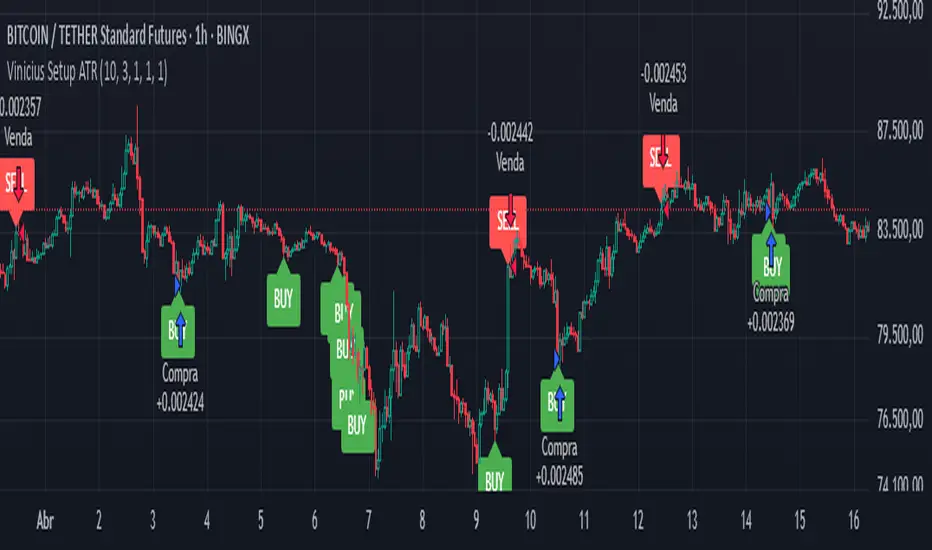
Vinicius Setup ATR
Description:
This script is a strategy based on the Supertrend indicator combined with volume analysis, candle strength, and RSI. Its goal is to identify potential entry points for buy and sell trades based on technical criteria, without promising profitability or guaranteed results.
Script Components:
Supertrend: Used as the main trend compass. When the trend is positive (direction = 1), buy signals are considered; when negative (direction = -1), sell signals are considered.
Volume: Entries are only validated if the volume is above the average of the last 20 candles, adjusted with a 1.2 multiplier.
Candle Body: The candle body must be larger than a certain percentage of the ATR, ensuring sufficient strength and volatility.
RSI: Used as a filter to avoid trades in extreme overbought or oversold zones.
Support and Resistance: Identified based on simple pivots (5 periods before and after).
Customizable Parameters:
ATR Length and Multiplier: Controls the sensitivity of the Supertrend.
RSI Period: Adjusts the relative strength filter.
Minimum Volume and Candle Body: Settings to validate entry signals.
Entry Conditions:
Buy: Positive trend + strong candle + high volume + RSI below 70.
Sell: Negative trend + strong candle + high volume + RSI above 30.
Exit Conditions:
The trade is closed upon the appearance of an opposite signal.
Notes:
This is a technical system with no profit guarantees.
It is recommended to test with realistic capital values and parameters suited to your risk management.
The script is not optimized for specific profitability, but rather to support study and the construction of setups with objective criteria.
LvlPrice levels for Nasdaq NQ
using NDX and QQQ Price levels and convert them daily to NQ
Levels derived from
Option Flow
Whales target
GEX Levels
0dtde Levels
Largest Sweeps
Darkpools

AstraeaAi IndicatorBinary Options Indicator
The indicator is based on the MACD, it gives short positions on a 1-minute timeframe for 4 minutes of the transaction, on a 30c timeframe for 2 minutes of the transaction.

5 Moving Averages Indicator5 Moving Averages Indicator
This indicator plots five customizable moving averages on the price chart, allowing traders to analyze multiple timeframes and trend layers simultaneously.
Each moving average can be set individually to SMA, EMA, or WMA.
All lengths are fully adjustable to fit different trading strategies.
Designed for traders who need to monitor short-term, medium-term, and long-term trends together.
Clean visual layout with color separation for clarity.
Use this tool to identify trend direction, potential crossover signals, and dynamic areas of support/resistance across different periods.
Ideal for scalping, day trading, and swing trading.
Disclaimer: This indicator is a tool to assist analysis and should not be considered financial advice. Always use with proper risk management.

Highlight Candle Body ≤ 10 Ticks (Clean & Subtle)Purpose:
This indicator highlights candlesticks where the body size (difference between open and close) is 10 ticks or less, specifically for instruments like Crude Oil futures (CL) where 1 tick = 0.01.
How it works:
It calculates the body size: abs(close - open)
If the body is ≤ 0.10 (10 ticks), the candle is softly colored in muted orange.
Wicks are ignored — only the body is considered.
No additional shapes or markers — clean and minimal.
Use case:
Helps identify periods of indecision or low momentum — such as potential pause candles, traps, or setups just before volatility returns.

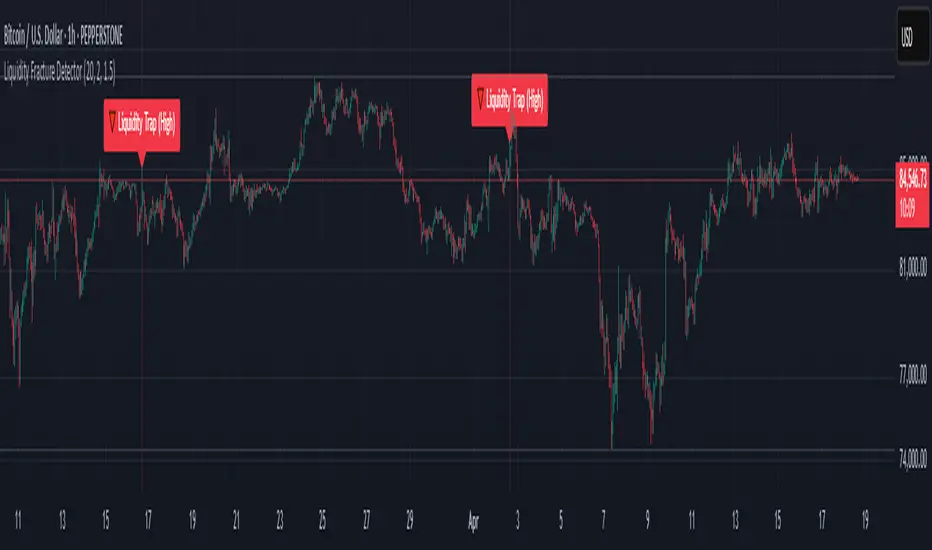
Liquidity Fracture DetectorThe Liquidity Fracture Detector is an advanced tool designed to identify micro-liquidity traps and structural fakeouts on intraday charts. These occur when the market appears to break out, only to quickly reverse — often triggered by stop hunts, inefficient fills, or manipulated order flow.
The script combines volume spikes, volatility anomalies, and price structure breaks to signal "fractures" — points where the market temporarily breaks its behavior, often followed by strong reversals or trend accelerations.
Detection logic in the script:
Volume spike greater than 2x the average (adjustable)
Volatility spike: candle range is > 1.5x the average
Extreme wicks: wick is larger than the candle body (a classic trap signal)
Structure break: price breaks previous high/low but closes back within the old range
Combine these elements → a “fracture” is marked
Visual representation:
Red background = potential bull trap (fake breakout to the upside)
Green background = potential bear trap (fake breakdown to the downside)
A label appears at each fracture: “Echo” with the number of previous hits
Ideal use cases:
Intraday trading (1m, 5m, 15m)
Crypto, indices, futures, and forex
Detecting reactive zones where the market takes a false direction
Confluence with S/R zones, order blocks, or liquidity pools
Fully customizable:
Volume and range sensitivity
Heatmap intensity
Toggle labels on/off
Note:
This script is intended to support discretionary analysis. It does not provide buy or sell signals and is not an automated strategy. Combine it with your own price action or order flow setup for optimal results.

Pivot detector🧠 Pivot Detector – Multi-condition Reversal Signal with Trend & Time Filters
This indicator is specifically optimized for Bitcoin trading, combining classic reversal patterns with volume, trend, and session filters.
🟢 Long signals:
- RSI crossing up from oversold (RSI < 30)
- MACD histogram crossing above zero
- Price touching the lower Bollinger Band with OBV reversal
- Bullish engulfing pattern + volume spike
🔴 Short signals:
- RSI crossing down from overbought (RSI > 70)
- MACD histogram crossing below zero
- Price touching upper Bollinger Band + OBV failure
- Bearish engulfing pattern + volume spike
⚙️ Additional filters:
- ❌ Signals are blocked during low-volatility range zones (ADX < 20 or narrow standard deviation)
- ✅ Longs only allowed during active hours: 00–02, 07–09, 13–15 UTC
- ✅ Shorts only triggered outside strong uptrend (ADX > 25 with DI+ dominance)
📊 Best used on:
- ✅ Bitcoin / BTCUSDT
- ✅ 15m, 30m, 1H, 4H charts
🎯 Strategy focus:
- Captures short-term reversals in volatile but trendable markets
- Filters out traps and low-quality signals during sideways conditions
- Best used with manual confirmation or as part of a composite system
Alerts are built-in for both long and short triggers.
⚠️ This tool is still in its experimental phase and may require further adjustments as it's tested and improved.

No Trading ZoneNo trading zone
This indicator highlights the time range between 03:00 and 11:00 UTC as a "danger zone" for trading.
Based on data-driven backtesting, this period consistently showed:
- High frequency of moving average (MA) crossovers without meaningful trend
- A high concentration of sideways market conditions
- Increased likelihood of false breakouts and stop-loss hunting
On average, strong directional trends tend to emerge after 12:00 UTC, especially between 12:00–15:00 UTC.
Avoiding trades during this time zone can help reduce exposure to low-probability setups and enhance strategy reliability.

Previous 5 Days High/Low (RTH)Absolutely! Here's a detailed explanation of each part of the Pine Script we just built. This script is designed for intraday charts (e.g., 5-min, 15-min, 1-hour) and shows the high and low of the 5th most recent trading day, based on NASDAQ regular trading hours (RTH), which are 9:30 AM to 4:00 PM (New York time).

ORB Strat with ATR calculated TargetsThis is a script That puts the ORB high and low from 10 15 30 or 60 minute TF and once broken to the upside or the downside will place targets calculated based on 4 10 minute candle ATRs.
The ORB H and L will only appear at 10 am EST

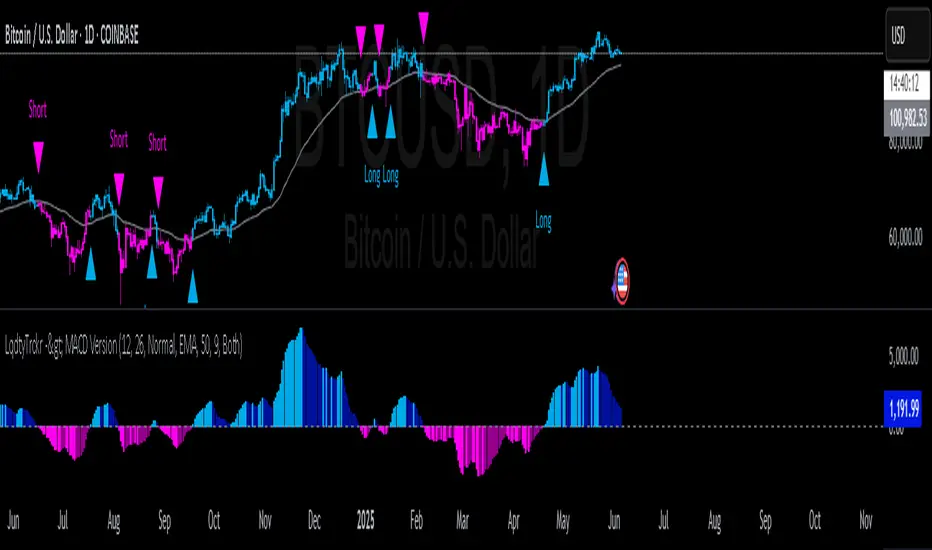
MACD Liquidity Tracker SystemMACD Liquidity Tracker System
🔹 Enhanced MACD with candle coloring, entry markers, and customizable signal logic.
🧠 Features:
This tool combines a color-coded MACD histogram with signal-based candle colors and small shape markers (🔼🔽) for clear market momentum and entry visualization.
📊 Visuals:
MACD Histogram (Sub-panel):
4 dynamic colors to show momentum direction:
🔹 Bright Blue = MACD > 0 & rising (strong bullish)
🔹 Dark Blue = MACD > 0 & falling (weakening bullish)
🔹 Bright Magenta = MACD < 0 & falling (strong bearish)
🔹 Dark Magenta = MACD < 0 & rising (weakening bearish)
Price Candles (Main Chart):
🔹 Bright Blue = Active Long signal
🔹 Bright Magenta = Active Short signal
Entry Markers:
🔼 Blue triangle (below candle) = Start of Long
🔽 Magenta triangle (above candle) = Start of Short
⚙️ System Types (select in settings):
Normal:
🔹 Long = MACD > 0
🔹 Short = MACD < 0
Fast: (Based on histogram color)
🔹 Long = Bright Blue OR Dark Magenta
🔹 Short = Dark Blue OR Bright Magenta
Safe:
🔹 Long = Only Bright Blue
🔹 Short = All other colors
🔔 Alerts:
Alerts trigger only on the first bar of a new Long/Short signal.
Easy to set up using TradingView’s alert system.
📌 How to Use:
Add the indicator to your chart
Open settings and select a System Type
Adjust MACD parameters if needed
Use histogram color + candle color for momentum and signal confirmation
Set alerts for clean entries if desired
💡 Ideal for traders seeking visual clarity and flexible MACD-based strategies.
Aviad SMC Flow🔹 Aviad SMC Flow – Smart Structure & Zones Indicator
A professional SMC-based indicator for identifying:
✅ BoS – Break of Structure
✅ CHoCH – Change of Character
✅ MSS – Market Structure Shift
✅ Automated Support & Resistance Zones
✅ Liquidity Grab and Reversal Points
✅ Market Structure with historical display
Optimized for 1H and lower timeframes.
Designed for real Smart Money Concepts (SMC) trading.
Perfect for intraday traders, swing traders, and scalpers.

Wick Anomaly DetectorWick Anomaly Detector
This script helps identify candles with unusually large wicks compared to their body size — a common sign of price anomalies, false prints, or low-liquidity moves.
🔍 What it does:
Flags candles with upper or lower wicks that exceed a user-defined ratio (default: 3x the body size)
Helps traders spot suspicious spikes or “bad ticks,” especially in pre-market or illiquid stocks
📈 Use it to:
Avoid fake breakouts
Confirm real price action
Clean up your technical analysis
Customize the wick-to-body threshold as needed. Add volume filters or time filters for more precision.
Created for educational purposes — use with proper risk management!
