Графические паттерны

Z-Score V2Z-Score Reversal Indicator for TradingView
Catch Overextended Trends & Potential Reversals Using Statistical Z-Scores
📌 Overview
This indicator calculates the Z-score of price movements, helping traders identify overbought and oversold conditions based on standard deviations from the mean.
Plots the Z-score (forest green line) to visualize momentum strength.
Key levels at ±1, ±2, ±3 standard deviations (dashed white lines) highlight potential reversal zones.
Customizable lookback period to adjust sensitivity.
Ideal for:
Mean-reversion strategies
Trend exhaustion detection
Breakout confirmation
📊 How It Works (The Math Behind It)
The Z-score measures how far the current price is from its mean, normalized by standard deviation.
🔹 Formula:
Z = (X − μ) / σ
X = Current price (or selected source)
μ = Simple Moving Average (SMA) over the lookback period
σ = Standard deviation over the lookback period
🎯 Trading Applications
Reversal Trading (Mean Reversion):
Short near +2 or +3 (expecting a pullback toward the mean).
Long near -2 or -3 (expecting a bounce toward the mean).
Trend Continuation (Breakout Confirmation):
If price breaks above +2 or +3, momentum may continue further.
If price breaks below -2 or -3, downtrend may accelerate.
Divergence Detection:
If price makes a new high but Z-score fails to reach prior highs, weakening momentum (bearish divergence).
If price makes a new low but Z-score fails to reach prior lows, potential bullish reversal.
⚙️ Customization Options
Adjustable Lookback Period – Modify sensitivity (shorter = more responsive, longer = smoother).
Source Selection – Apply to close, open, hl2, etc.
Clean Visuals – Plotlines do not distort scaling (only Z-score affects autofit).

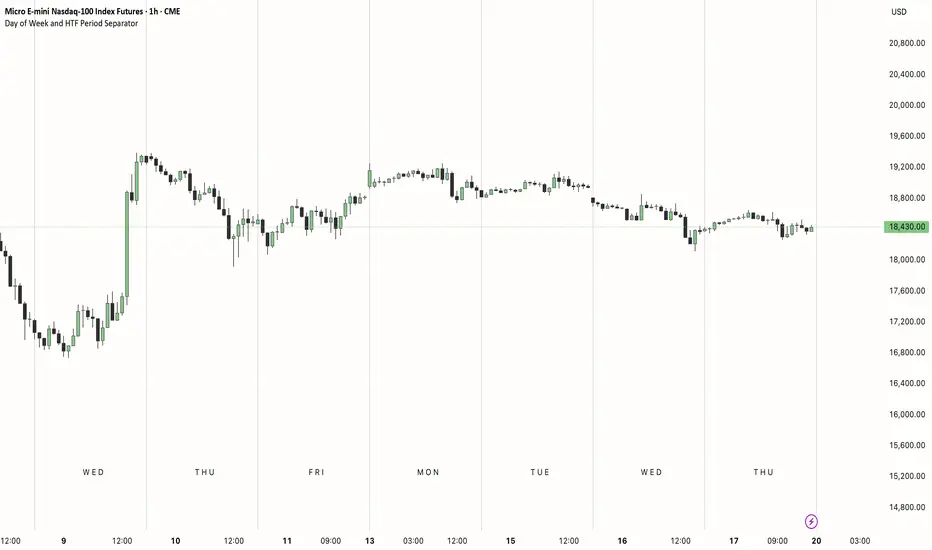
Day of Week and HTF Period SeparatorThis indicator displays vertical lines to separate each day of the week, along with optional 1H and 4H period separators. It also shows day-of-week labels (MON, TUE, etc.) at a specified hour for quick visual reference. Useful for intraday traders who want a clear view of daily and higher timeframe transitions.
Tinchy- MTF Extreme RSI Flowershow extreme RSI flowers on K-line when RSI value > 70 or <30
RSI 60 == 1h
RSI 240 == 4h
RSI 1440 == 1d

Estrategia EMAs + RSI + MACD con SL y TPestrategia con emas rei macd y sl y tp para conseguir exprimir el grafico. en pruebas

🟢🟥 Liquidity Grabs + Volumen Alto by ernesto[Crypto CLEAN]How does a Liquidity Grab work?
Pursuit of pending orders: In highly volatile markets, prices can move quickly to reach levels where there are many unexecuted orders. These orders can be stop-loss orders (which are being chased by the market), take-profit orders, or limit orders.
Market manipulation: In some cases, large market players, such as banks or financial institutions, can trigger these sharp price movements to capture liquidity and execute their trades at more favorable prices. This can generate a false price movement that appears to be going in one direction, but then quickly reverses.
Common causes: Liquidity grabs are common during times of low liquidity or when significant news events occur. They can also occur in consolidation ranges where the market is waiting for a "catalyst" to move.

Volume Range Profile with Fair Value (Zeiierman)// This work is licensed under a Attribution-NonCommercial-ShareAlike 4.0 International (CC BY-NC-SA 4.0) creativecommons.org
// © Zeiierman {
//@version=6
indicator("Volume Range Profile with Fair Value (Zeiierman)", overlay=true, max_boxes_count=200, max_lines_count=10, max_labels_count=10)
//~~}
//~~ Tooltips for Inputs {
var string t1 = "Defines how many historical bars to consider when calculating the highest high and lowest low for the volume range zones. A larger value creates broader zones and more stable volume profiles, while a smaller value reacts quicker to price shifts."
var string t2 = "Controls how much of the full price range (from high to low) is allocated for the volume zones. A smaller value makes zones narrower and more focused on extremes; a higher value widens the zones to capture more volume."
var string t3 = "Sets the number of horizontal volume bins in each zone. More bins give finer granularity, while fewer bins make the volume histogram more generalized. Increasing too much may impact performance."
var string t4 = "Color used to fill the upper (typically sell) volume zone background. Lower transparency means stronger visual emphasis."
var string t5 = "Color used to fill the lower (typically buy) volume zone background. Adjust transparency to make it more or less visible against chart elements."
var string t6 = "Color used for the most active bin (POC – Point of Control). This bin represents where the most volume was traded within the zone."
var string t7 = "Toggle to display a dashed midline inside each volume zone. Helps visually separate the upper and lower halves of each zone."
var string t8 = "Color for the zone midlines. A more visible color helps with separation, especially on dark or noisy charts."
var string t9 = "When enabled, adds a label showing the percentage of total zone volume that occurred inside the POC bin."
var string t10 = "When enabled, displays labels showing the total Buy or Sell volume accumulated in each respective zone. Useful for reading directional volume pressure directly on the chart."
//~~~~~~~~~~~~~~~~~~~~~~~~~~~~~~~~~~~~~~~~~~~~~~~~~~~~~~~~~~~~~~~~~~~~~~~~~~~~~~~~~~~~~~~~~~~~~~~~~~~~~~~~~~~~~~~~~~~~~}
// ~~ Inputs {
len = input.int(100, "Lookback Period", minval=2, group="Period & Zones", tooltip=t1)
zoneP = input.float(30.0, "Zone Width (% of Range)", minval=1, maxval=50, step=0.5, group="Period & Zones", tooltip=t2)
bins = input.int(10, "Bins per Zone", minval=1, maxval=50, group="Volume Profile", tooltip=t3)
clrUp = input.color(color.new(color.red, 80), "Upper Zone Color", group="Visuals", tooltip=t4)
clrLo = input.color(color.new(color.lime, 80), "Lower Zone Color", group="Visuals", tooltip=t5)
clrPOC = input.color(color.new(color.white, 0), "POC Bin Color", group="Visuals", tooltip=t6)
showMid = input.bool(true, "Show Zone Midline", group="Visuals", tooltip=t7)
clrMid = input.color(color.new(color.orange, 0), "Midline Color", group="Visuals", tooltip=t8)
showPOClbl = input.bool(true, "Show POC % Label", group="Visuals", tooltip=t9)
showTotlbl = input.bool(true, "Show Total Vol Label", group="Visuals", tooltip=t10)
lblClr = color.white
//~~~~~~~~~~~~~~~~~~~~~~~~~~~~~~~~~~~~~~~~~~~~~~~~~~~~~~~~~~~~~~~~~~~~~~~~~~~~~~~~~~~~~~~~~~~~~~~~~~~~~~~~~~~~~~~~~~~~~}
// ~~ Globals {
var array allBoxes = array.new_box(0)
var array allLines = array.new_line(0)
var array allLabels = array.new_label(0)
//~~~~~~~~~~~~~~~~~~~~~~~~~~~~~~~~~~~~~~~~~~~~~~~~~~~~~~~~~~~~~~~~~~~~~~~~~~~~~~~~~~~~~~~~~~~~~~~~~~~~~~~~~~~~~~~~~~~~~}
// ~~ Helpers {
f_formatVol(_v) =>
suf = ""
x = _v
if _v >= 1e9
suf := "B"
x := _v / 1e9
else if _v >= 1e6
suf := "M"
x := _v / 1e6
else if _v >= 1e3
suf := "K"
x := _v / 1e3
str.format("{0,number,#.###}{1}", x, suf)
f_clearDrawings() =>
for b in allBoxes
box.delete(b)
array.clear(allBoxes)
for l in allLines
line.delete(l)
array.clear(allLines)
for lb in allLabels
label.delete(lb)
array.clear(allLabels)
//~~~~~~~~~~~~~~~~~~~~~~~~~~~~~~~~~~~~~~~~~~~~~~~~~~~~~~~~~~~~~~~~~~~~~~~~~~~~~~~~~~~~~~~~~~~~~~~~~~~~~~~~~~~~~~~~~~~~~}
// ~~ Zone calculation with distributed volume + buy/sell per bin {
f_zone() =>
hh = ta.highest(high, len)
ll = ta.lowest( low, len)
rng = hh - ll
zh = rng * zoneP / 100
ut = hh
ub = hh - zh
lt = ll + zh
lbz = ll
bs = zh / bins
volsU = array.new_float(bins, 0.0)
volsL = array.new_float(bins, 0.0)
buyU = array.new_float(bins, 0.0)
sellU = array.new_float(bins, 0.0)
buyL = array.new_float(bins, 0.0)
sellL = array.new_float(bins, 0.0)
totU = 0.0
totL = 0.0
for i = 0 to len - 1
bh = high
bl = low
v = volume
isBuy = close >= open
// Upper zone overlap
if bh >= ub and bl <= ut
br = bh - bl
if br <= syminfo.mintick
price = hl2
if price >= ub and price <= ut
j = math.floor((ut - price) / bs)
j := math.min(math.max(j, 0), bins - 1)
array.set(volsU, j, array.get(volsU, j) + v)
if isBuy
array.set(buyU, j, array.get(buyU, j) + v)
else
array.set(sellU, j, array.get(sellU, j) + v)
totU := totU + v
else
for j = 0 to bins - 1
binT = ut - j * bs
binB = binT - bs
ov = math.min(bh, binT) - math.max(bl, binB)
if ov > 0
frac = ov / br
cvol = v * frac
array.set(volsU, j, array.get(volsU, j) + cvol)
if isBuy
array.set(buyU, j, array.get(buyU, j) + cvol)
else
array.set(sellU, j, array.get(sellU, j) + cvol)
totU := totU + cvol
// Lower zone overlap
if bh >= lbz and bl <= lt
br2 = bh - bl
if br2 <= syminfo.mintick
price = hl2
if price >= lbz and price <= lt
j2 = math.floor((price - lbz) / bs)
j2 := math.min(math.max(j2, 0), bins - 1)
array.set(volsL, j2, array.get(volsL, j2) + v)
if isBuy
array.set(buyL, j2, array.get(buyL, j2) + v)
else
array.set(sellL, j2, array.get(sellL, j2) + v)
totL := totL + v
else
for j2 = 0 to bins - 1
binB2 = lbz + j2 * bs
binT2 = binB2 + bs
ov2 = math.min(bh, binT2) - math.max(bl, binB2)
if ov2 > 0
frac2 = ov2 / br2
cvol2 = v * frac2
array.set(volsL, j2, array.get(volsL, j2) + cvol2)
if isBuy
array.set(buyL, j2, array.get(buyL, j2) + cvol2)
else
array.set(sellL, j2, array.get(sellL, j2) + cvol2)
totL := totL + cvol2
pocU = 0
pocL = 0
maxU = 0.0
maxL = 0.0
for j = 0 to bins - 1
u = array.get(volsU, j)
l = array.get(volsL, j)
if u > maxU
maxU := u
pocU := j
if l > maxL
maxL := l
pocL := j
//~~~~~~~~~~~~~~~~~~~~~~~~~~~~~~~~~~~~~~~~~~~~~~~~~~~~~~~~~~~~~~~~~~~~~~~~~~~~~~~~~~~~~~~~~~~~~~~~~~~~~~~~~~~~~~~~~~~~~}
// ~~ Main {
f_clearDrawings()
hh = ta.highest(high, len)
ll = ta.lowest( low, len)
if hh - ll <= syminfo.mintick * bins
runtime.error("Range too small")
= f_zone()
startBar = bar_index - len + 1
histW = math.round(len * 0.5)
rightB = startBar - 2
leftB = rightB - histW
zoneEnd = bar_index + 1
//~~~~~~~~~~~~~~~~~~~~~~~~~~~~~~~~~~~~~~~~~~~~~~~~~~~~~~~~~~~~~~~~~~~~~~~~~~~~~~~~~~~~~~~~~~~~~~~~~~~~~~~~~~~~~~~~~~~~~}
// Draw boxes {
bU = box.new(leftB, ut, zoneEnd, ub, border_color=na, bgcolor=clrUp)
bL = box.new(leftB, lt, zoneEnd, lbz, border_color=na, bgcolor=clrLo)
array.push(allBoxes, bU)
array.push(allBoxes, bL)
// Draw upper bins
pocVolU = totU > 0 ? array.get(volsU, pocU) : 0.0
for j = 0 to bins - 1
volj = array.get(volsU, j)
ratio = pocVolU > 0 ? volj / pocVolU : 0.0
wBars = math.max(1, math.ceil(histW * ratio))
x0 = math.max(leftB, rightB - wBars)
yT = ut - j * bs
yB = yT - bs
col = j == pocU ? clrPOC : color.new(clrUp, 50)
b = box.new(x0, yT, rightB, yB, border_color=color.new(color.red,30), bgcolor=col)
array.push(allBoxes, b)
// Draw lower bins
pocVolL = totL > 0 ? array.get(volsL, pocL) : 0.0
for j = 0 to bins - 1
volj = array.get(volsL, j)
ratio = pocVolL > 0 ? volj / pocVolL : 0.0
wBars = math.max(1, math.ceil(histW * ratio))
x0 = math.max(leftB, rightB - wBars)
yB2 = lbz + j * bs
yT2 = yB2 + bs
col2 = j == pocL ? clrPOC : color.new(clrLo, 50)
b2 = box.new(x0, yT2, rightB, yB2, border_color=color.new(color.lime,30), bgcolor=col2)
array.push(allBoxes, b2)
// Midlines
if showMid
mU = (ut + ub) / 2
mL = (lt + lbz) / 2
lnU = line.new(startBar, mU, zoneEnd, mU, color=clrMid, style=line.style_dashed)
lnL = line.new(startBar, mL, zoneEnd, mL, color=clrMid, style=line.style_dashed)
array.push(allLines, lnU)
array.push(allLines, lnL)
//~~~~~~~~~~~~~~~~~~~~~~~~~~~~~~~~~~~~~~~~~~~~~~~~~~~~~~~~~~~~~~~~~~~~~~~~~~~~~~~~~~~~~~~~~~~~~~~~~~~~~~~~~~~~~~~~~~~~~}
// ~~ Draw Total‑Volume Labels {
if showTotlbl
// Upper zone: total Sell volume
totalSellU = array.sum(sellU)
if totalSellU > 0
labU = label.new(
startBar + histW/2, ut + bs,
"Sell Vol: " + f_formatVol(totalSellU),
xloc = xloc.bar_index,
style = label.style_label_center,
color = color.red,
textcolor = color.white,
size = size.normal
)
array.push(allLabels, labU)
// Lower zone: total Buy volume
totalBuyL = array.sum(buyL)
if totalBuyL > 0
labL = label.new(
startBar + histW/2, lbz - bs,
"Buy Vol: " + f_formatVol(totalBuyL),
xloc = xloc.bar_index,
style = label.style_label_center,
color = color.green,
textcolor = color.white,
size = size.normal
)
array.push(allLabels, labL)
//~~~~~~~~~~~~~~~~~~~~~~~~~~~~~~~~~~~~~~~~~~~~~~~~~~~~~~~~~~~~~~~~~~~~~~~~~~~~~~~~~~~~~~~~~~~~~~~~~~~~~~~~~~~~~~~~~~~~~}
// ~~ Draw POC Vol % {
xLab = zoneEnd + 1
// Upper zone POC
if totU > 0
pvU = array.get(volsU, pocU)
bvU = array.get(buyU, pocU)
svU = array.get(sellU, pocU)
buyPctU = pvU > 0 ? bvU / pvU * 100 : 0
sellPctU = pvU > 0 ? svU / pvU * 100 : 0
totalPctU= pvU / totU * 100
txtU = "POC Vol: " +
"Buy " + str.format("{0,number,#.##}%", buyPctU) + " " +
"Sell " + str.format("{0,number,#.##}%", sellPctU) + " " +
"Total " + str.format("{0,number,#.##}%", totalPctU)
colU = buyPctU >= sellPctU ? color.green : color.red
labPOCU = label.new(
xLab, ut - (pocU + 0.5) * bs, txtU,
xloc = xloc.bar_index,
style = label.style_label_left,
color = colU,
textcolor = color.white,
size = size.small
)
array.push(allLabels, labPOCU)
// Lower zone POC
if totL > 0
pvL = array.get(volsL, pocL)
bvL = array.get(buyL, pocL)
svL = array.get(sellL, pocL)
buyPctL = pvL > 0 ? bvL / pvL * 100 : 0
sellPctL = pvL > 0 ? svL / pvL * 100 : 0
totalPctL = pvL / totL * 100
txtL = "POC Vol: " +
"Buy " + str.format("{0,number,#.##}%", buyPctL) + " " +
"Sell " + str.format("{0,number,#.##}%", sellPctL) + " " +
"Total " + str.format("{0,number,#.##}%", totalPctL)
colL = buyPctL >= sellPctL ? color.green : color.red
labPOCL = label.new(
xLab, lbz + (pocL + 0.5) * bs, txtL,
xloc = xloc.bar_index,
style = label.style_label_left,
color = colL,
textcolor = color.white,
size = size.small
)
array.push(allLabels, labPOCL)
//~~~~~~~~~~~~~~~~~~~~~~~~~~~~~~~~~~~~~~~~~~~~~~~~~~~~~~~~~~~~~~~~~~~~~~~~~~~~~~~~~~~~~~~~~~~~~~~~~~~~~~~~~~~~~~~~~~~~~}
// ~~ 6. POC‑volume trend line {
pocPrice = ut - (pocU + 0.5) * bs
avgPocPrice = ta.sma(pocPrice, len)
delta = avgPocPrice - avgPocPrice
lineColor = delta >= 0 ? color.green : color.red
//~~~~~~~~~~~~~~~~~~~~~~~~~~~~~~~~~~~~~~~~~~~~~~~~~~~~~~~~~~~~~~~~~~~~~~~~~~~~~~~~~~~~~~~~~~~~~~~~~~~~~~~~~~~~~~~~~~~~~}
// ~~ Plot {
plot(
avgPocPrice,
title = "Fair value - drifting over time.",
color = lineColor,
linewidth = 1,
style = plot.style_line
)
//~~~~~~~~~~~~~~~~~~~~~~~~~~~~~~~~~~~~~~~~~~~~~~~~~~~~~~~~~~~~~~~~~~~~~~~~~~~~~~~~~~~~~~~~~~~~~~~~~~~~~~~~~~~~~~~~~~~~~}

Enhanced Futures Multi-Signal StrategyThis is my second strategy indicator, please try to backtest and use it, hopefully it will be useful.

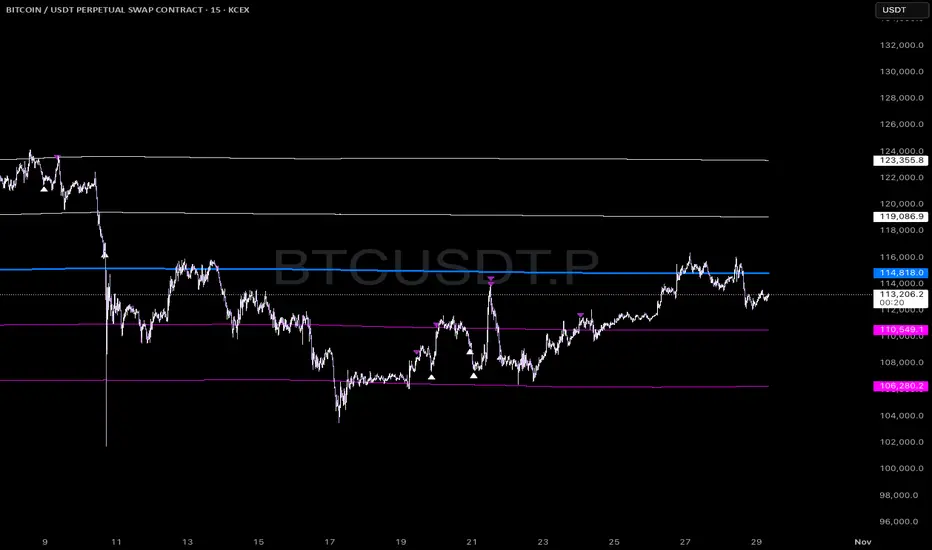
Bounty SeekerBounty Seeker - Advanced Market Structure & Order Block Detection
A sophisticated indicator that identifies high-probability reversal zones through the analysis of market structure, volume patterns, and institutional order blocks. This tool helps traders spot potential reversals and fake-outs with precision.
Core Components:
1. Pivot Detection System
• Smart pivot high/low identification
• Volume-enhanced confirmation
• RSI confluence validation
• Real-time market structure analysis
2. Order Block Detection
• Institutional buying/selling zones
• Historical support/resistance levels
• Smart volume threshold analysis
• Dynamic level adaptation
Signal Types:
1. Bull Pivots (White X)
• Strong volume confirmation
• RSI oversold conditions
• Price action validation
• Order block confluence
2. Bear Pivots (Purple X)
• Volume surge confirmation
• RSI overbought alignment
• Bearish price action
• Resistance zone validation
3. Fake Pivots (Orange X)
• Low volume warning signals
• Trap zone identification
• False breakout detection
• Risk management guide
Visual Elements:
• Dashed Lines: Order block zones
• White/Purple X's: Major pivot points
• Orange X's: Potential fake moves
• Dynamic support/resistance levels
Best Usage Practices:
• Most effective on 1H+ timeframes
• Focus on major market pairs
• Wait for complete signal formation
• Combine with trend direction
• Monitor volume confirmation
• Use proper position sizing
The indicator excels at:
1. Identifying potential reversal zones
2. Detecting institutional order blocks
3. Warning of potential fake moves
4. Providing clear entry/exit levels
5. Highlighting strong volume zones
Risk Management:
• Always wait for signal confirmation
• Use appropriate stop loss levels
• Consider multiple timeframe analysis
• Don't trade against major trends
• Monitor volume for validation
This indicator combines advanced market structure analysis with volume profiling to help traders identify high-probability trading opportunities while warning of potential traps and fake-outs.
Note: Past performance does not guarantee future results. Always use proper risk management techniques.

Head Hunter HHHead Hunter HH - Advanced Market Structure & Volume Analysis Indicator
This indicator combines volume analysis, price action, and VWAP to identify high-probability trading opportunities across multiple timeframes.
Key Features:
• Smart Volume Analysis: Detects institutional volume patterns using dynamic thresholds
• VWAP-Based Market Structure: Multiple standard deviation bands for precision entry/exit
• Daily Level Integration: Previous day's high, low, close, and current day's open
• Advanced Signal Classification: Regular, Super Strong, and Scalp signals
Signal Types:
1. Regular Signals (White/Purple Triangles)
• Volume-confirmed reversals
• Institutional price levels
• Technical momentum alignment
2. Super Strong Signals (Green/Red Diamonds)
• High-volume breakouts
• Strong momentum confirmation
• Multiple timeframe alignment
3. Scalp Signals (Green/Magenta Circles)
• Quick reversal opportunities
• VWAP deviation analysis
• Volume surge confirmation
Visual Components:
• VWAP with Standard Deviation Bands
• 50 MA (optional)
• Daily Reference Levels
• Color-coded signals based on strength
• Bar color changes on confirmed signals
Best Practices:
• Most effective on higher timeframes (1H+)
• Use with major pairs/instruments
• Combine signals with support/resistance
• Monitor volume confirmation
• Wait for candle close confirmation
This indicator helps identify institutional order flow and high-probability reversal zones by analyzing volume patterns, price action, and market structure, providing traders with multiple confirmation layers before entry.
Note: Results may vary based on market conditions and timeframe selection. Always use proper risk management.
Uptrick: Z-Score FlowAccording to author @Uptrick:
Uptrick: Z-Score Flow is a technical indicator that integrates trend-sensitive momentum analysis with the mean-reversion logic derived from Z-Score calculations. Its primary objective is to identify market conditions where price has deviated too far from its mean (overbought or oversold) or is within a statistically "normal" range, and then compare this observation with trend direction and RSI-based momentum signals. The result is a more contextual approach to trade entry and exit, prioritizing precision, clarity, and adaptability across different market regimes.
Introduction:
Financial instruments frequently shift between trending modes, where price extends strongly in one direction, and ranging modes, where price oscillates around a central value. A simple statistical measure like Z-Score can identify price extremes by comparing the current price to its historical mean and standard deviation. However, these extremes alone can be misleading if the overall market structure exhibits a strong trend. Uptrick: Z-Score Flow seeks to close this gap by combining Z-Score with an exponential moving average (EMA) trend filter and a smoothed RSI momentum check, thereby filtering out signals that contradict the prevailing market environment.
Objective:
The purpose of this script is to help traders identify mean reversion opportunities and trend-based pullbacks in a statistically sound manner, while still taking overall price action into account. By combining Z-Score thresholds with support conditions, the script reduces the likelihood of acting on random price rises or falls and instead focuses on significant movements within historical and current contextual frameworks.
Originality and Uniqueness:
Layered Signal Check: Signals require compliance with multiple layers (Z-Score extreme, EMA trend skew, and RSI momentum stance) rather than simply exceeding a statistical threshold.
RSI Zone Lock: Once the RSI enters an overbought/oversold zone and triggers a signal, the script blocks subsequent signals until the RSI recovers above or below those zones, limiting consecutive triggers.
Controlled Cooldown: A dedicated cooldown mechanism ensures that the script waits a specific number of bars before issuing a new signal in the opposite direction.
Gradient-Based Visualization: The distinct gradient fills between the price and the Z-Mean line improve readability, showing at a glance whether the price is trading above or below its statistical mean.
Comprehensive Metrics Panel: An optional table on the chart summarizes key Z-Score metrics, streamlining the process of verifying current statistical extremes, average levels, and momentum directions.
Why were these indicators merged? Z-Score metrics are excellent for identifying when the price deviates from its mean, but they don't intrinsically reveal whether the market's trajectory supports a reversal or whether the price could continue its trend. The EMA, commonly used to detect trend direction, offers valuable insight into whether the price is predominantly upward or downward. However, relying solely on a trend filter overlooks the intensity of price movements. The RSI adds a specific measure of momentum, helping to confirm whether market energy aligns with a potential reversal (e.g., the price is statistically low, but the RSI suggests imminent bullish momentum). By combining these three perspectives (Z-score for statistical context, the EMA for trend direction, and the RSI for momentum strength), the script offers a more comprehensive and adaptable system, aiming to avoid false positives caused by focusing on a single aspect of price behavior.
Calculations
The main calculation begins with a simple moving average (SMA) of the price over zL bars, called the base. The script then calculates the standard deviation of the price in the same window. Dividing the difference between the current price and the base price by this standard deviation gives the Z-score, which indicates how many standard deviations the price is from its mean. A positive Z-score indicates that the price is above its mean. A negative reading indicates the opposite.

Highlight Candle Body ≤ X Ticks (Customizable)🟠 Indicator Name: Highlight Candle Body ≤ X Ticks (Customizable)
Purpose:
Highlights candles where the body size (|open - close|) is less than or equal to a user-defined number of ticks — useful for spotting low-momentum or indecision candles across different futures instruments.
Features:
✅ Works with any instrument (CL, NG, HG, etc.)
🔧 Customizable tick size and max tick count
🎨 Adjustable highlight color
📏 Only measures the candle body, ignoring wicks
Use case:
Quickly identifies small-body candles that may signal pauses, traps, or setups before potential moves — especially helpful in volume-based or structure-based trading strategies.

High/Low Day + OperacionaisThis TradingView indicator plots the high and low of the current trading day with solid horizontal lines and corresponding labels. Additionally, it offers the option to display two sets of dashed horizontal lines based on user-defined distances from the day's high and low.
**Key Features:**
* **Current Day's High and Low:** Clearly marks the highest and lowest price reached so far during the current trading day with solid green and red lines, respectively, accompanied by "High Day" and "Low Day" labels.
* **Operational Levels:** Provides two independent operational setups with customizable distances and visibility:
* **Operational 01:** Plots a pair of dashed lines at a specified positive distance above the day's high and a negative distance below the day's low. This is configured using the "Distância Op. 01 (Pontos)" and "Mostrar Op. 01 (+/- Distância)" settings, with a customizable color ("Cor Op. 01").
* **Operational 02:** Plots another pair of dashed lines at a specified negative distance below the day's high and a positive distance above the day's low. This is configured using the "Distância Op. 02 (Pontos)" and "Mostrar Op. 02 (-/+ Distância)" settings, with a customizable color ("Cor Op. 02").
* **Customizable Distances:** Users can independently define the distance in points for each operational setup.
* **Individual Visibility:** Users can choose to show or hide each operational setup independently.
* **Color Options:** Users can customize the color of the dashed lines for each operational setup.
* **"Show Current Day Lines" Toggle:** A simple option to turn the display of the current day's high and low lines and labels on or off.
**How it Works:**
The indicator detects the start of a new trading day based on the chart's timeframe. It then tracks the highest and lowest prices reached within that day. The solid lines and labels for the day's high and low are updated dynamically as new highs or lows are made. The dashed lines for each operational level are calculated based on the configured distances from the current day's high and low and are also updated in real-time.

Volume Range Profile with Fair Value (SWAROOPRAM29)This indicator overlays a custom volume profile across two dynamic price zones (upper and lower) within a defined lookback range. It highlights the Point of Control (POC) for each zone — the price level with the highest traded volume — and tracks its movement over time to help identify fair value areas.
🔍 Features:
Dynamic Volume Zones: Automatically calculates upper/lower zones based on a % of the high-low range.
Granular Volume Distribution: Visualizes buy/sell volume using histogram bins inside each zone.
Point of Control (POC): Shows the most active volume bin with optional percentage breakdown (Buy %, Sell %, Total).
Fair Value Drift Line: Plots a moving average of POC to track fair value shifts.
Total Volume Labels: Optionally display total buy/sell volume in each zone.
Trade Entry Logic (Strategy):
Entry on POC touch or midline level.
Supports long, short, or both directions.
Customizable take profit and stop loss levels.
This tool helps traders spot high-volume price acceptance areas, potential reversals, and trend continuations based on volume-weighted logic — ideal for scalping, swing, and volume-based strategies.
brings Smart Money Concept (ICT) session logic to life by plotting key global trading sessions with volume and delta analytics. It not only highlights session ranges but also tracks their midpoints — which often act as intraday support/resistance levels.
KEY FEATURES
Visual session boxes: Plots boxes for Tokyo, London, New York, and Sydney sessions based on user-defined UTC+0 time ranges.
Volume & delta metrics: Displays total volume and delta volume (buy–sell difference) within each session.
Mid, High & Low Range Extension: Once a session ends, the high, low, and midpoint levels automatically extend — ideal for detecting SR zones.
Session labels: Each box includes a label with session name, time, volume, and delta for quick reference.
Custom session control: Enable or disable sessions individually and configure start/end times.
Clean aesthetics: Transparent shaded boxes with subtle borders make it easy to overlay without clutter.
Sessions Dashboard: Shows the time range of each session and tells you whether the session is currently active.
🔵 USAGE
Enable the sessions you want to monitor (e.g., New York or Tokyo) from the settings.
Use session volume and delta values to gauge the strength and direction of institutional activity.
Watch for price interaction with the extended range — it often acts as dynamic support/resistance after the session ends.
Overlay it with liquidity tools or breaker blocks for intraday strategy alignment.
🔵 EXAMPLES
Extended Future Range acted as resistance/support.

Jack's ADX with 5TF TABLEUpdated the table to show 5 timeframes.
When trend momentum aligns for added confirmation

🔍 Phat hien Spring Wyckoff (hien thi sau 1 nen)//@version=5
indicator("🔍 Phat hien Spring Wyckoff (hien thi sau 1 nen)", overlay=true)
// === Tham so nguoi dung ===
lookbackSupport = input.int(50, "Tim ho tro trong X nen", minval=5)
volumeLookback = input.int(20, "So nen tinh volume trung binh", minval=1)
volMultiplier = input.float(1.5, "Nguong volume cao bat thuong", step=0.1)
showSupportLine = input.bool(true, "Hien thi duong ho tro")
// === Tim day gan nhat lam ho tro ===
lowestLow = ta.lowest(low, lookbackSupport)
// === Tinh volume trung binh ===
avgVol = ta.sma(volume, volumeLookback)
// === Dieu kien Spring (o cay nen hien tai) ===
isSpringNow = low < lowestLow and close > lowestLow and volume > avgVol * volMultiplier
// === Tri hoan tin hieu 1 nen de hien thi chu o cay ke tiep ===
isSpringPrev = isSpringNow
// === Hien thi chu "Spring" o cay nen ke tiep ===
plotshape(isSpringPrev, style=shape.labelup, location=location.belowbar, color=color.green, size=size.small, text="Spring", textcolor=color.white)
// === Ve duong ho tro mau tim, dam ===
plot(showSupportLine ? lowestLow : na, title="Ho tro", color=color.purple, linewidth=2, style=plot.style_line)


200/800 EMA Retest StrategyWe don't chase every EMA cross. We wait for the market to prove it's ready by pulling back to the 200 EMA — and then we strike, with smart risk control.

ballenas by ErnestoWhat does this indicator do?
High Volume:
Calculates the average volume of the last n candles (configurable).
Marks candles with volume greater than the average multiplied by a factor (adjustable).
Candle Body:
Marks candles with a large body compared to their range (adjustable ratio).
Direction:
Green circle (buy): When the candle is bullish (close > open) and meets high volume and a large body.
Red circle (sell): When the candle is bearish (close < open) with high volume and a large body.
Automatic alerts: You will receive an alert when an institutional buy or sell is detected.
📊 How to use it?
Open the Pine Editor in TradingView.
Copy and paste this code.
Click Save and then Add to Chart.
Configure alerts according to your needs.
With this, you'll have a real-time indicator that displays circles on the candle itself when large volume purchases or sales are detected.

Supertrend Hombrok BotSupertrend Hombrok Bot – Automated Trading Strategy for Dynamic Market Conditions
This trading strategy script has been developed to operate automatically based on detailed market conditions. It combines the popular Supertrend indicator, RSI (Relative Strength Index), Volume, and ATR (Average True Range) to determine the best entry and exit points while maintaining proper risk management.
Key Features:
Supertrend as the Base: Uses the Supertrend indicator to identify the market's trend direction, generating buy signals when the market is in an uptrend and sell signals when in a downtrend.
RSI Filter: The RSI is used to determine overbought and oversold conditions, helping to avoid entries in extreme market conditions. Entries are avoided when RSI > 70 (overbought) and RSI < 30 (oversold), reducing the risk of false movements.
Volume Filter: The strategy checks if the trading volume is above the average multiplied by a user-defined factor. This ensures that only significant movements, with higher liquidity, are considered.
Candle Body Size: The strategy filters only candles with a body large enough relative to the ATR (Average True Range), ensuring that the price movements on the chart have sufficient strength.
Risk Management: The bot is configured to operate with an adjustable Risk/Reward Ratio (R:R). This means that for each trade, both Take Profit (TP) and Stop Loss (SL) are adjusted based on the market's volatility as measured by the ATR.
Automatic Entries and Exits: The script automatically executes entries based on the specified conditions and exits with predefined Stop Loss and Take Profit levels, ensuring risk is controlled for each trade.
How It Works:
Buy Condition: Triggered when the market is in an uptrend (Supertrend), the volume is above the adjusted average, the candle body is strong enough, and the RSI is below the overbought level.
Sell Condition: Triggered when the market is in a downtrend (Supertrend), the volume is above the adjusted average, the candle body is strong enough, and the RSI is above the oversold level.
Alerts:
Buy and Sell Alerts are configured with detailed information, including Stop Loss and Take Profit values, allowing the user to receive notifications when trading conditions are met.
Capital Management:
The capital per trade can be adjusted based on account size and risk profile.
Important Note:
Always test before trading with real capital: While the strategy has been designed based on solid technical analysis methods, always perform tests in real-time market conditions with demo accounts before applying the bot in live trading.
Disclaimer: This script is a tool to assist in the trading process and does not guarantee profit. Past performance is not indicative of future results, and the trader is always responsible for their investment decisions.

Custom Time Range Boxes + Fibs + ExtensionThis script draws two customizable time-range boxes per day, helping traders visualize key market sessions or activity windows. Each box is defined by start and end times that can be adjusted in the settings. You can also choose a custom color and extend the visual width of the box independently from the actual session time. Within each box, the indicator plots three Fibonacci levels: 0.3, 0.5, and 0.7. These levels are useful for identifying potential support, resistance, or retracement zones inside the session range. The script supports two separate time blocks, allowing you to track sessions like the New York Open and Power Hour simultaneously. All lines and boxes are drawn using bar_index for precision and control. The levels and box colors match for visual consistency. Perfect for intraday traders who want to track price behavior around key times. Clean, minimal, and performance-friendly — this tool adds clarity to your session-based strategy.

Break of Structure & Change of CharacterThis Break of Structure & Change of Character indicator is a fully customizable Pine Script v6 tool designed to help you spot key market structure shifts on any timeframe (optimized by default for 5‑minute charts). Here’s what it does and how to tailor it:
What It Detects
Swing Pivots
Finds local swing highs and lows over a configurable lookback (Pivot Lookback).
Break of Structure (BOS)
Marks when price closes beyond the last swing high (bullish BOS) or below the last swing low (bearish BOS), using an ATR‑based buffer to filter out minor moves.
Change of Character (CHoCH)
After a BOS, watches for price to reverse back through that level (e.g. a drop below the higher‑low after a bullish BOS), signaling a potential shift in momentum.
Key Inputs & Features
Pivot Lookback (pivotLen): How many bars to look back for pivots (default 8 for a 5‑min chart).
Fast Mode: When enabled, halves both the pivot lookback and ATR threshold for quicker—but noisier—signals.
ATR Threshold (atrLen & atrMult): Uses ATR(atrLen) × atrMult to require a minimum follow‑through beyond the pivot for a valid BOS/CHoCH.
Show Labels / Show Pivot Labels: Toggle on/off all structure labels or just pivot “x” markers.
Appearance Customization
Colors: Choose separate colors for pivot highs/lows, BOS labels, CHoCH labels, and structure lines.
Line Style: Select “Solid”, “Dotted”, or “Dashed” for your swing‑level lines.
Label Size & Style: Pick “Tiny”, “Small”, or “Normal” text size and choose label orientation (Up/Down/Left/Right) independently for pivots, BOS, and CHoCH.
Pivot Label Text: Change the pivot marker from the default “x” to any character you prefer.
How to Use
Add to Chart: Apply it on a 5‑minute chart (you’ll get a one‑time notice if you’re on another timeframe).
Tweak Inputs: Adjust pivot lookback, ATR multiplier, and toggle Fast Mode to suit your style.
Interpret Signals:
Green “BOS↑” or red “BOS↓” labels mark structure breaks.
Orange “CHoCH↓” or “CHoCH↑” labels flag the reversal through that level.
Dotted (or styled) lines trace the last swing high/low for visual reference.

Multi-Level Bollinger BandsAllows to identify SD targets from mean to properly identify exit and entry areas as well as potential reversal areas.
