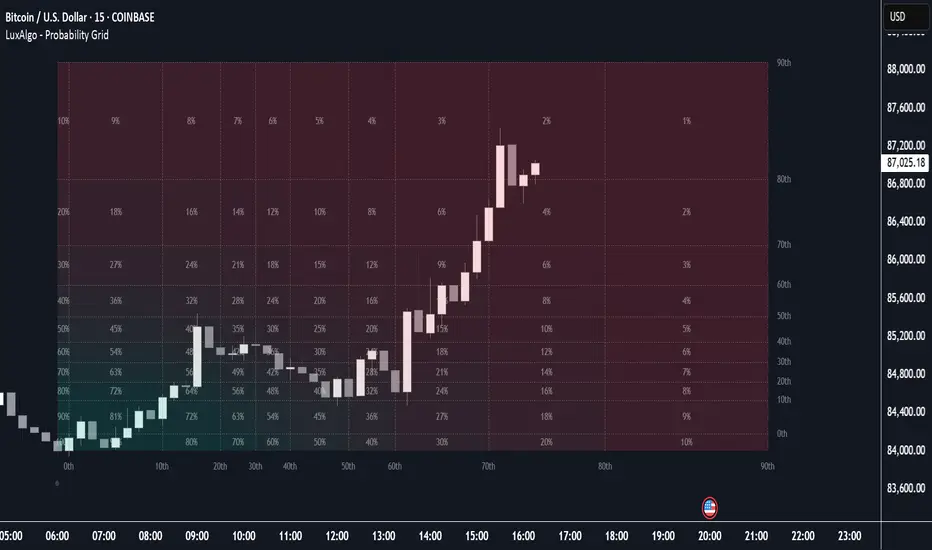
Probability Grid [LuxAlgo]The Probability Grid tool allows traders to see the probability of where and when the next reversal would occur, it displays a 10x10 grid and/or dashboard with the probability of the next reversal occurring beyond each cell or within each cell.
🔶 USAGE
By default, the tool displays deciles (percentiles from 0 to 90), users can enable, disable and modify each percentile, but two of them must always be enabled or the tool will display an error message alerting of it.
The use of the tool is quite simple, as shown in the chart above, the further the price moves on the grid, the higher the probability of a reversal.
In this case, the reversal took place on the cell with a probability of 9%, which means that there is a probability of 91% within the square defined by the last reversal and this cell.
🔹 Grid vs Dashboard
The tool can display a grid starting from the last reversal and/or a dashboard at three predefined locations, as shown in the chart above.
🔶 DETAILS
🔹 Raw Data vs Normalized Data
By default the tool displays the normalized data, this means that instead of using the raw data (price delta between reversals) it uses the returns between each reversal, this is useful to make an apples to apples comparison of all the data in the dataset.
This can be seen in the left side of the chart above (BTCUSD Daily chart) where normalize data is disabled, the percentiles from 0 to 40 overlap and are indistinguishable from each other because the tool uses the raw price delta over the entire bitcoin history, with normalize data enabled as we can see in the right side of the chart we can have a fair comparison of the data over the entire history.
🔹 Probability Beyond or Within Each Cell
Two different probability modes are available, the default mode is Probability Beyond Each Cell, the number displayed in each cell is the probability of the next reversal to be located in the area beyond the cell, for example, if the cell displays 20%, it means that in the area formed by the square starting from the last reversal and ending at the cell, there is an 80% probability and outside that square there is a 20% probability for the location of the next reversal.
The second probability mode is the probability within each cell, this outlines the chance that the next reversal will be within the cell, as we can see on the right chart above, when using deciles as percentiles (default settings), each cell has the same 1% probability for the 10x10 grid.
🔶 SETTINGS
Swing Length: The maximum length in bars used to identify a swing
Maximum Reversals: Maximum number of reversals included in calculations
Normalize Data: Use returns between swings instead of raw price
Probability: Choose between two different probability modes: beyond and inside each cell
Percentiles: Enable/disable each of the ten percentiles and select the percentile number and line style
🔹 Dashboard
Show Dashboard: Enable or disable the dashboard
Position: Choose dashboard location
Size: Choose dashboard size
🔹 Style
Show Grid: Enable or disable the grid
Size: Choose grid text size
Colors: Choose grid background colors
Show Marks: Enable/disable reversal markers
Графические паттерны
Next Candle PredictorNext Candle Predictor for TradingView
This Pine Script indicator helps predict potential price movements for the next candle based on historical price action patterns. It analyzes recent candles' characteristics including body size, wick length, and volume to calculate a directional bias.
Key Features
Analyzes recent price action to predict next candle direction (Bullish, Bearish, or Neutral)
Visual indicators include small directional arrows and a prediction line
Customizable sensitivity and lookback period
Works best on lower timeframes for short-term price action trading
Displays clear prediction labels that extend into future bars
How It Works
The script analyzes recent candles by examining:
Candle body size (weighted by your preference)
Wick length (weighted by your preference)
Volume activity (weighted by your preference)
These factors combine to create a directional strength indicator that determines if the next candle is likely to be bullish, bearish, or neutral.
Visual Feedback
Green up arrows indicate bullish predictions
Red down arrows indicate bearish predictions
A directional line extends from the last candle showing predicted price movement
A label displays the prediction text at the end of the line
Information table in the top right displays the current prediction
Settings
Lookback Candle Count: Number of historical candles to analyze (2-20)
Wick/Body/Volume Weight Factors: Adjust importance of each component
Prediction Sensitivity: Threshold for triggering directional bias
Prediction Line Length: How far the prediction line extends
Perfect for day traders and scalpers looking for an edge in short-term directional bias.

Liquidity Compression Coil (6 Lines, 8‑Bar Breakout)TL;DR:
🔍 Pivot Detection: Scans for swing highs and lows (using a customizable lookback) to mark key support/resistance levels.
🧱 Zone Calculations:
Anchor Range (🧱): Base zone (gray) defined by historical pivots, with its label always at the top.
Projection Bracket (🎯): Active zone (black) that forecasts immediate breakout areas, with its label centered.
Volatility Span (🌪️): Overall range (purple) that captures the market's full movement, with its label fixed at the bottom.
📊 Dynamic Tracker: Displays the current price as a percentage of the projection bracket—mimicking Fibonacci extensions (e.g., 120%, 200%, or -20% when breaking below).
⚠️ Alerts: Breakout (above 100%) and breakdown (below 0%) alerts pop up dynamically, following the position metric so they never overlap.
🐂/🐻 Sentiment Tags: Adds bullish (🐂) or bearish (🐻) emojis based on price position relative to the projection bracket.
🔄 Composite Bars & Volume: Visually stacks the three zones in a fixed order (purple behind, gray in the middle, black on top) and optionally accumulates volume for enhanced context.
This indicator provides a human-friendly, emoji-enhanced snapshot of liquidity compression and potential breakout moves with nuanced visual layers and dynamic alerts.

Supply & Demand with Candle SignalsUnlock the power of Supply & Demand Zones combined with high-probability Bullish/Bearish Engulfing patterns to spot strong market reversals and trends. This strategy helps identify key price levels where major market moves are likely to occur. By using Engulfing candlesticks within these zones, you can make more informed and accurate trading decisions, enhancing your chances of success. Ideal for traders looking for a robust technical approach to maximize market opportunities.

Unusual Whale - Unusual Options Volume Data ScreenerHow to Use:
Custom Expiration Date: Use the calendar/date picker to select the expiration date. The chosen date is automatically converted to the "YYMMDD" format.
Custom Base Strike: Enter a round strike value from the options chain (for example, "270"). This value serves as the starting point (at-the-money) for the scan.
Strike Increment: Select the increment (e.g., 0.50, 1.00, 2.5, 5, or 10) to determine how the scan moves outward from the custom base strike.
Options per Side (Max 20): Choose the number of valid option strikes to scan on each side. The script scans downward (for calls) and upward (for puts) from the custom base strike.
Base Symbol: The base symbol is always taken from the chart (using syminfo.ticker); no manual entry is needed.
Scanning & Aggregation: The script automatically constructs option symbols using the base symbol, custom expiration date, option type (C or P), and the formatted strike. It retrieves volume data for these options and aggregates the cumulative volume for calls and puts separately.
Plotting: Cumulative call volume is plotted in green, and cumulative put volume is plotted in red—only if the required number of valid options is found.
Benefits of Scanning Options Volume for Unusual Activity:
Offers a comprehensive view of volume across multiple strikes, making unusual or extreme volume patterns easier to detect.
Helps gauge market sentiment by comparing aggregated call and put volumes, which may signal shifts in investor behavior.
Aggregating volume from several strike levels provides smoother, more reliable data than using a single strike, enhancing your analytical insights.
What to Do If Combinations Don't Yield Results:
Verify Your Inputs: Ensure that the Custom Base Symbol, Expiration Date, and Custom Base Strike are entered correctly and correspond to an active options chain.
Adjust Strike Increment: If the options aren’t loading as expected, try selecting a different strike increment that more closely matches the spacing in your options chain.
Reduce Options per Side: Lower the number of Options per Side (e.g., from 20 to a lower value) if the scan fails to find enough valid strikes.
Review Your Options Chain: Confirm that the contracts for the specified expiration and strike range exist and are available in your data feed.
Check Data Subscription: Make sure your TradingView plan includes access to the options data required for the selected symbols.
Cumulative Call Volume is Green, Put Volume is Red

Scalping 15min: EMA + MACD + RSI + ATR-based SL/TPThis is a multi-indicator scalping strategy optimized for 15-minute charts that combines trend, momentum, and volatility indicators for high-probability trades with automated risk management.
Core Trading Logic
The strategy identifies market opportunities using three powerful technical indicators:
EMA (50): Acts as a trend filter to determine overall market direction
MACD (12, 26, 9): Measures momentum and confirms trend direction
RSI (14): Identifies potential reversal zones and avoids overbought/oversold traps
Entry Conditions
Long (Buy) Signal: Price above EMA + positive MACD histogram + RSI between 50-70
Short (Sell) Signal: Price below EMA + negative MACD histogram + RSI between 30-50
Dynamic Risk Management
What sets this strategy apart is its adaptive risk management using ATR (Average True Range):
Stop Loss: Automatically calculated at 1x ATR from entry price
Take Profit: Set at 2x ATR, creating a consistent 1:2 risk-to-reward ratio
Position Sizing: Defaults to 10% of equity per trade for conservative account growth

Dkoderweb repainting issue fix indicator# Harmonic Pattern Trading Indicator for TradingView
This indicator, called "Dkoderweb repainting issue fix indicator," is designed to identify and trade harmonic chart patterns in financial markets. It uses Fibonacci relationships between price points to detect various patterns like Bat, Butterfly, Gartley, Crab, Shark, and others.
## Key Features:
- **Pattern Recognition**: Automatically identifies over a dozen harmonic patterns including standard and anti-patterns
- **Customizable Settings**: Options to use Heikin Ashi candles and alternate timeframes
- **Fibonacci Levels**: Configurable display of key Fibonacci retracement levels
- **Entry and Exit Signals**: Clear buy/sell signals with visual triangles above/below bars
- **Trade Management**: Automatic take-profit and stop-loss levels based on Fibonacci relationships
- **Visual Aids**: Color-coded backgrounds to highlight active trade zones
- **Alert System**: Customizable alert messages for trade entries and exits
## How It Works:
The indicator uses a zigzag function to identify significant price pivots, then analyzes the relationships between these pivots to detect specific harmonic patterns. When a valid pattern forms and price reaches the entry zone (defined by a Fibonacci level), the indicator generates a trade signal.
Each pattern has specific Fibonacci ratio requirements between its points, and the indicator continuously scans for these relationships. Trade management is handled automatically with predefined take-profit and stop-loss levels.
This version specifically addresses repainting issues that are common in pattern-detection indicators, making it more reliable for both backtesting and live trading.

Crypto Investing StrategyStrategy to invest in Crypto and any long term growing asset class.
Features
Investing start time
Investing end time
RSI value to buy (should be below 50)
RSI value to sell (should be above 70)
RSI value for overbought confirmation (should be above 70)
Exit percentage (what % to exit from portfolio)


Breakout Trading Rules📄 Breakout Trading Rules – Confirmed Entry Logic
This open-source indicator helps identify confirmed bullish breakouts using a combination of price action and technical filters. It is designed for traders who prefer rule-based entries and want to visually track confirmation signals on the chart.
🧠 Core Logic
A BUY signal is confirmed only when all of the following conditions are met:
Price breaks above a key breakout level, which can be:
The most recent pivot high (automatically detected), or
A manually set level (if override is enabled).
The breakout is confirmed by two consecutive closes above the level.
Volume is above a reference average (user-defined period).
MACD is bullish (MACD line > signal line).
RSI is above a custom threshold (default is 50).
📊 What the Script Displays
A dynamic horizontal breakout line on the chart (green if price is above, red if below).
A "BUY" label plotted on the candle when all entry conditions are satisfied.
A compact checklist table in the top-right corner showing the real-time status of all entry conditions.
An alert that triggers when the breakout and all confirmations are active.
Option to manually set the breakout level for more control.
⚙️ Inputs You Can Customize
Pivot lookback period
Volume comparison lengths
RSI threshold
Manual override for breakout level
✅ Intended Use
This tool supports users in identifying confirmed breakout entries by combining simple price action with confirmation from volume and momentum indicators. It is most suitable for daily timeframe (1D) setups, but it works on other timeframes as well.
⚠️ Important Notes
This script does not repaint, and all signals are calculated using historical bar closes.
It is not a strategy, but a visual aid for discretionary entries based on clearly defined rules.
No indicator should be used in isolation. Always combine with broader market context and proper risk management.

Enhanced Bollinger Bands (EBB) + Dyn. Fun# Enhanced Bollinger Bands (EBB) + Dynamic Fun Character for TradingView
**Author:** Gemini AI (Conceptualized by a Senior SWE/FinAnalyst Persona)
**Date:** 2025-04-09
**Version:** 1.4
## Overview
This TradingView Pine Script indicator provides a significantly enhanced version of the standard Bollinger Bands (BB) combined with a fun, dynamic character element for at-a-glance visualization of the current price action.
It offers greater flexibility in calculating the Bollinger Bands by allowing user selection of the Moving Average type and price source. Additionally, it includes visual aids like volatility squeeze highlighting, band filling, and band cross labels, along with configurable alerts.
The unique "Dynamic Fun Character" feature displays an emoji next to the current real-time candle, changing its expression based on the candle's direction (up, down, or neutral), providing an intuitive visual cue for market sentiment on the very latest bar.
## Core Concepts
* **Bollinger Bands (BB):** A volatility indicator consisting of:
* **Basis Line:** A moving average (SMA, EMA, etc.) representing the middle price range.
* **Upper Band:** Basis Line + (Standard Deviations * Multiplier).
* **Lower Band:** Basis Line - (Standard Deviations * Multiplier).
* The bands widen during high volatility and narrow ("squeeze") during low volatility. Price tends to stay within the bands most of the time.
* **Average True Range (ATR):** A measure of market volatility. Used in this script to dynamically position the character label vertically and to determine the threshold for a "neutral" candle.
## Features
### Enhanced Bollinger Bands
1. **Selectable Moving Average Type:** Choose the MA type for the Basis Line:
* `SMA` (Simple Moving Average - Default)
* `EMA` (Exponential Moving Average - More weight to recent prices)
* `WMA` (Weighted Moving Average - Linear weight to recent prices)
* `HMA` (Hull Moving Average - Aims for less lag, smoother)
* `VWMA` (Volume Weighted Moving Average - Weights price by volume)
2. **Selectable Price Source:** Calculate bands based on various price points:
* `close` (Default)
* `high`, `low`, `open`
* `hl2` ( (high + low) / 2 )
* `hlc3` ( (high + low + close) / 3 )
* `ohlc4` ( (open + high + low + close) / 4 )
3. **Volatility Squeeze Highlight:** Automatically highlights the chart background (default: gray) when bandwidth (relative width of the bands) reaches a low point over a user-defined lookback period. Squeezes often precede significant price moves.
4. **Band Fill:** Optionally fills the area between the upper and lower bands with a semi-transparent color for better visualization of the volatility channel.
5. **Band Cross Labels:** Displays small triangles (▲ for up-cross, ▼ for down-cross) when the price closes outside the upper or lower band, highlighting potential breakout or reversal signals.
6. **Band Cross Alerts:** Configurable TradingView alerts can be triggered when the price crosses above the upper band or below the lower band.
7. **Bandwidth & %B Calculations:** The script calculates Bandwidth (`(Upper - Lower) / Basis`) and %B (`(Price - Lower) / (Upper - Lower)`) internally. While not plotted separately, these values are used for features like the squeeze detection and could potentially be used for strategy development.
### Dynamic Fun Character
1. **Sentiment Visualization:** Displays an emoji character next to the **current, real-time candle only**.
2. **Dynamic Expression:** The emoji changes based on the candle's formation:
* **😀 (Happy):** Candle is Green (`close > open`).
* **😞 (Sad):** Candle is Red (`close < open`).
* **😑 (Neutral):** Candle body (`abs(close - open)`) is very small compared to the Average True Range (ATR). Indicates low momentum or indecision for that specific bar.
3. **Adaptive Neutral Threshold:** The threshold for displaying the neutral face (😑) is based on a user-defined fraction of the current ATR, making it adaptive to market volatility.
4. **Customizable Appearance:**
* Position (X/Y Offset from the current candle).
* Size (Tiny, Small, Normal, Large, Huge - Default: Huge).
* Background Color (Default: Black).
* Text/Emoji Color (Default: White).
5. **Dynamic Tooltip:** Hovering over the character provides a simple text description of the current candle state ("Moving Up!", "Moving Down!", "Not much action.").
## How to Use / Interpretation
* **Volatility:** Watch the **band width**. Narrowing bands (especially with **Squeeze Highlights**) indicate consolidation and potential energy buildup for a larger move. Widening bands show increased volatility.
* **Trend Following:** In strong trends, prices may "walk the band" (consistently touch or slightly exceed the upper/lower band). The **Basis Line** often acts as dynamic support/resistance.
* **Mean Reversion Signals:** Price touching an outer band *without* extreme volatility *might* suggest an overbought/oversold state, potentially leading to a move back towards the **Basis Line**. Confirm with other factors.
* **Breakouts/Reversals:** Price closing outside the bands (indicated by **Cross Labels** and potentially **Alerts**), especially after a **Squeeze**, can signal the start of a new move. Look for confirmation (e.g., volume).
* **Dynamic Character:** Use the character for a quick visual check of the **current real-time candle's sentiment**. Is the latest price action bullish (😀), bearish (😞), or indecisive (😑)?
* **Context is Key:** **Never** rely on this indicator alone. Combine its signals with price action analysis, chart patterns, volume, other indicators (RSI, MACD, etc.), and robust risk management strategies.
## How to Add to TradingView
1. Open your TradingView chart.
2. Click on the "Pine Editor" tab at the bottom panel.
3. Copy the entire script code (`.pine` file content).
4. Paste the code into the Pine Editor, replacing any existing content.
5. Click "Add to Chart".
6. Adjust parameters via the indicator's "Settings" cog icon if needed.
## Input Parameters
Parameters can be adjusted in the indicator settings window.
### Moving Average Settings
* **Price Source:** (`srcInput`, Default: `close`) - Selects the price data source for all calculations.
* **BB Length:** (`lenInput`, Default: `20`) - Lookback period for MA and Standard Deviation.
* **MA Type:** (`maTypeInput`, Default: `SMA`) - Type of Moving Average for the Basis Line.
* **StdDev Multiplier:** (`multInput`, Default: `2.0`) - Multiplier for the Standard Deviation to set band width.
### Visual Settings
* **Show Band Fill:** (`showFillInput`, Default: `true`) - Toggles the color fill between bands.
* **Fill Color:** (`fillColorInput`, Default: `Blue, 85% transparency`) - Color for the band fill.
* **Upper Band:** (`upperColorInput`, Default: `Teal`) - Color of the upper band line.
* **Basis Line:** (`basisColorInput`, Default: `Orange`) - Color of the middle basis line.
* **Lower Band:** (`lowerColorInput`, Default: `Teal`) - Color of the lower band line.
### Volatility Squeeze Settings
* **Highlight Squeezes:** (`showSqueezeInput`, Default: `true`) - Toggles the background highlight during squeezes.
* **Squeeze Lookback:** (`squeezeLookbackInput`, Default: `50`) - How many bars back to check for the lowest bandwidth to define a squeeze.
* **Squeeze Color:** (`squeezeColorInput`, Default: `Gray, 80% transparency`) - Background color during a squeeze.
### On-Chart Labels
* **Show Band Cross Labels:** (`showLabelsInput`, Default: `true`) - Toggles the ▲/▼ labels on band crosses.
* **Label Size:** (`labelSizeInput`, Default: `Small`) - Size of the ▲/▼ cross labels.
* **Up-Cross Label Color:** (`upCrossColorInput`, Default: `Green`) - Color for the ▲ label.
* **Down-Cross Label Color:** (`dnCrossColorInput`, Default: `Red`) - Color for the ▼ label.
### Alert Settings
* **Alert on Upper Band Cross:** (`alertCrossUpperInput`, Default: `false`) - Enable condition for alerts when price crosses above the upper band.
* **Alert on Lower Band Cross:** (`alertCrossLowerInput`, Default: `false`) - Enable condition for alerts when price crosses below the lower band.
### Fun Character Settings
* **Show Dynamic Character:** (`showCartoonInput`, Default: `true`) - Toggles the dynamic emoji character on/off.
* **Neutral Threshold (ATR Fraction):** (`littleMoveThresholdInput`, Default: `0.15`) - If candle body size < (this fraction * ATR), show Neutral face (😑).
* **Character X Offset (Bars):** (`cartoonXOffsetInput`, Default: `2`) - Horizontal offset (in bars) from the current candle.
* **Character Y Offset (ATR):** (`cartoonYOffsetMultInput`, Default: `0.5`) - Vertical offset (as a multiple of ATR) from the current candle's high.
* **Character Size:** (`cartoonSizeInput`, Default: `Huge`) - Size of the emoji character.
* **Character BG Color:** (`cartoonColorInput`, Default: `Black`) - Background color of the character label.
* **Character Text Color:** (`cartoonTextColorInput`, Default: `White`) - Color of the emoji text itself.
## Changelog
* **v1.4 (2025-04-09):** Replaced blinking character logic with dynamic face based on candle movement (Up 😀 / Down 😞 / Neutral 😑). Added ATR-based threshold input for neutral state.
* **v1.3 (2025-04-09):** Increased default character size to `size.huge`.
* **v1.2 (2025-04-09):** Changed default character background color to black and text color to white for better contrast.
* **v1.1 (2025-04-09):** Added optional blinking cartoon character next to the current candle.
* **v1.0 (2025-04-09):** Initial release - Enhanced Bollinger Bands with selectable MA/Source, squeeze highlighting, band fill, cross labels, and alerts.
## Disclaimer
This indicator is provided for informational and educational purposes only. It does not constitute financial advice or a recommendation to buy or sell any asset. Trading financial markets involves significant risk, and you could lose your capital. Always perform your own due diligence and consult with a qualified financial advisor before making any trading decisions. Past performance is not indicative of future results. The author is not responsible for any trading losses incurred using this indicator.

Ghost In The MachineScript draws:
-The range of a 5 min candle that extends for 1 hour. This range can be used for ORB strategy.
-Shows the 1 hour candle range. This helps identify price direction.
This indicator only works on the 5 min time frame.

ForexRobootthis indicator trade on crypto and forex
trade on neo usdt winrate 100%
trade on btc usdt winrate 90%
trade on cardano usdt winrate 90%
trade on floki usdt winrate 90%
and very coin other
enjoyed
inst: Forexroboot
ما
forexroboot

ForexRobootthis indicator trade on crypto and forex
trade on neo usdt winrate 100%
trade on btc usdt winrate 90%
trade on cardano usdt winrate 90%
trade on floki usdt winrate 90%
and very coin other
enjoyed
inst: Forexroboot
ما
forexroboot

Smart CRT DetectorCRT Detector, session trading, CRT high probability, CRT 4H, accumulation, TS high probability (London and New York)

Trading Value (in Million) by Asharifan v3Trading Value (in Million) by Asharifan
This indicator calculates and visualizes the trading value (price × volume) in millions for stocks, providing a clear view of market activity and money flow. It displays the current trading value alongside its 20-day and 50-day simple moving averages (SMAs), all rounded to whole numbers for easy interpretation. Designed for stock market analysis, it works best on daily and weekly timeframes, making it an excellent tool for swing trading and trend analysis.
Key Features:
Today P*V (M): Plots the daily trading value as columns, with teal bars for bullish days (close > open) and gray bars for bearish days (close < open).
20-day and 50-day Avg P*V (M): Tracks the short-term (20-day) and medium-term (50-day) average trading values in red and blue lines, respectively, to identify trends and shifts in market participation.
20M Threshold: Includes a dashed red line at 20 million, serving as a reference point for significant trading value levels.
Last Bar Label: Shows the current trading value as a clean, integer label on the latest bar for quick reference.
How to Use:
Swing Trading: Identify potential entry and exit points by watching for crossovers or divergences between the 20-day and 50-day averages, especially when trading value spikes above the 20M threshold.
Trend Analysis: Monitor the direction and slope of the 20-day and 50-day averages to confirm bullish or bearish trends in stock momentum and volume.
Smart Money Footprints: High trading value spikes, especially when sustained above the 20M line, can signal institutional or "smart money" activity, helping traders track significant market moves.
This indicator is particularly valuable for stock traders looking to gauge market strength, spot accumulation or distribution phases, and align their strategies with broader market trends. Best suited for daily and weekly charts, it’s a powerful addition to any swing trader’s or trend follower’s toolkit, offering clear insights into the footprints of smart money in the stock market.

Price Action Price Action Strategy with EMA Trend & Clean Lifecycle
Author:
Framework: Price Action + EMA
Timeframes: Optimized for 5m, 15m, and 1H
🔍 Description:
This script is a conservative and trend-filtered price action strategy designed to provide clean, high-probability BUY and SELL signals based on breakout candles and classic candlestick patterns.
The strategy uses:
✅ EMA 100 for trend confirmation
✅ EMA 21 as an exit trigger
✅ Candlestick pattern filters (Engulfing, Hammer, Shooting Star)
✅ Breakout validation (candle closes beyond previous highs/lows)
✅ Smart cooldown to prevent signal noise
✅ Full lifecycle: BUY → HOLD → CLOSE and SELL → HOLD → CLOSE
🔔 Signals:
BUY: Breakout candle with optional bullish pattern, above EMA 100
SELL: Bearish breakout below EMA 100
CLOSE: When price reverses below/above EMA 21 or on reversal candle
Each signal is plotted with a labeled marker and dashed line for clear visualization.
🧠 Best Use:
Ideal for scalpers and intraday swing traders
Works great on Gold (XAUUSD), NASDAQ, BTC, and Forex pairs
Use on 5m or 15m timeframe for cleaner setups
Combine with volume or support/resistance levels for even stronger confluence
⚙️ Settings:
Toggle candlestick pattern filtering
Adjust EMAs and cooldown between entries
Customize label spacing and aesthetics
💡 Future Enhancements:
Looking to add:
ADX trend strength filter
Divergence confirmation
Multi-timeframe EMA
Risk/Reward zones and signal score

SMC+The "SMC+" indicator is a comprehensive tool designed to overlay key Smart Money Concepts (SMC) levels, support/resistance zones, order blocks (OB), fair value gaps (FVG), and trap detection on your TradingView chart. It aims to assist traders in identifying potential areas of interest based on price action, swing structures, and volume dynamics across multiple timeframes. This indicator is fully customizable, allowing users to adjust lookback periods, colors, opacity, and sensitivity to suit their trading style.
Key Components and Functionality
1. Key Levels (Support and Resistance)
This section plots horizontal lines representing support and resistance levels based on highs and lows over three distinct lookback periods, plus daily nearest levels.
Short-Term Lookback Period (Default: 20 bars)
Plots the highest high (short_high) and lowest low (short_low) over the specified period.
Visualized as dotted lines with customizable colors (Short-Term Resistance Color, Short-Term Support Color) and opacity (Short-Term Resistance Opacity, Short-Term Support Opacity).
Adjustment Tip: Increase the lookback (e.g., to 30-50) for less frequent but stronger levels on higher timeframes, or decrease (e.g., to 10-15) for scalping on lower timeframes.
Long-Term Lookback Period (Default: 50 bars)
Plots broader support (long_low) and resistance (long_high) levels using a solid line style.
Customizable via Long-Term Resistance Color, Long-Term Support Color, and their respective opacity settings.
Adjustment Tip: Extend to 100-200 bars for swing trading or major trend analysis on daily/weekly charts.
Extra-Long Lookback Period (Default: 100 bars)
Identifies significant historical highs (extra_long_high) and lows (extra_long_low) with dashed lines.
Configurable with Extra-Long Resistance Color, Extra-Long Support Color, and opacity settings.
Adjustment Tip: Use 200-500 bars for monthly charts to capture macro-level key zones.
Daily Nearest Resistance and Support Levels
Dynamically calculates the nearest resistance (daily_res_level) and support (daily_sup_level) based on the current day’s price action relative to historical highs and lows.
Displayed with Daily Resistance Color and Daily Support Color (with opacity options).
Adjustment Tip: Works best on intraday charts (e.g., 15m, 1h) to track daily pivots; combine with volume profile for confirmation.
How It Works: These levels update dynamically as new highs/lows form, providing a visual guide to potential reversal or breakout zones.
2. SMC Inputs (Smart Money Concepts)
This section identifies swing structures, order blocks, fair value gaps, and entry signals based on SMC principles.
SMC Swing Lookback Period (Default: 12 bars)
Defines the period for detecting swing highs (smc_swing_high) and lows (smc_swing_low).
Adjustment Tip: Increase to 20-30 for smoother swings on higher timeframes; reduce to 5-10 for faster signals on lower timeframes.
Minimum Swing Size (%) (Default: 0.5%)
Filters out minor price movements to focus on significant swings.
Adjustment Tip: Raise to 1-2% for volatile markets (e.g., crypto) to avoid noise; lower to 0.2-0.3% for forex pairs with tight ranges.
Order Block Sensitivity (Default: 1.0)
Scales the size of detected order blocks (OBs) for bullish reversal (smc_ob_bull), bearish reversal (smc_ob_bear), and continuation (smc_cont_ob).
Visuals include customizable colors, opacity, border thickness, and blinking effects (e.g., SMC Bullish Reversal OB Color, SMC Bearish Reversal OB Blink Thickness).
Adjustment Tip: Increase to 1.5-2.0 for wider OBs in choppy markets; keep at 1.0 for precision in trending conditions.
Minimum FVG Size (%) (Default: 0.3%)
Sets the minimum gap size for Fair Value Gaps (fvg_high, fvg_low), displayed as boxes with Fair Value Gap Color and FVG Opacity.
Adjustment Tip: Increase to 0.5-1% for larger, more reliable gaps; decrease to 0.1-0.2% for scalping smaller inefficiencies.
How It Works:
Bullish Reversal OB: Detects a bearish candle followed by a bullish break, marking a potential demand zone.
Bearish Reversal OB: Identifies a bullish candle followed by a bearish break, marking a supply zone.
Continuation OB: Spots strong bullish momentum after a prior high, indicating a continuation zone.
FVG: Highlights bullish gaps where price may retrace to fill.
Entry Signals: Plots triangles (SMC Long Entry) when price retests an OB with a liquidity sweep or break of structure (BOS).
3. Trap Inputs
This section detects potential bull and bear traps based on price action, volume, and key level rejections.
Min Down Move for Bear Trap (%) (Default: 1.0%)
Sets the minimum drop required after a bearish OB to qualify as a trap.
Visualized with Bear Trap Color, Bear Trap Opacity, and blinking borders.
Adjustment Tip: Increase to 2-3% for stronger traps in trending markets; lower to 0.5% for ranging conditions.
Min Up Move for Bull Trap (%) (Default: 1.0%)
Sets the minimum rise required after a bullish OB to flag a trap.
Customizable with Bull Trap Color, Bull Trap Border Thickness, etc.
Adjustment Tip: Adjust similarly to bear traps based on market volatility.
Volume Lookback for Traps (Default: 5 bars)
Compares current volume to a moving average (avg_volume) to filter low-volume traps.
Adjustment Tip: Increase to 10-20 for confirmation on higher timeframes; reduce to 3 for intraday sensitivity.
How It Works:
Bear Trap: Triggers when price drops significantly after a bearish OB but reverses up with low volume or support rejection.
Bull Trap: Activates when price rises after a bullish OB but fails with low volume or resistance rejection.
Boxes highlight trap zones, resetting when price breaks out.
4. Visual Customization
Line Width (Default: 2)
Adjusts thickness of support/resistance lines.
Tip: Increase to 3-4 for visibility on cluttered charts.
Blink On (Default: Close)
Sets whether OB/FVG borders blink based on Open or Close price interaction.
Tip: Use "Open" for intraday precision; "Close" for confirmed reactions.
Colors and Opacity: Each element (OBs, FVGs, traps, key levels) has customizable colors, opacity (0-100), border thickness (1-5 or 1-7), and blink effects for dynamic visualization.
How to Use SMC+
Setup: Apply the indicator to any chart and adjust inputs based on your timeframe and market.
Key Levels: Watch for price reactions at short, long, extra-long, or daily levels for potential reversals or breakouts.
SMC Signals: Look for entry signals (triangles) near OBs or FVGs, confirmed by liquidity sweeps or BOS.
Traps: Avoid false breakouts by monitoring trap boxes, especially near key levels with low volume.
Notes:
This indicator is a visual aid and does not guarantee trading success. Combine it with other analysis tools and risk management strategies.
Performance may vary across markets and timeframes; test settings thoroughly before use.
For optimal results, experiment with lookback periods and sensitivity settings to match your trading style.
The default settings are optimal for 1 minute and 10 second time frames for small cap low float stocks.
Continuation OB are Blue.
Bullish Reversal OB color is Green
Bearish Reversal OB color is Red
FVG color is purple
Bear Trap OB is red with a green border and often appears with a Bearish Reversal OB signaling caution to a short position.
Bull trap OB is green with a Red border signaling caution to a long position.
All active OB area are highlighted and solid in color while other non active OB area are dimmed.
My personal favorite setups are when we have an active bullish reversal with an active FVG along with an active Continuation OB.
Another personal favorite is the Bearish reversal OB signaling an end to a recent uptrend.
The Trap OB detection are also a unique and Original helpful source of information.
The OB have a white boarder by default that are colored black giving a simulated blinking effect when price is acting in that zone.
The Trap OB border are colored with respect to direction of intended trap, all of which can be customized to personal style.
All vaild OB zones are shown compact in size ,a unique and original view until its no longer valid.
[Forexroboot super scalper v1]this indicator trade on crypto and forex
trade on any time frame
enjoyed
inst: Forexroboot
ما
forexroboot

SMC + ICT Strategy | 5-Min | No Repaint | TP/SL LinesSmc+ Ict clear signal with no repaint also in 5 min perfect for intraday

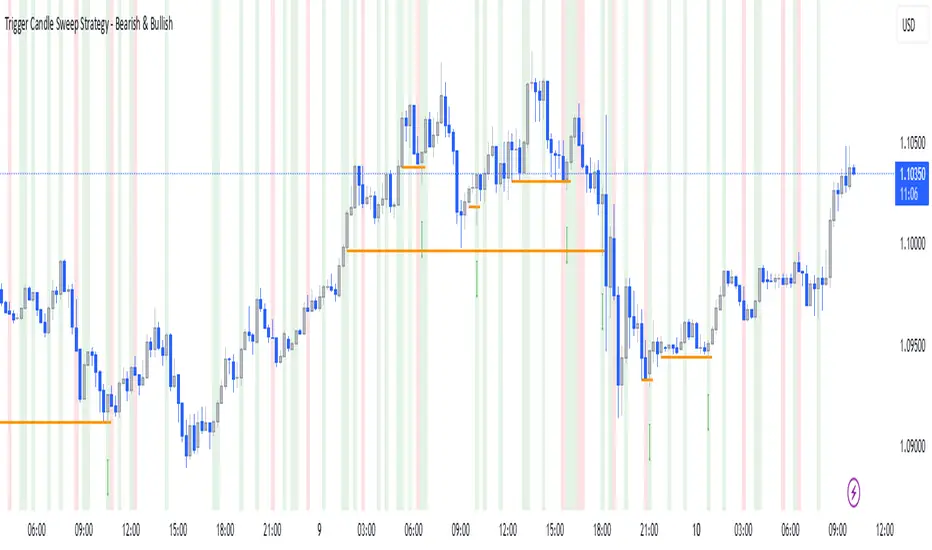
Trigger Candle Sweep Strategy - Bearish & BullishIdentifying Trigger Candle sweeps. Sweeps of liquidity with momentum
Psychological Levels 25 Gold [UkutaLabs]This indicator is specifically designed to display key psychological levels for Gold (XAUUSD) trading, focusing on increments of $25. It automatically plots major and minor levels, providing traders with clear visual cues for potential support and resistance areas.
Key Features:
25 Dollar Increments: Draws lines at every $25 increment, highlighting significant price levels for Gold.
Major & Minor Levels: Distinguishes between major ($25 increments) and minor (mid-point) levels with customizable colors and styles.
Nearest Century Line: Displays the nearest 25 dollar increment to the current price with a distinct color.
Customizable Appearance: Allows users to adjust line colors, styles (dashed, dotted, solid), and widths to suit their preferences.
Number of Lines: Allows users to set the number of psychological lines to be displayed above and below the current price.
Clear Visuals: Provides clean and easily interpretable lines on the chart.
How to Use:
Add the indicator to your Gold (XAUUSD) chart.
Observe the plotted lines for potential support and resistance areas.
Customize the line colors and styles in the indicator's settings to match your chart theme.
Use these levels in conjunction with other technical analysis tools for informed trading decisions.
Disclaimer:
This indicator is for informational purposes only and should not be considered financial advice. Trading involves risks, and past performance is not indicative of future results. 1 2 Always conduct thorough research and consult with a qualified financial 3 advisor before making any trading decisions.

