Micro Channel Alert Pro//@version=6
indicator("Micro Channel Alert Pro", overlay=true)
// === تنظیمات
len = input.int(7, "Micro Channel Length", minval=3, maxval=10)
emaLength = input.int(20, "EMA Length")
minTrendStrength = input.float(0.002, "Min Trend Strength (%)", step=0.0001)
angleThreshold = input.float(25.0, "Min Channel Angle (degrees)")
cooldownBars = input.int(10, "Cooldown after Signal", minval=1)
// === محاسبه EMA و قدرت روند
ema = ta.ema(close, emaLength)
trendStrength = math.abs(ema - ema ) / ema
isTrending = trendStrength > minTrendStrength
// === محاسبه زاویه رگرسیون (به درجه)
regNow = ta.linreg(close, len, 0)
regPrev = ta.linreg(close, len, 1)
angleClose = math.atan(regNow - regPrev) * 180 / math.pi
// === بررسی ساختار HL یا LH
isHL = true
isLH = true
for i = 1 to len - 1
isHL := isHL and (low > low ) and (high > high )
isLH := isLH and (low < low ) and (high < high )
// === بررسی نوسان پایین (کندلهای کوچک)
avgRange = ta.sma(high - low, len)
avgBody = ta.sma(math.abs(close - open), len)
lowVolatility = avgBody / avgRange < 0.6
// === شرایط سیگنال
microUp = isTrending and isLH and angleClose > angleThreshold and lowVolatility and close > high
microDn = isTrending and isHL and angleClose < -angleThreshold and lowVolatility and close < low
// === جلوگیری از سیگنال تکراری
var int lastSignalBar = na
cooldownOk = na(lastSignalBar) or (bar_index - lastSignalBar > cooldownBars)
signalUp = microUp and cooldownOk
signalDn = microDn and cooldownOk
if signalUp or signalDn
lastSignalBar := bar_index
// === نمایش روی چارت
plotshape(signalUp, title="Micro Up", location=location.belowbar, style=shape.labelup, color=color.green, text="Micro ↑")
plotshape(signalDn, title="Micro Down", location=location.abovebar, style=shape.labeldown, color=color.red, text="Micro ↓")
// === آلارم
alertcondition(signalUp, title="Micro Channel Up Alert", message="Micro Channel Up Detected!")
alertcondition(signalDn, title="Micro Channel Down Alert", message="Micro Channel Down Detected!")
Индикаторы Билла Вильямса

UTBot + EMA Filter (HA + ATR Logic)UT+ EMA = hightest winrate >90% for scalping
UT+ EMA = hightest winrate >90% for scalping
UT+ EMA = hightest winrate >90% for scalping
UT+ EMA = hightest winrate >90% for scalping


Dr. Ravi Strategy - Full ComboThis Pine Script indicator identifies demand and supply zones based on price action:
It detects bullish or bearish impulsive candles using a user-defined body percentage threshold.
Then it looks back a few candles to identify a “base”—a consolidation area with small candle bodies (checked via math.abs()).
If the setup is valid, it draws a green zone below for demand (after a bullish impulse) or a red zone above for supply (after a bearish impulse).
These zones can help traders anticipate potential reversal or breakout areas.

Smart Multi-Signal System PROThis custom TradingView indicator is designed to improve trade accuracy by combining multiple strong signals:
1. 200 EMA – Filters trades by trend (only buys above EMA, sells below).
2. RSI (14) – Spots overbought/oversold momentum for reversal opportunities.
3. Volume Spike – Confirms strong interest by checking if volume is 1.5× above average.
4. Impulse Candle – Looks for strong price moves (body > 1.5% of price).
When all these conditions align, it plots a BUY or SELL label directly on the chart.

Forex Overwiew True Strenght IndexNew oscillator for all currencies—I’m about to add NOK, SEK, and other lower-volume currencies that are interesting due to their lack of correlation with the major ones.

UTBot + EMA Filter (HA + ATR Logic)hightest winrate >90%,
hightest winrate >90%
hightest winrate >90%
hightest winrate >90%hightest winrate >90%

My script1// This Pine Script® code is subject to the terms of the Mozilla Public License 2.0 at mozilla.org
2// © Lkkahar99
3
4//@version=6
5indicator("My script")
6plot(close)
7

BOS ➝ FVG Combo (15m only, 1‑candle window)How it works:
Timeframe filter ensures nothing plots except on a 15 min chart.
bos_fvg_window = 1 hard‑codes the gap to appear within one candle of the BOS.
It marks BOS (triangles) and then only the FVG that occur in the very next bar (circles).
To use:
Open your 15 min chart in TradingView.
Open the Pine Editor, paste in this script.
Click “Add to Chart”.
Let me know if you’d like to add alerts, entry/exit rules, or any session/time‑of‑day filters!

WP-Core Alerts MultiTF🧠 WP-Core Alerts MultiTF 📈📉
Rule-based technical execution system inspired by WP-Core (NEXUS framework)
This script alerts you to potential LONG or SHORT entries in BTC, ETH or any asset, combining:
✅ Confluence of key zones (15m & 1H Pivot Points)
✅ Technical confirmation via %R(80) across dual timeframes
✅ Clear, replicable entry conditions
✅ Automatic SL and TP levels with R:R ≥ 2.5
✅ Quick visual cues with labels and live table
⚙️ How it works:
Valid entries only if price is within a WP-Zone
(±0.15% from a current or previous Pivot on 15m or 1H)
Confirmation via %R(80):
🔼 LONG if it crosses above -80
🔽 SHORT if it crosses below -20
Optional slope filter for greater precision
Triggers visual and sound alerts, calculating entry, SL, and TP levels dynamically (based on ATR x 0.5 + 2.5 R:R)
🔔 Built-in alerts:
LONG: %R(80) crosses above -80 inside WP-Zone
SHORT: %R(80) crosses below -20 inside WP-Zone
Great for automation, bots, or disciplined manual trading
🎯 Perfect for:
Traders using zone + momentum confluence logic
WP-Core / NEXUS strategy followers
Intraday BTC/ETH traders with strict risk control

nova_v2🌟 Key Features of the Target Trend Indicator 🌟
🎯 Market Trend Identification: The indicator utilizes advanced technology based on modified moving averages and the ATR indicator to determine the current market direction with incredible precision!
🎨 Candlestick Coloring: It changes the color of candlesticks according to the identified trend, making it super easy for traders to visually understand the prevailing direction at a glance!
🚀 Target Level Identification: The indicator automatically calculates three potential price targets and marks them with clear lines and precise labels - no more guesswork!
📊 Entry and Exit Points Clarification: It clearly identifies the appropriate entry point and stop-loss level, helping traders manage risk effectively and maximize profits!
⚙️ Flexible Settings: It allows users to adjust parameters such as trend length and target levels according to their specific trading needs and preferences!
💼 How to Benefit from the Indicator 💼
You can use the Target Trend Indicator in several trading strategies:
🌊 Trading with the Trend: Traders can use the indicator's signals to enter trades that align with the general market direction for higher probability setups!
💰 Multiple Profit-Taking Strategy: With three target levels, traders can implement a partial exit strategy at each target level to lock in profits while letting winners run!
↩️ Market Reversal Point Detection: The indicator helps identify potential turning points in the market, allowing traders to adjust their strategies accordingly and stay ahead of the crowd!
🔍 Practical Application 🔍
The indicator works effectively on the 15-minute timeframe and is perfect for active traders who prefer shorter timeframes. However, it can also be used on other timeframes by adjusting the parameters accordingly!
The indicator relies on an advanced algorithm that combines exponential moving averages (EMA) and the Average True Range (ATR) indicator to provide accurate signals. It also offers visual market analysis by highlighting potential support and resistance areas!
📈 Potential Results 📈
Using this indicator can help traders:
Improve the risk-to-reward ratio in trades for better overall portfolio performance!
Identify more precise entry and exit points to maximize profits!
Gain a better understanding of market dynamics and trends for smarter trading decisions!
Make more confident trading decisions with less emotional influence - trade like a pro!

Custom Cancel Size PatternObjective:
This TradingView indicator identifies a specific 3-candle pattern based on candle size (measured using True Range) and highlights the third candle (or later) when the pattern is complete.
---
The 3-Candle Pattern Logic:
1. Candle 1 (two candles ago)
Its True Range (TR) must be greater than the current Average True Range (ATR).
This means it's a relatively large candle — we're looking for strong movement here.
2. Candle 2 (one candle ago)
Its TR must be less than the ATR.
This suggests a "cooling off" or a smaller move.
3. Candle 3 (the current candle)
Its TR must be at least 2 times bigger than Candle 2's TR.
This means a breakout or strong move again, following the smaller candle.
---
What the Indicator Does:
Detects this 3-candle pattern as new candles form.
Highlights the third candle (the current one) with a green color and a label beneath it that says "Pattern".
Optionally colors the bar green (you can customize this if you want a different visual style).
---
What You’ll See on the Chart:
When the conditions are met:
A green bar (if bar coloring is enabled).
A label below the bar that says “Pattern” appears under the third candle.

🟢🟥 Liquidity Grabs + Volumen Alto by ernesto[Crypto CLEAN]Name: 🟢🟥 Liquidity Grabs + High Volume
This indicator identifies potential liquidity grabs at both swing highs and swing lows, confirmed by a high volume spike. It's designed specifically for crypto trading and works across all timeframes.
🔍 What it does:
Detects possible stop hunts / liquidity sweeps.
Confirms with volume higher than the average (user-defined multiplier).
Marks the event with a clean label above or below the candle (no background coloring).
Great for spotting institutional moves or whale activity.
Compatible with any asset and timeframe.
📌 How it works:
A swing high is considered a liquidity grab if the high breaks recent highs and volume is elevated.
A swing low is a grab if the low breaks recent lows with high volume.
Labels show:
🟥 High Liquidity Grab (above candle)
🟩 Low Liquidity Grab (below candle)
🔔 Alerts included so you never miss a move.

Volume Range Profile with Fair Value (SWAROOPRAM29)This indicator overlays a custom volume profile across two dynamic price zones (upper and lower) within a defined lookback range. It highlights the Point of Control (POC) for each zone — the price level with the highest traded volume — and tracks its movement over time to help identify fair value areas.
🔍 Features:
Dynamic Volume Zones: Automatically calculates upper/lower zones based on a % of the high-low range.
Granular Volume Distribution: Visualizes buy/sell volume using histogram bins inside each zone.
Point of Control (POC): Shows the most active volume bin with optional percentage breakdown (Buy %, Sell %, Total).
Fair Value Drift Line: Plots a moving average of POC to track fair value shifts.
Total Volume Labels: Optionally display total buy/sell volume in each zone.
Trade Entry Logic (Strategy):
Entry on POC touch or midline level.
Supports long, short, or both directions.
Customizable take profit and stop loss levels.
This tool helps traders spot high-volume price acceptance areas, potential reversals, and trend continuations based on volume-weighted logic — ideal for scalping, swing, and volume-based strategies.
brings Smart Money Concept (ICT) session logic to life by plotting key global trading sessions with volume and delta analytics. It not only highlights session ranges but also tracks their midpoints — which often act as intraday support/resistance levels.
KEY FEATURES
Visual session boxes: Plots boxes for Tokyo, London, New York, and Sydney sessions based on user-defined UTC+0 time ranges.
Volume & delta metrics: Displays total volume and delta volume (buy–sell difference) within each session.
Mid, High & Low Range Extension: Once a session ends, the high, low, and midpoint levels automatically extend — ideal for detecting SR zones.
Session labels: Each box includes a label with session name, time, volume, and delta for quick reference.
Custom session control: Enable or disable sessions individually and configure start/end times.
Clean aesthetics: Transparent shaded boxes with subtle borders make it easy to overlay without clutter.
Sessions Dashboard: Shows the time range of each session and tells you whether the session is currently active.
🔵 USAGE
Enable the sessions you want to monitor (e.g., New York or Tokyo) from the settings.
Use session volume and delta values to gauge the strength and direction of institutional activity.
Watch for price interaction with the extended range — it often acts as dynamic support/resistance after the session ends.
Overlay it with liquidity tools or breaker blocks for intraday strategy alignment.
🔵 EXAMPLES
Extended Future Range acted as resistance/support.

ballenas by ErnestoWhat does this indicator do?
High Volume:
Calculates the average volume of the last n candles (configurable).
Marks candles with volume greater than the average multiplied by a factor (adjustable).
Candle Body:
Marks candles with a large body compared to their range (adjustable ratio).
Direction:
Green circle (buy): When the candle is bullish (close > open) and meets high volume and a large body.
Red circle (sell): When the candle is bearish (close < open) with high volume and a large body.
Automatic alerts: You will receive an alert when an institutional buy or sell is detected.
📊 How to use it?
Open the Pine Editor in TradingView.
Copy and paste this code.
Click Save and then Add to Chart.
Configure alerts according to your needs.
With this, you'll have a real-time indicator that displays circles on the candle itself when large volume purchases or sales are detected.

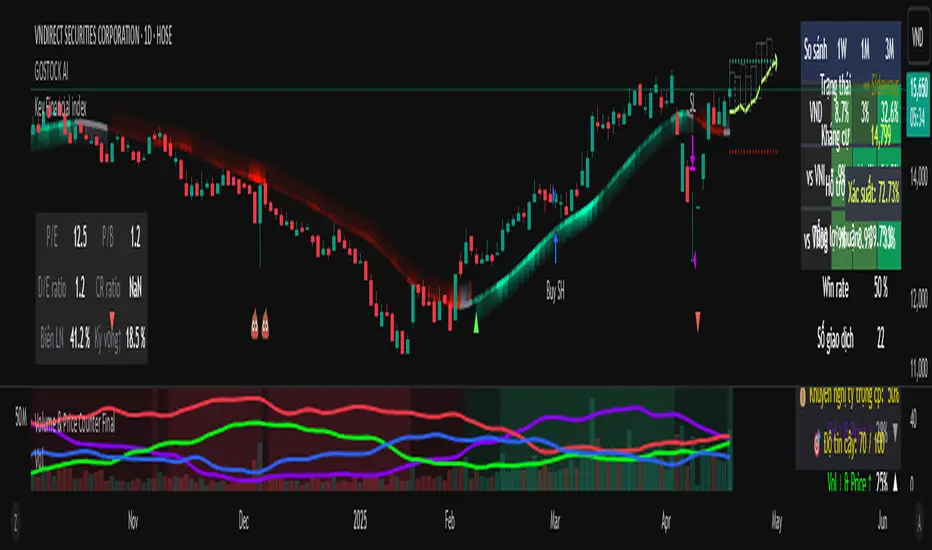
Key Financial index**Basic Indicators** (updates may be delayed by a few weeks after dividend distribution):
1. **P/E Ratio**: *Price-to-Earnings*. This ratio shows the price investors are willing to pay for each unit of profit the company generates.
- A P/E below 8 is considered good, meaning the company yields a 12.5% annual profit, which implies a payback period of 8 years.
2. **P/B Ratio**: *Price-to-Book Ratio*. This is used to compare a company's market value with its book value.
- A low P/B (usually below 1): May indicate that the stock is undervalued compared to the company’s net asset value. This can be a good investment opportunity but may also signal financial trouble.
- A high P/B (usually above 3): May suggest the stock is overvalued relative to the company’s net assets. This could reflect high growth expectations or potential overvaluation.
3. **D/E Ratio**: *Debt-to-Equity Ratio* is a financial metric that measures a company’s financial leverage.
D/E Ratio = Total Liabilities / Shareholders' Equity.
It compares the total liabilities of a company to its equity to indicate how much debt is used to finance its assets compared to shareholder investments.
- D/E Ratio below 1: Generally considered safe.
- D/E Ratio between 1 and 2: May be acceptable depending on the industry.
- D/E Ratio above 2: May indicate high financial risk.
4. **CR Ratio**: *Current Ratio*, an important liquidity metric used to assess a company’s ability to pay off short-term liabilities using its short-term assets.
- CR Ratio > 1: Indicates the company has enough current assets to pay off its short-term debts. The higher the ratio, the better the liquidity position.
- CR Ratio < 1: Suggests the company may face difficulties in meeting short-term obligations. This can be a red flag for financial stability.
5. **Profit Margin**: A key financial indicator that measures a company’s profitability relative to its revenue. It shows what percentage of revenue remains after all related costs are deducted.
**General significance of Profit Margin**:
- **Operational Efficiency**: A high profit margin indicates efficient cost management and the ability to generate strong profits from revenue.
- **Industry Comparison**: Comparing a company’s profit margin with its industry peers helps assess its competitive position and relative performance.
**Note**:
- There is no single “good” margin across all industries. Each industry has different cost structures and competition levels, leading to varying average margins.
- When analyzing profit margins, one must consider the industry context, the company’s business model, and market trends.
6. **Growth Expectation ↑**: This refers to the expected profit growth. The percentage figure reflects how much growth the market expects the company to achieve in the next financial report based on the current stock price.
- The lower the expected growth rate (typically below 15%), the safer the current price is considered.
- A high expected growth rate may indicate that the market anticipates a profit breakthrough or that the stock is trading above its intrinsic value relative to actual earnings.
Hull MA with Support/Resistance📊 Combined Hull MA & Support/Resistance Indicator
🌟 Core Features Overview
This indicator integrates two powerful tools:
Hull Moving Average (Hull MA) - An optimized MA variant that reduces lag and closely follows price action.
Dynamic Support/Resistance System - Automatically identifies key price levels based on market structure.
Dual Advantage: Simultaneously identifies trends with Hull MA while pinpointing critical price zones for optimal entries.
⚙️ How It Works
Component Functionality Key Attributes Hull MA
- Trend identification
- Reversal signals via color changes - Low latency
- Color-coded (green/red) momentum
Support/Resistance - Key level detection
- Noise filtering via pivot points - Auto-adjusting
- Extended line visualization
📈 Practical Applications Trend Trading:
Buy when Hull MA turns green + price breaks Resistance
Sell when Hull MA turns red + price breaks Support
Breakout/Pullback Strategies:
Combine S/R breakouts with Hull MA slope for signal confirmation
Risk Management:
Place stop-loss orders beyond nearest S/R levels
⚡ Performance Optimization
Default Settings:
Hull MA: 16 periods (ideal for H1/D1 timeframes)
S/R: 1-bar pivot (short-term swing points)
Advanced Customization:
Increase Hull MA sensitivity by reducing periods
Widen S/R zones with Left/Right Bars >1
📌 Critical Notes
• Most effective in trending markets
• Recommended to combine with volume or RSI for confirmation
• Always backtest across multiple timeframes before live trading
💡 Pro Tip: Use Hull MA as primary trend filter - only trade when price retests S/R levels aligned with the MA's color.

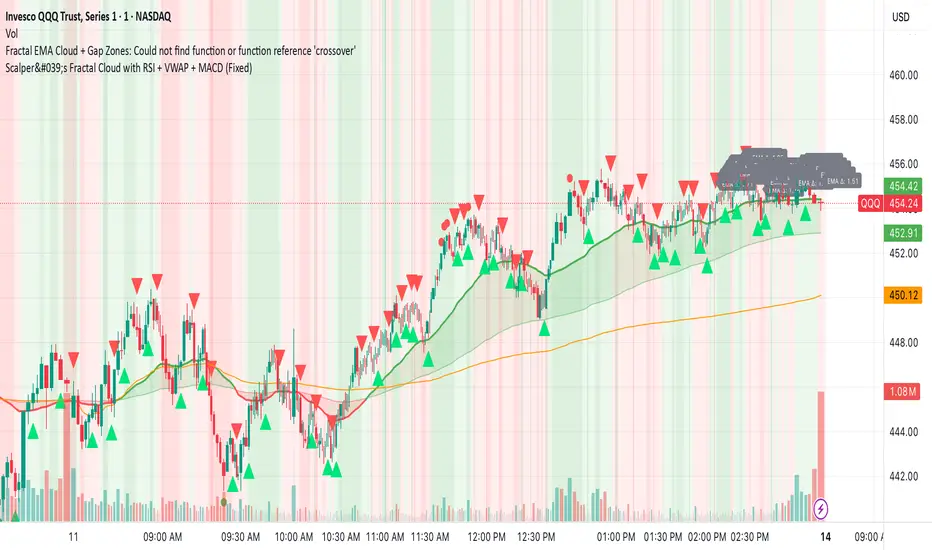
Scalper's Fractal Cloud with RSI + VWAP + MACD (Fixed)Scalper’s Fractal Confluence Dashboard
1. Purpose of the Indicator
This TradingView indicator script provides a high-confluence setup for scalping and day trading. It blends momentum indicators (RSI, MACD), trend bias tools (EMA Cloud, VWAP), and structure (fractal swings, gap zones) to help confirm precise entries and exits.
2. Components of the Indicator
- EMA Cloud (50 & 200 EMA): Trend bias – green means bullish, red means bearish. Avoid longs under red cloud.
- VWAP: Institutional volume anchor. Ideal entries are pullbacks to VWAP in direction of trend.
- Gap Zones: Shows open-air zones (white space) where price can move fast. Used to anticipate momentum moves.
- ZigZag Swings: Marks structural pivots (highs/lows) – useful for stop placement and range anticipation.
- MACD Histogram: Shows bullish or bearish momentum via background color.
- RSI: Overbought (>70) or oversold (<30) warnings. Good for exits or countertrend reversion plays.
- EMA Spread Label: Quick view of momentum strength. Wide spread = strong trend.
3. Scalping Entry Checklist
Before entering a trade, confirm these conditions:
• • Bias: EMA cloud color supports trade direction
• • Price is above/below VWAP (confirming institutional flow)
• • MACD histogram matches direction (green for long, red for short)
• • RSI not at extreme (unless you’re fading trend)
• • If entering gap zone, expect fast move
• • Recent swing high/low nearby for target or stop
4. Risk & Sizing Guidelines
Risk 1–2% of account per trade. Place stop below recent swing low (for longs) or high (for shorts). Use fractional sizing near VWAP or white space zones for scalping reversals.
5. Daily Trade Journal Template
- Date:
- Ticker:
- Setup Type (VWAP pullback, Gap Break, EMA reversion):
- Entry Time:
- Bias (Green/Red Cloud):
- RSI Level / MACD Reading:
- Stop Loss:
- Target:
- Result (P/L):
- What I Did Well:
- What Needs Work:
Fractal Pattern AnalysisFractal Pattern Key Elements and How to Read Them
1. Williams Fractals (Triangle Markers)
Red Triangles Pointing Down: Bearish fractals - potential resistance points and selling opportunities
Green Triangles Pointing Up: Bullish fractals - potential support points and buying opportunities
When to Act: Look for bullish fractals forming during uptrends and bearish fractals during downtrends
2. Moving Averages
Yellow Line (20 EMA): Short-term trend
Blue Line (50 EMA): Medium-term trend
Red Line (200 EMA): Long-term trend
Interpretation: When shorter MAs cross above longer MAs, it's bullish; when they cross below, it's bearish
Key Signal: The alignment of all three MAs (stacked in order) confirms a strong trend
3. Background Color
Green Background: Uptrend (all MAs aligned bullishly)
Red Background: Downtrend (all MAs aligned bearishly)
Yellow Background: Sideways/neutral market (MAs not clearly aligned)
4. Market Structure Markers (Small Circles)
Green Circles: Higher highs and higher lows (bullish structure)
Red Circles: Lower highs and lower lows (bearish structure)
Pattern Recognition: Multiple green circles suggest continuing uptrend; multiple red circles suggest continuing downtrend
5. Reversal Diamonds ("Rev" Markers)
Yellow Diamonds: Potential trend reversal points
Usage: These mark where the current trend might be changing direction
Confirmation: Wait for price to close beyond the diamond before acting
6. Bollinger Bands (Blue Lines with Fill)
Middle Band: 20-period SMA
Upper/Lower Bands: Volatility channels
Signals: Price touching upper band in uptrend is strength; touching lower band in downtrend is weakness
Squeeze: When bands narrow, expect a volatility breakout soon
7. Status Table (Top Right)
Shows current trend, volume direction, and overall signal at a glance
"BUY" signal appears when multiple bullish conditions align
"SELL" signal appears when multiple bearish conditions align

Range Filter Buy and Sell 5min## **Enhanced Range Filter Strategy: A Comprehensive Overview**
### **1. Introduction**
The **Enhanced Range Filter Strategy** is a powerful technical trading system designed to identify high-probability trading opportunities while filtering out market noise. It utilizes **range-based trend filtering**, **momentum confirmation**, and **volatility-based risk management** to generate precise entry and exit signals. This strategy is particularly useful for traders who aim to capitalize on trend-following setups while avoiding choppy, ranging market conditions.
---
### **2. Key Components of the Strategy**
#### **A. Range Filter (Trend Determination)**
- The **Range Filter** smooths price fluctuations and helps identify clear trends.
- It calculates an **adjusted price range** based on a **sampling period** and a **multiplier**, ensuring a dynamic trend-following approach.
- **Uptrends:** When the current price is above the range filter and the trend is strengthening.
- **Downtrends:** When the price falls below the range filter and momentum confirms the move.
#### **B. RSI (Relative Strength Index) as Momentum Confirmation**
- RSI is used to **filter out weak trades** and prevent entries during overbought/oversold conditions.
- **Buy Signals:** RSI is above a certain threshold (e.g., 50) in an uptrend.
- **Sell Signals:** RSI is below a certain threshold (e.g., 50) in a downtrend.
#### **C. ADX (Average Directional Index) for Trend Strength Confirmation**
- ADX ensures that trades are only taken when the trend has **sufficient strength**.
- Avoids trading in low-volatility, ranging markets.
- **Threshold (e.g., 25):** Only trade when ADX is above this value, indicating a strong trend.
#### **D. ATR (Average True Range) for Risk Management**
- **Stop Loss (SL):** Placed **one ATR below** (for long trades) or **one ATR above** (for short trades).
- **Take Profit (TP):** Set at a **3:1 reward-to-risk ratio**, using ATR to determine realistic price targets.
- Ensures volatility-adjusted risk management.
---
### **3. Entry and Exit Conditions**
#### **📈 Buy (Long) Entry Conditions:**
1. **Price is above the Range Filter** → Indicates an uptrend.
2. **Upward trend strength is positive** (confirmed via trend counter).
3. **RSI is above the buy threshold** (e.g., 50, to confirm momentum).
4. **ADX confirms trend strength** (e.g., above 25).
5. **Volatility is supportive** (using ATR analysis).
#### **📉 Sell (Short) Entry Conditions:**
1. **Price is below the Range Filter** → Indicates a downtrend.
2. **Downward trend strength is positive** (confirmed via trend counter).
3. **RSI is below the sell threshold** (e.g., 50, to confirm momentum).
4. **ADX confirms trend strength** (e.g., above 25).
5. **Volatility is supportive** (using ATR analysis).
#### **🚪 Exit Conditions:**
- **Stop Loss (SL):**
- **Long Trades:** 1 ATR below entry price.
- **Short Trades:** 1 ATR above entry price.
- **Take Profit (TP):**
- Set at **3x the risk distance** to achieve a favorable risk-reward ratio.
- **Ranging Market Exit:**
- If ADX falls below the threshold, indicating a weakening trend.
---
### **4. Visualization & Alerts**
- **Colored range filter line** changes based on trend direction.
- **Buy and Sell signals** appear as labels on the chart.
- **Stop Loss and Take Profit levels** are plotted as dashed lines.
- **Gray background highlights ranging markets** where trading is avoided.
- **Alerts trigger on Buy, Sell, and Ranging Market conditions** for automation.
---
### **5. Advantages of the Enhanced Range Filter Strategy**
✅ **Trend-Following with Noise Reduction** → Helps avoid false signals by filtering out weak trends.
✅ **Momentum Confirmation with RSI & ADX** → Ensures that only strong, valid trades are executed.
✅ **Volatility-Based Risk Management** → ATR ensures adaptive stop loss and take profit placements.
✅ **Works on Multiple Timeframes** → Effective for day trading, swing trading, and scalping.
✅ **Visually Intuitive** → Clearly displays trade signals, SL/TP levels, and trend conditions.
---
### **6. Who Should Use This Strategy?**
✔ **Trend Traders** who want to enter trades with momentum confirmation.
✔ **Swing Traders** looking for medium-term opportunities with a solid risk-reward ratio.
✔ **Scalpers** who need precise entries and exits to minimize false signals.
✔ **Algorithmic Traders** using alerts for automated execution.
---
### **7. Conclusion**
The **Enhanced Range Filter Strategy** is a powerful trading tool that combines **trend-following techniques, momentum indicators, and risk management** into a structured, rule-based system. By leveraging **Range Filters, RSI, ADX, and ATR**, traders can improve trade accuracy, manage risk effectively, and filter out unfavorable market conditions.
This strategy is **ideal for traders looking for a systematic, disciplined approach** to capturing trends while **avoiding market noise and false breakouts**. 🚀

JPMorgan Collar LevelsJPMorgan Collar Levels – SPX/SPY Auto-Responsive (Quarterly Logic)
This script tracks the JPMorgan Hedged Equity Fund collar strategy, one of the most watched institutional positioning tools on SPX/SPY. The strategy rolls quarterly and often acts as a magnet or resistance/support zone for price.
