Smart Trend Lines 𝒯𝒽𝑒_𝓁𝓊𝓇𝓀𝑒𝓇Smart Trend Lines is a tool for drawing dynamic, highly accurate, and error-free trend lines (major, intermediate, and short-term) with the detection of breaks in these lines using advanced filters such as ADX (Average Directional Index), RSI (Relative Strength Index), and trading volume. It aims to assist traders in accurately identifying trends and breakout points, thereby enhancing decision-making in trading.
1. Features of the Indicator
// Dynamic Trend Line Drawing with Three Lengths:
- Main Line: Based on a long time period (default is 50 candles) to identify long-term trends.
- Mid Line: Based on a medium time period (default is 21 candles) to identify medium-term trends.
- Short Line: Based on a short time period (default is 9 candles) to identify short-term trends.
//Breakout Detection:
- Monitors breakouts when the price crosses a trend line, either upward (for downward lines) or downward (for upward lines).
- Uses filters (ADX, RSI, volume) to confirm the validity of the breakout and reduce false signals.
//Filters for Signal Confirmation:
- ADX: Confirms the strength of the trend (default minimum is 20).
- RSI: Checks for overbought conditions (above 65) or oversold conditions (below 35) to avoid false breakouts.
- Trading Volume: Compares the current trading volume with the moving average of volume to ensure momentum.
//Flexible Settings:
- Customization of line colors (upward and downward) and styles (solid, dashed, dotted).
- Option to show or hide mid and short lines.
- Selection of price type for breakout detection (close, high, low).
//Optional Display of Previous Lines:
- Allows users to optionally view previously drawn trend lines.
//Alerts and Labels:
- Provides instant alerts when a breakout occurs, along with details of the achieved conditions (e.g., V for volume, A for ADX, R for RSI).
- Adds visual labels on the chart at the point of breakout, with customizable label sizes.
//Automatic Line Extensions:
- Dynamically extends trend lines as long as they remain unbroken, ensuring that prices do not breach the line in the opposite direction.
2. Methods of Drawing Lines
// Identification of Pivot Points:
- Pivot High and Pivot Low points are detected using specific time periods for each type of line (Main: 50, Mid: 21, Short: 9).
- High points (Pivot High) are used to draw downward trend lines, while low points (Pivot Low) are used to draw upward trend lines.
Clarification:
- The `ta.pivothigh` function is used to identify high points (Pivot High), and the `ta.pivotlow` function is used to identify low points (Pivot Low) based on the specified periods for each line:
- Main Line:** Uses `trendLineLength` (default 50 candles).
- Mid Line:** Uses `trendLineLengthMid` (default 21 candles).
- Short Line:** Uses `trendLineLengthShort` (default 9 candles).
- High points (Pivot High) are utilized to draw downward trend lines, while low points (Pivot Low) are utilized to draw upward trend lines.
This ensures that the trend lines are dynamically drawn based on significant price pivots, providing a precise representation of the market's directional movements.
//Calculating the Slope:
- The slope between two points (start and end) is calculated using the difference in price divided by the difference in the number of candles:
Slope = ( Price Difference/Number of Candles Difference)
- Downward trend lines require a negative slope, indicating that the price is decreasing over time.
- Upward trend lines require a positive slope, indicating that the price is increasing over time.
This calculation ensures that the trend lines accurately reflect the direction and rate of price movement, providing traders with a clear visual representation of the market's momentum.
Additional Notes:
- The slope of the line reflects not only the direction (upward or downward) but also the intensity of the trend. The steeper the slope, the stronger and faster the price movement.
- The use of this dynamic method for calculating the slope ensures that trend lines adapt to changing market conditions, providing real-time updates for traders.
- The mathematical precision of this method enhances the reliability of trend lines and reduces errors, making it a valuable tool for technical market analysis.
//Drawing the Lines:
- Base Line (Start Line): Connects the two Pivot points (start and end).
- Extended Line (Trend Line): Starts from the endpoint of the base line and extends to the current candle with the same slope.
- The line's color and style are determined based on user settings (e.g., red for downward lines, green for upward lines).
Clarification:
- The function `line.new` is used to draw the base line (`bearishStartLine`) from the starting point (`bearStartIndex, bearStartVal`) to the endpoint (`bearEndIndex, bearEndVal`).
- The extended line (`bearishTrendLine`) starts from the endpoint and extends to the current candle (`bar_index`) using the slope (`bearSlope`) to maintain the trend direction.
// Extending the Lines:
- The lines are dynamically extended to the current candle if no breakout occurs.
- The extension stops when a breakout occurs or if the price crosses the line in the opposite direction.
Clarification:
- The function `extendTrendline` updates the extended line by modifying the endpoint coordinates (`x2, y2`) to the current candle (`bar_index`) using the slope (`slope).
- If a crossover in the opposite direction is detected via `checkExtendedStrictMode`, the extension stops at the previous candle.
3. Conditions for Drawing Lines
Presence of at Least Two Pivot Points:
- Drawing a line requires the presence of two Pivot points:
- Two high points (Pivot High) for a downward line.
- Two low points (Pivot Low) for an upward line.
- These points must fall within a specified time period, not exceeding five times the length of the line.
Slope Validation:
- A downward line requires a negative slope, meaning the endpoint is lower than the starting point.
- An upward line requires a positive slope, meaning the endpoint is higher than the starting point.
Validation of Strict Mode:
- All candles between the two Pivot points are examined to ensure that the price does not breach the trend line:
- For a downward line: The price (close, high, or low, depending on the settings) must not exceed the projected value of the line.
- For an upward line: The price must not fall below the projected value of the line.
This ensures that the trend line remains valid and accurately reflects the price movement without interruptions caused by temporary breaches.
Validation of Post-Pivot Break:
- Candles after the endpoint are examined to ensure that the price has not breached the line in the opposite direction, ensuring the line's validity.
Validation of Strict Extension:
- When extending the line, it is confirmed that the price does not breach the extended line in the opposite direction.
These checks ensure the trend line remains accurate and reliable, both during its initial drawing and as it dynamically extends over time.
4. Conditions for Breakout Detection
Price Crossing the Line:
- For a downward line: The price (close, high, or low, depending on the settings) exceeds the level of the line.
- For an upward line: The price falls below the level of the line.
Candle Confirmation:
- The candle must be closed (confirmed) to register the breakout.
Filter Conditions:
- Trading Volume:
- The trading volume must be higher than the moving average.
- For an upward breakout: A green candle (close > open) with a volume higher than the last green candle is preferred.
- For a downward breakout: A red candle (close < open) with a volume higher than the last red candle is preferred.
- ADX (Average Directional Index):
- The ADX value must exceed the minimum threshold (default is 20) to confirm the strength of the trend.
- RSI (Relative Strength Index) (if enabled):
- For an upward breakout: The RSI should be less than or equal to the upper limit (65) to avoid overbought conditions.
- For a downward breakout: The RSI should be greater than or equal to the lower limit (35) to avoid oversold conditions.
Non-Repetition of Breakouts:
- Each breakout is recorded only once per line until a new line is drawn.
These conditions ensure that breakouts are accurately detected and validated, minimizing false signals and enhancing the reliability of the trading decisions.
5. Additional Notes
Display Settings:
- Users can choose to show or hide previous lines and customize the size of labels (e.g., Very Small, Small, Normal, Large, Huge).
Visual Styles:
- Line styles vary to facilitate differentiation:
- Solid for the main line.
- Dashed for the intermediate line.
- Dotted for the short-term line.
Alerts:
- A single alert is sent for each breakout, with text specifying the type of breakout (main, intermediate, short) and the filters that have been met.
These features enhance user experience by providing flexibility in visualization, ease of interpretation, and timely notifications for informed trading decisions.
Disclaimer
The information and posts are not intended to be, or constitute, any financial, investment, trading or other types of preparation or execution of tasks or endorsed by TradingView.
Smart Trend Lines هو مؤشر تحليل فني يرسم خطوط اتجاه ديناميكية (رئيسية، متوسطة، قصيرة) على الرسم البياني، ويكتشف كسورها باستخدام فلاتر ADX، RSI، وحجم التداول لتأكيد الإشارات.
1. المميزات
1. خطوط اتجاه بثلاثة أطوال:
- رئيسي (50 شمعة): للاتجاهات طويلة الأمد.
- متوسط (21 شمعة): للاتجاهات متوسطة الأمد.
- قصير (9 شموع): للاتجاهات قصيرة الأمد.
2. اكتشاف الكسور: يرصد اختراق السعر للخطوط مع فلاتر لتقليل الإشارات الكاذبة.
3. فلاتر التأكيد:
- ADX (>20): يؤكد قوة الاتجاه.
- RSI (65/35): يتجن“B” للرئيسي، “M” للمتوسط، “S” للقصير).
4. إعدادات مرنة: تخصيص الألوان، الأنماط (متصل، متقطع، منقط)، ونوع السعر (إغلاق، أعلى، أدنى).
5. تمديد الخطوط: يمدد الخطوط تلقائيًا حتى الكسر.
2. طرق رسم الخطوط
1. نقاط Pivot: تحديد النقاط العليا (للخطوط الهابطة) والدنيا (للصاعدة) باستخدام فترات زمنية (50، 21، 9).
2. حساب الميل: قسمة فرق السعر على فرق الشموع (ميل سالب لهابط، موجب لصاعد).
3. رسم الخطوط: خط أساسي يربط نقطتي Pivot، وخط ممتد إلى الشمعة الحالية.
4. التمديد: يستمر التمديد إذا لم يُكسر الخط.
3. شروط الرسم
1. وجود نقطتين Pivot ضمن فترة (≤5 أضعاف طول الخط).
2. ميل مناسب (سالب لهابط، موجب لصاعد).
3. الوضع الصارم: السعر لا يخترق الخط بين النقطتين.
4. فحص ما بعد النقطة: عدم اختراق الخط بعد النهاية.
5. تمديد صارم: السعر لا يخترق الخط الممتد.
4. شروط الكسر
1. اختراق السعر للخط (فوق الهابط، تحت الصاعد).
2. تأكيد الشمعة (مغلقة).
3. فلاتر:
- حجم أعلى من المتوسط، مع شمعة خضراء (للصاعد) أو حمراء (للهابط).
- ADX > 20.
- RSI: ≤65 (صاعد)، ≥35 (هابط).
4. كسر واحد لكل خط.
5. ملاحظات
- العرض: خيارات لإخفاء الخطوط السابقة وتخصيص التسميات.
- التنبيهات: تنبيهات فورية مع تفاصيل الفلاتر.
إخلاء المسؤولية
لا يُقصد بالمعلومات والمنشورات أن تكون، أو تشكل، أي نصيحة مالية أو استثمارية أو تجارية أو أنواع أخرى من النصائح أو التوصيات المقدمة أو المعتمدة من TradingView.
Полосы и каналы

High ATRHigh-ATR is an indicator that visualizes volatility using the Average True Range (ATR). It highlights periods of elevated volatility by comparing the ATR to its moving average.
When the ATR exceeds its moving average, it is considered "Overthreshold" and is displayed in red. This helps identify candles with significant volatility.
Note: ATR does not indicate market direction, only the magnitude (width) of the trading range.
Default Settings:
Long length: 50 (used for the ATR moving average)
Short length: 1 (used for the current ATR)
Multiplier: 2
These values can be adjusted depending on your trading style, but this is the default configuration.

⚡ High-Frequency Pro Strategy | Enhanced Filtersfind the supply ondemand for Gold and the best areat to import

GM trendIndicator is designed to track and visualize medium-term trends using the EMA 35 line, along with the EMA 25 and EMA 45. This script creates a clear visual representation of price dynamics by shading the area between the EMA 25 and EMA 45, while highlighting EMA 35 as the central trend-following reference. The shading helps identify areas of support, resistance, and trend strength.

Fractal CorridorsFractal Corridors - visual tool that maps market structure through a multi-scale lens, revealing the underlying architecture of price action across time. By processing pivot points at multiple depths, it constructs a layered geometric corridors that reflects the self-similar, scalable nature of financial markets. Each pivot scale connects successive highs and lows with lines, and when both sides are present, fills the space between them, forming polygonal bands that shift in shape and density as volatility and trend evolve.
Inputs
Base Depth: Number of bars for the smallest pivot
Factor: Multiplier between small, medium and large depths
Selectable color of components
The real value of this indicator lies not in generating executive signals, but in offering a structural perspective that blends short-term fluctuations with longer-term market cycles. The output allows to visually assess trends in terms of shapes, detect compression zones, and identify multi-timeframe confluence areas where price is likely to react. Whether used for macro trend confirmation or pattern evaluation, this indicator transforms raw price data into a clear, fractal-informed map of market behavior, helping the user navigate the complexity of emerging price through the language of geometry.

GM DailyIndicator displays two exponential moving averages (EMAs) — EMA 100 and EMA 200 — both calculated on the 4-hour (4H) timeframe. The indicator uses bright blue for the EMA 100 line and light blue for the EMA 200 line. The area between these two EMAs is filled with a semi-transparent bright blue color, helping to visually highlight the relationship between the two key moving averages.

Scalper Signal PRO (EMA + RSI + Stoch)//@version=5
indicator("Scalper Signal PRO (EMA + RSI + Stoch)", overlay=true)
// === INPUTS ===
emaFastLen = input.int(5, "EMA Fast")
emaSlowLen = input.int(13, "EMA Slow")
rsiLen = input.int(14, "RSI Length")
rsiBuy = input.int(30, "RSI Buy Level")
rsiSell = input.int(70, "RSI Sell Level")
kPeriod = input.int(5, "Stoch K")
dPeriod = input.int(3, "Stoch D")
slowing = input.int(3, "Stoch Smoothing")
// === SESSION TIME ===
sessionStart = timestamp ("GMT+8", year, month, dayofmonth, 8, 0)
sessionEnd = timestamp("GMT+8" ,year, month, dayofmonth, 18, 0)
withinSession = time >= sessionStart and time <= sessionEnd
// === LOGIC ===
emaFast = ta.ema(close, emaFastLen)
emaSlow = ta.ema(close, emaSlowLen)
emaBullish = emaFast > emaSlow and ta.crossover(emaFast, emaSlow)
emaBearish = emaFast < emaSlow and ta.crossunder(emaFast, emaSlow)
rsi = ta.rsi(close, rsiLen)
k = ta.sma(ta.stoch(close, high, low, kPeriod), slowing)
d = ta.sma(k, dPeriod)
buyCond = emaBullish and rsi < rsiBuy and k > d and withinSession
sellCond = emaBearish and rsi > rsiSell and k < d and withinSession
// === PLOTS ===
showSignals = input.bool(true, "Show Buy/Sell Signals?")
plotshape(showSignals and buyCond, location=location.belowbar, style=shape.labelup, color=color.green, text="BUY", title="Buy Signal")
plotshape(showSignals and sellCond, location=location.abovebar, style=shape.labeldown, color=color.red, text="SELL", title="Sell Signal")
plot(emaFast, "EMA Fast", color=color.orange)
plot(emaSlow, "EMA Slow", color=color.blue)
// === ALERTS ===
alertcondition(buyCond, title="Buy Alert", message="Scalper PRO Buy Signal")
alertcondition(sellCond, title="Sell Alert", message="Scalper PRO Sell Signal")
// === DASHBOARD ===
var table dash = table.new(position.top_right, 2, 5, frame_color=color.gray, frame_width=1)
bg = color.new(color.black, 85)
table.cell(dash, 0, 0, "Scalper PRO", bgcolor=bg, text_color=color.white, text_size=size.normal)
table.cell(dash, 0, 1, "Trend", bgcolor=bg)
table.cell(dash, 1, 1, emaFast > emaSlow ? "Bullish" : "Bearish", bgcolor=emaFast > emaSlow ? color.green : color.red, text_color=color.white)
table.cell(dash, 0, 2, "RSI", bgcolor=bg)
table.cell(dash, 1, 2, str.tostring(rsi, "#.0"), bgcolor=color.gray, text_color=color.white)
table.cell(dash, 0, 3, "Stoch K/D", bgcolor=bg)
table.cell(dash, 1, 3, str.tostring(k, "#.0") + "/" + str.tostring(d, "#.0"), bgcolor=color.navy, text_color=color.white)
table.cell(dash, 0, 4, "Session", bgcolor=bg)
table.cell(dash, 1, 4, withinSession ? "LIVE" : "OFF", bgcolor=withinSession ? color.green : color.red, text_color=color.white)

Multi Scanner Plot & Table V1Here's how to interpret each column in the table:
Price vs MAs:
What it shows: Where the current price is relative to the short-term (e.g., 20-period) and long-term (e.g., 50-period) Simple Moving Averages (SMAs) calculated on your current chart's timeframe.
Interpretation:
Above Both (Green background): Price is above both the short and long MAs. Generally considered a bullish sign for the current trend.
Below Both (Red background): Price is below both MAs. Generally considered a bearish sign.
Mixed (Gray background): Price is between the two MAs (e.g., above the short but below the long, or vice-versa). Indicates indecision or a potential trend change.
RSI Value:
What it shows: The actual numerical value of the Relative Strength Index (RSI) calculated on your current chart's timeframe.
Interpretation: Just the raw RSI number (e.g., 65.32). The background is always gray. You compare this value to standard overbought/oversold levels (like 70/30) or the levels defined in the script's inputs.
RSI Status:
What it shows: Interprets the RSI Value based on the Overbought/Oversold levels set in the script's inputs (default 70/30). Calculated on your current chart's timeframe.
Interpretation:
Overbought (Red background): RSI is above the overbought level (e.g., > 70). Suggests the asset might be due for a pullback or reversal downwards. Red indicates a potentially bearish condition.
Oversold (Green background): RSI is below the oversold level (e.g., < 30). Suggests the asset might be due for a bounce or reversal upwards. Green indicates a potentially bullish condition.
Neutral (Gray background): RSI is between the oversold and overbought levels.
Last Sig Price:
What it shows: The price level where the last "SIG NOW" Buy or Sell signal occurred on your current chart's timeframe.
Interpretation: Helps you see the entry price of the most recent short-term signal generated by this script. The background color matches the signal type: Green for the last Buy signal, Red for the last Sell signal. N/A if no signal has occurred yet.
SIG NOW:
What it shows: This is the main short-term signal generated by the script based on conditions on your current chart's timeframe. It combines the "Price vs MAs" status and specific RSI conditions (price must be above/below both MAs and RSI must be within a certain range defined in the inputs).
Interpretation:
BUY (Green background): The specific buy conditions are met right now. (Price above both MAs AND RSI is strong but not necessarily overbought).
SELL (Red background): The specific sell conditions are met right now. (Price below both MAs AND RSI is weak but not necessarily oversold).
NEUTRAL (Gray background): Neither the Buy nor the Sell conditions are currently met.
ALERT:
What it shows: Flags unusual volume activity on the current bar compared to the recent average volume (calculated on your current chart's timeframe).
Interpretation:
SPIKE (Yellow background, black text): Current volume is significantly higher than the recent average (defined by the Volume Spike Multiplier). Can indicate strong interest or a potential climax.
DUMP (Purple background): Current volume is significantly lower than the recent average (defined by the Volume Dump Multiplier). Can indicate fading interest.
NONE (Gray background): Volume is within the normal range for the lookback period.
SD$:
What it shows: The price level where the last Volume Spike or Dump occurred on your current chart's timeframe.
Interpretation: Shows the price associated with the most recent significant volume event. The background color indicates the type of the last event: Green if the last event was a Spike, Red if the last event was a Dump. N/A if no Spike/Dump has occurred yet.
BB Value (%B):
What it shows: This relates to Bollinger Bands, but specifically calculated on a Higher Timeframe (HTF) that you can set in the inputs (e.g., Daily BBs while viewing an Hourly chart). It shows the Bollinger Band Percent B (%B) value for that HTF. %B measures where the HTF closing price is relative to the HTF upper and lower bands.
Interpretation:
Value > 1: HTF price closed above the HTF upper Bollinger Band.
Value < 0: HTF price closed below the HTF lower Bollinger Band.
Value between 0 and 1: HTF price closed within the HTF Bollinger Bands (e.g., 0.5 is exactly on the middle band).
The background is always gray.
LTS (Long Term Signal):
What it shows: A signal derived only from the Higher Timeframe (HTF) Bollinger Bands.
Interpretation:
BUY (Green background): The HTF price closed above the HTF upper Bollinger Band (see BB Value > 1). Considered a strong bullish signal from the higher timeframe perspective.
SELL (Red background): The HTF price closed below the HTF lower Bollinger Band (see BB Value < 0). Considered a strong bearish signal from the higher timeframe perspective.
NEUTRAL (Gray background): The HTF price closed within the HTF Bollinger Bands.
How to Understand Bollinger Bands and Signals in this Context:
Bollinger Bands are primarily used for the Long Term Signal (LTS) column. This script calculates BBs on a higher timeframe (you choose which one, or it defaults to the chart's timeframe if left blank).
The "LTS" signal triggers:
A BUY when the price on that higher timeframe closes above its upper Bollinger Band. This often indicates strong momentum or a potential breakout.
A SELL when the price on that higher timeframe closes below its lower Bollinger Band. This often indicates strong negative momentum or a potential breakdown.
The "BB Value" column gives you the raw %B number from that same higher timeframe, showing you exactly where the price is relative to the bands (is it just barely above/below, or way outside?).
The script does not directly use Bollinger Bands from the current chart timeframe for the "SIG NOW" or other table signals. The main short-term signals ("SIG NOW") rely on Moving Averages and RSI on the current timeframe. The LTS provides a longer-term perspective using HTF Bollinger Bands.
In summary: Look at the table to quickly gauge:
Short-term trend (Price vs MAs).
Short-term momentum (RSI Status, SIG NOW).
Recent short-term entry points (Last Sig Price).
Current volume anomalies (ALERT).
Long-term strength/weakness based on HTF Bollinger Bands (LTS, BB Value).
Combine these pieces of information to get a more rounded view of the current market conditions according to this specific script's logic.

Session VWAPBeautiful Session VWAP with line breaks and a trend fill. Couldn't find any that provide this level of anchor customizability/clean session breaks so I made my own. Can go up to +/-3σ by default, but you can also put in a custom multiplier set.

EMA Ribbon Cross Multi-TF MonitorThis is not your typical moving average, this give you a great buy and sell alert alongside showing you what price is doing at the 1m and 2m charts with a monitor that updates with price.
The EMA is configurable though I recommend the 2 and 8 ema's as the best ones to catch price moving higher or lower to get an early entry.
You can configure the script to add in different times and it will work on those time frames also, like 15min and 30min so you can see the longer trend of the market.

Custom Multi-Indicator [bandar]//1-SuperTrend 2-MACD 3-RSI 4-Stochastic 5-EMA (50 & 200) 6-Bollinger Bands 7-ADX 8-Ichimoku Cloud 9-Volume Weighted Average Price (VWAP) 10-Parabolic SAR
//@version=5
indicator("Custom Multi-Indicator ", overlay=true)
// SuperTrend (تم التصحيح النهائي هنا)
atrPeriod = 10
factor = 3.0
= request.security(syminfo.tickerid, timeframe.period, ta.supertrend(factor, atrPeriod))
supertrendBuy = close > supertrend
supertrendSell = close < supertrend
// MACD
= ta.macd(close, 12, 26, 9)
macdBuy = ta.crossover(macdLine, signalLine)
macdSell = ta.crossunder(macdLine, signalLine)
// RSI
rsi = ta.rsi(close, 14)
rsiBuy = rsi < 30
rsiSell = rsi > 70
// Stochastic (تصحيح كامل)
k = ta.stoch(close, high, low, 14)
d = ta.sma(k, 3)
stochBuy = ta.crossover(k, d) and k < 20
stochSell = ta.crossunder(k, d) and k > 80
// EMA Cross
ema50 = ta.ema(close, 50)
ema200 = ta.ema(close, 200)
emaBuy = ta.crossover(ema50, ema200)
emaSell = ta.crossunder(ema50, ema200)
// Bollinger Bands
= ta.bb(close, 20, 2)
bbBuy = ta.crossover(close, lower)
bbSell = ta.crossunder(close, upper)
// ADX
= ta.dmi(14, 14)
adxBuy = adx > 25 and diPlus > diMinus
adxSell = adx > 25 and diPlus < diMinus
// Ichimoku Cloud (تصحيح يدوي كامل)
conversionLine = (ta.highest(high, 9) + ta.lowest(low, 9)) / 2
baseLine = (ta.highest(high, 26) + ta.lowest(low, 26)) / 2
leadingSpanA = (conversionLine + baseLine) / 2
leadingSpanB = (ta.highest(high, 52) + ta.lowest(low, 52)) / 2
laggingSpan = close
// إشارات الشراء والبيع بناءً على الكلاود
ichiBuy = close > leadingSpanA and close > leadingSpanB
ichiSell = close < leadingSpanA and close < leadingSpanB
// VWAP
vwap = ta.vwap
vwapBuy = close > vwap
vwapSell = close < vwap
// Parabolic SAR (تصحيح كامل)
sar = ta.sar(0.02, 0.02, 0.2)
sarBuy = close > sar
sarSell = close < sar
// حساب مجموع الإشارات
buySignals = (supertrendBuy ? 1 : 0) + (macdBuy ? 1 : 0) + (rsiBuy ? 1 : 0) + (stochBuy ? 1 : 0) +
(emaBuy ? 1 : 0) + (bbBuy ? 1 : 0) + (adxBuy ? 1 : 0) + (ichiBuy ? 1 : 0) +
(vwapBuy ? 1 : 0) + (sarBuy ? 1 : 0)
sellSignals = (supertrendSell ? 1 : 0) + (macdSell ? 1 : 0) + (rsiSell ? 1 : 0) + (stochSell ? 1 : 0) +
(emaSell ? 1 : 0) + (bbSell ? 1 : 0) + (adxSell ? 1 : 0) + (ichiSell ? 1 : 0) +
(vwapSell ? 1 : 0) + (sarSell ? 1 : 0)
// شروط القرار النهائي
finalBuy = buySignals >= 7
finalSell = sellSignals >= 7
// الرسم على الشارت
plotshape(finalBuy, title="BUY Signal", location=location.belowbar, style=shape.labelup, color=color.green, size=size.tiny, text="BUY")
plotshape(finalSell, title="SELL Signal", location=location.abovebar, style=shape.labeldown, color=color.red, size=size.tiny, text="SELL")
// تلوين الخلفية
bgcolor(finalBuy ? color.new(color.green,90) : finalSell ? color.new(color.red,90) : na)
// إظهار عدد الإشارات
var label lbl = na
if barstate.islast
label.delete(lbl)
lbl := label.new(bar_index, high, str.tostring(buySignals) + " Buy | " + str.tostring(sellSignals) + " Sell", color=color.white, style=label.style_label_down)

Ultimate SuperTrend ProThe ultimate script works correctly while maintaining all the original features:
Customizable Inputs:
Separate input groups for SuperTrend, visualization, profit booking, and risk management
Adjustable ATR length and multiplier
Cloud opacity control
ATR-Based Cloud Visualization:
Bullish trend shows green cloud between upper band and upper band - 0.5 ATR
Bearish trend shows red cloud between lower band and lower band + 0.5 ATR
Adjustable opacity for better chart visibility
Profit Booking System:
Calculates profit booking levels based on ATR multiplier
Visual markers (circles) show where to take profits
Arrows appear when price hits profit booking level
Fully customizable color and ratio
Enhanced Risk Management:
ATR-based stop loss system
Visual indication of stop levels in the info table
Option to disable stop loss if desired
Improved Visual Feedback:
Cleaner signal markers
Comprehensive info table showing current status
Distance to profit booking level displayed
Strategy Integration:
Automatically exits positions at profit booking levels
Stop loss protection
Clear alert conditions

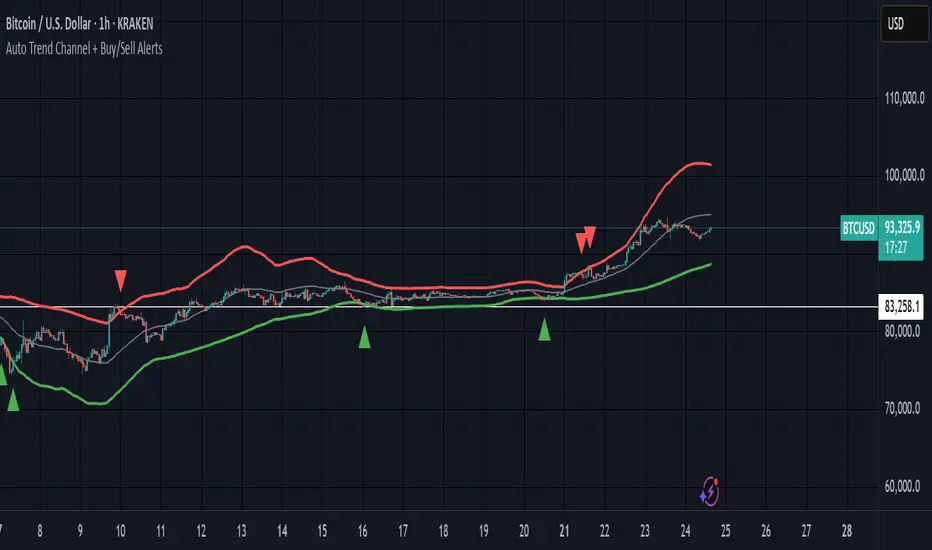
Auto Trend Channel + Buy/Sell AlertsThis indicator automatically detects trend channels using a linear regression line, and dynamically plots upper and lower channel boundaries based on standard deviation. It helps traders identify potential Buy and Sell zones with clear visual signals and customizable alerts.
💡 How It Works:
🧠 Regression-Based Channel: Calculates the central trend line using ta.linreg() over a user-defined length.
📏 Dynamic Boundaries: Upper and lower channel lines are offset by a multiplier of the standard deviation for precision volatility tracking.
✅ Buy Signals: Triggered when price crosses above the lower boundary — potential bounce entry.
❌ Sell Signals: Triggered when price crosses below the upper boundary — potential reversal exit.
🔔 Alerts Enabled: Get real-time alerts when price touches the channel lines.
Gold Bollinger Bands Strategy [1H]Bollinger Bands in TradingView. This strategy enters:
Long when the price closes below the lower Bollinger Band (suggesting oversold).
Short when the price closes above the upper Bollinger Band (suggesting overbought).
It exits when the price returns to the middle band.

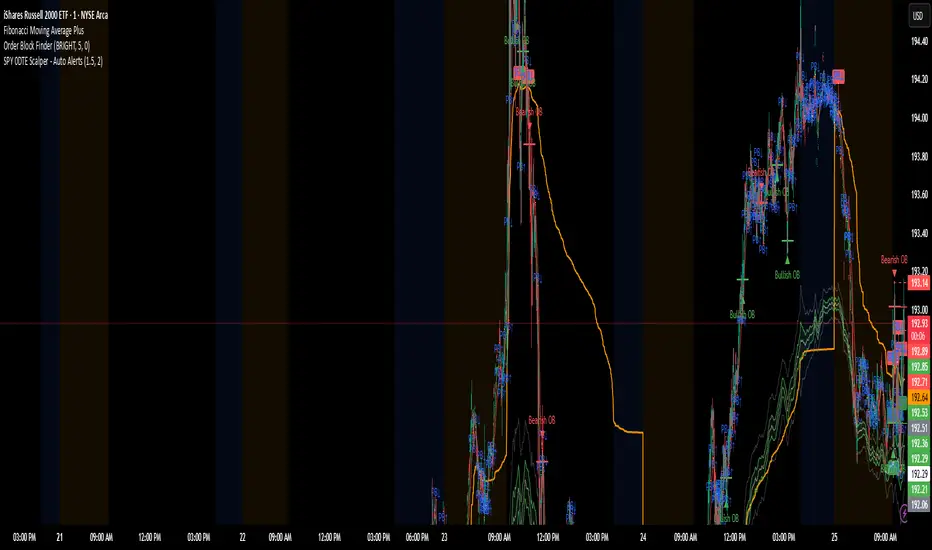
SPY 0DTE Scalper - Auto AlertsTimeframes:
Main chart: 1-minute (for precision entries)
Confirmations: 3-minute or 5-minute (to avoid fakeouts)
Indicators I Use:
VWAP – Orange line → Institutional fair value
EMA 9 – Green line → Short-term momentum
EMA 21 – Red line → Trend filter
Custom Pullback Signal Script – Marks buy/sell/pullback signals with labels (triangles)
Above VWAP = Bullish Bias
Below VWAP = Bearish Bias
Institutions treat this as the "fair price" — so I do too.
EMA 9 (Green):
If price hugs or bounces off EMA 9 = 🔥 strong continuation move.
I use this as my guide for momentum.
EMA 21 (Red):
Great for trend confirmation.
Above EMA 21 = Trend building to the upside.
Below EMA 21 = Weakness or possible reversal.
💸 Step 3: How I Read the Signals
✅ BUY Signal:
Price breaks above VWAP with volume 1.5x+ average
Candle must close strong (not a wickfest)
EMA 9 becomes my trailing stop for the move
🚨 SELL Signal:
Price breaks below VWAP with strong volume
Clean body close below → momentum shift to the downside
EMA 9 again = trailing resistance guide
🔵 Pullback Long (Blue Triangle Under Candle):
Bullish continuation entry
Price pulls back to EMA 9 or 21, but stays above VWAP
Low-risk re-entry after a breakout
🟣 Pullback Short (Purple Triangle Above Candle):
Bearish continuation entry
Price retraces into EMA 9, but stays below VWAP & EMA 21
Ideal for catching second legs after breakdowns

网格风控信号//@version=5
indicator("网格风控信号", overlay=true)
emaFast = ta.ema(close, 9)
emaSlow = ta.ema(close, 21)
macd = ta.ema(close, 12) - ta.ema(close, 26)
signal = ta.ema(macd, 9)
trendUp = emaFast > emaSlow and macd > signal
trendDown = emaFast < emaSlow and macd < signal
alertcondition(trendUp, title="暂停卖出", message='{"action":"disable"}')
alertcondition(trendDown, title="暂停买入", message='{"action":"disable_buy"}')

Scalper Signal PRO (EMA + RSI + Stoch)How to use it
Buy Signal:
. EMA 5 crosses above EMA 13
. Price is above EMA 50
. RSI near or just above 30
Sell Signal:
. EMA 5 crosses below EMA 13
. Price is below EMA 50
. RSI near or just below 30

Custom Opening Range - CommoditiesThe Custom Opening Range Indicator for Commodities is designed for instruments that trade nearly 24 hours, such as crude oil or natural gas. It allows traders to define the Opening Range based on Indian Standard Time (IST)—typically starting at 3:30 AM IST, which aligns with the global commodities market open. Users can customize both the start time and duration of the range (e.g., 5, 15, or 30 minutes). The indicator dynamically plots the high and low of this range and shades the area between them, providing a clear visual reference for breakout or reversal setups during the rest of the trading session.

StupidTrader Money GlitchStupidTrader Money Glitch
This indicator identifies high-probability buy setups by combining key technical concepts. It detects a reclaimed demand zone (a significant low that was broken and reclaimed), confirms bullish market structure breaks (MSB), ensures the price is above the 9 and 21 EMAs, and looks for volume spikes or trends.
Key Features:
Plots a demand zone (blue box) based on a reclaimed low.
Signals long entries (green triangles) when conditions align: reclaimed demand zone, MSB, price above EMAs, and volume confirmation.
Includes EMA 9 (blue) and EMA 21 (aqua) for trend confirmation.
How to Use:
Add the indicator to your chart and look for green triangles below candles as buy signals. Ensure the price interacts with the demand zone, breaks market structure, and shows volume confirmation. Works best on daily or higher timeframes for assets like ONDO, BTC, and more.
Settings:
Short EMA Length: 9
Mid EMA Length: 21
Pivot Lookback for Demand Zone: 5
Zone Lookback for Demand: 90
Volume Lookback: 20
DOC & DOS 30m Rangesthe lines on the screen indicate the 30 min rande on the daily opens for stocks and crypto

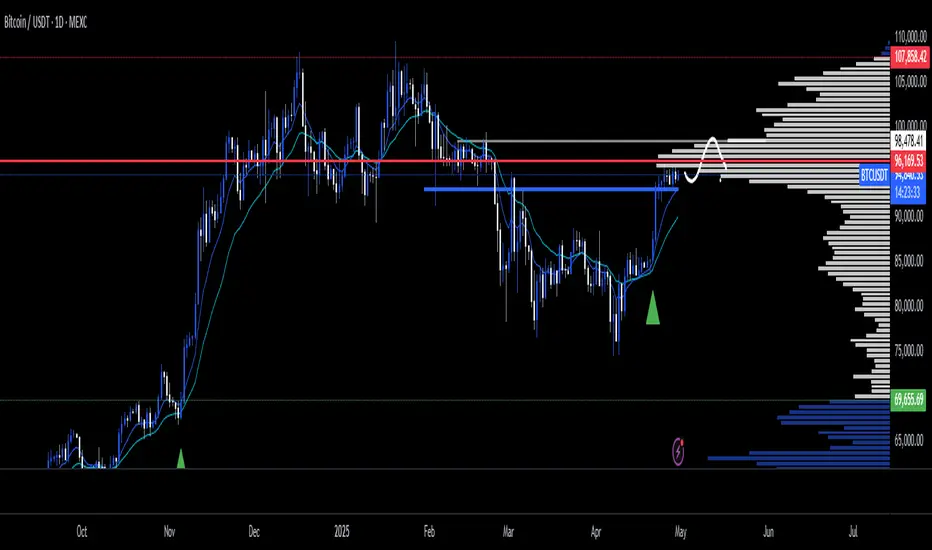
Pi Cycle Top IndicatorThe Pi Cycle Top Indicator plots the 111DMA and 350DMAx2. This is a well know indicator that has predicted Bitcoin cycle tops within a few days in previous cycles.

Multi-Timeframe Bollinger Bands (1H, 4H, 1D)Testing a new script for idenitifying sotkcs for short squeeze potential
