Advanced Momentum Scanner [QuantAlgo]The Advanced Momentum Scanner is a sophisticated technical indicator designed to identify market momentum and trend direction using multiple exponential moving averages (EMAs), momentum metrics, and adaptive visualization techniques. It is particularly valuable for those looking to identify trading and investing opportunities based on trend changes and momentum shifts across any market and timeframe.
🟢 Technical Foundation
The Advanced Momentum Scanner utilizes a multi-layered approach with four different EMA periods to identify market momentum and trend direction:
Ultra-Fast EMA for quick trend changes detection (default: 5)
Fast EMA for short-term trend analysis (default: 10)
Mid EMA for intermediate confirmation (default: 30)
Slow EMA for long-term trend identification (default: 100)
For momentum detection, the indicator implements a Rate of Change (RoC) calculation to measure price momentum over a specified period. It further enhances analysis by incorporating RSI readings for overbought/oversold conditions, volatility measurements through ATR, and optional volume confirmation. When these elements align, the indicator generates trading signals based on the selected sensitivity mode (Conservative, Balanced, or Aggressive).
🟢 Key Features & Signals
1. Multi-Period Trend Identification
The indicator combines multiple EMAs of different lengths to provide comprehensive trend analysis within the same timeframe, displaying the information through color-coded visual elements on the chart.
When an uptrend is detected, chart elements are colored with the bullish theme color (default: green/teal).
Similarly, when a downtrend is detected, chart elements are colored with the bearish theme color (default: red).
During neutral or indecisive periods, chart elements are colored with a neutral gray color, providing clear visual distinction between trending and non-trending market conditions.
This visualization provides immediate insights into underlying trend direction without requiring separate indicators, helping traders and investors quickly identify the market's current state.
2. Trend Strength Information Panel
The trend panel operates in three different sensitivity modes (Conservative, Aggressive, and Balanced), each affecting how the indicator processes and displays market information.
The Conservative mode prioritizes trend sustainability over frequency, showing only strong trend movements with high probability.
The Aggressive mode detects early trend changes, providing more frequent signals but potentially more false positives.
The Balanced mode offers a middle ground with moderate signal frequency and reliability.
Regardless of the selected mode, the panel displays:
Current trend direction (UPTREND, DOWNTREND, or NEUTRAL)
Trend strength percentage (0-100%)
Early detection signals when applicable
The active sensitivity mode
This comprehensive approach helps traders and investors:
→ Assess the strength of current market trends
→ Identify early potential trend changes before full confirmation
→ Make more informed trading and investing decisions based on trend context
3. Customizable Visualization Settings
This indicator offers extensive visual customization options to suit different trading styles and preferences:
Display options:
→ Fully customizable uptrend, downtrend, and neutral colors
→ Color-coded price bars showing trend direction
→ Dynamic gradient bands visualizing potential trend channels
→ Optional background coloring based on trend intensity
→ Adjustable transparency levels for all visual elements
These visualization settings can be fine-tuned through the indicator's interface, allowing traders and investors to create a personalized chart environment that emphasizes the most relevant information for their strategy.
The indicator also features a comprehensive alert system with notifications for:
New trend formations (uptrend, downtrend, neutral)
Early trend change signals
Momentum threshold crossovers
Other significant market conditions
Alerts can be customized and delivered through TradingView's notification system, making it easy to stay informed of important market developments even when you are away from the charts.
🟢 Practical Usage Tips
→ Trend Analysis and Interpretation: The indicator visualizes trend direction and strength directly on the chart through color-coding and the information panel, allowing traders and investors to immediately identify the current market context. This information helps in assessing the potential for continuation or reversal.
→ Signal Generation Strategies: The indicator generates potential trading signals based on trend direction, momentum confirmation, and selected sensitivity mode. Users can choose between Conservative (fewer but more reliable signals), Balanced (moderate approach), or Aggressive (more frequent but potentially less reliable signals).
→ Multi-Period Trend Assessment: Through its layered EMA approach, the indicator enables users to understand trend conditions across different lookback periods within the same timeframe. This helps in identifying the dominant trend and potential turning points.
🟢 Pro Tips
Adjust EMA periods based on your timeframe:
→ Lower values for shorter timeframes and more frequent signals
→ Higher values for higher timeframes and more reliable signals
Fine-tune sensitivity mode based on your trading style:
→ "Conservative" for position trading/long-term investing and fewer false signals
→ "Balanced" for swing trading/medium-term investing with moderate signal frequency
→ "Aggressive" for scalping/day trading and catching early trend changes
Look for confluence between components:
→ Strong trend strength percentage and direction in the information panel
→ Overall market context aligning with the expected direction
Use for multiple trading approaches:
→ Trend following during strong momentum periods
→ Counter-trend trading at band extremes during overextension
→ Early trend change detection with sensitivity adjustments
→ Stop loss placement using dynamic bands
Combine with:
→ Volume indicators for additional confirmation
→ Support/resistance analysis for strategic entry/exit points
→ Multiple timeframe analysis for broader market context
Индикаторы и стратегии

YASINKARACAThe short-, medium-, and long-term indicator I have created is actually composed of moving averages, trend-following tools, Bollinger Bands, and various other indicators. You can use this indicator on any time frame.
If the turquoise moving average crosses above the orange moving average, it should be interpreted as a buy signal; if it crosses below, it should be interpreted as a sell signal.
Additionally, the white trend-following line indicates safety when the price is above it and risk when the price is below it.
The upper and lower lines of the Bollinger Bands are presented in gray. When the price approaches the lower Bollinger Band, it can be interpreted as a buying opportunity; when it reaches the upper band, it can be seen as a selling opportunity.
If the price is above the orange-colored slow moving average, the trend should be considered upward; if it is below, the trend is downward.
Wishing you success and a great day.
Yasin Karaca

Exponential Trend [AlgoAlpha]OVERVIEW
This script plots an adaptive exponential trend system that initiates from a dynamic anchor and accelerates based on time and direction. Unlike standard moving averages or trailing stops, the trend line here doesn't follow price directly—it expands exponentially from a pivot determined by a modified Supertrend logic. The result is a non-linear trend curve that starts at a specific price level and accelerates outward, allowing traders to visually assess trend strength, persistence, and early-stage reversal points through both base and volatility-adjusted extensions.
CONCEPTS
This indicator builds on the idea that trend-following tools often need dynamic, non-static expansion to reflect real market behavior. It uses a simplified Supertrend mechanism to define directional context and anchor levels, then applies an exponential growth function to simulate trend acceleration over time. The exponential growth is unidirectional and resets only when the direction flips, preserving trend memory. This method helps avoid whipsaws and adds time-weighted confirmation to trends. A volatility buffer—derived from ATR and modifiable by a width multiplier—adds a second layer to indicate zones of risk around the main trend path.
FEATURES
Exponential Trend Logic : Once a directional anchor is set, the base trend line accelerates using an exponential formula tied to elapsed bars, making the trend stronger the longer it persists.
Volatility-Adjusted Extension : A secondary band is plotted above or below the base trend line, widened by ATR to visualize volatility zones, act as soft stop regions or as a better entry point (Dynamic Support/Resistance).
Color-Coded Visualization : Clear green/red base and extension lines with shaded fills indicate trend direction and confidence levels.
Signal Markers & Alerts : Triangle markers indicate confirmed trend reversals. Built-in alerts notify users of bullish or bearish direction changes in real-time.
USAGE
Use this script to identify strong trends early, visually measure their momentum over time, and determine safe areas for entries or exits. Start by adjusting the *Exponential Rate* to control how quickly the trend expands—the higher the rate, the more aggressive the curve. The *Initial Distance* sets how far the anchor band is placed from price initially, helping filter out noise. Increase the *Width Multiplier* to widen the volatility zone for more conservative entries or exits. When the price crosses above or below the base line, a new trend is assumed and the exponential projection restarts from the new anchor. The base trend and its extension both shift over time, but only reset on a confirmed reversal. This makes the tool especially useful for momentum continuation setups or trailing stop logic in trending markets.

Volume Range Profile with Fair Value (Zeiierman)█ Overview
The Volume Range Profile with Fair Value (Zeiierman) is a precision-built volume-mapping tool designed to help traders visualize where institutional-level activity is occurring within the price range — and how that volume behavior shifts over time.
Unlike traditional volume profiles that rely on fixed session boundaries or static anchors, this tool dynamically calculates and displays volume zones across both the upper and lower ends of a price range, revealing point-of-control (POC) levels, directional volume flow, and a fair value drift line that updates live with each candle.
You’re not just looking at volume anymore. You’re dissecting who’s in control — and at what price.
⚪ In simple terms:
Upper Zone = The upper portion of the price range, showing concentrated volume activity — typically where selling or distribution may occur
Lower Zone = The lower portion of the price range, highlighting areas of high volume — often associated with buying or accumulation
POC Bin = The bin (price level) with the highest traded volume in the zone — considered the most accepted price by the market
Fair Value Trend = A dynamic trend line tracking the average POC price over time — visualizing the evolving fair value
Zone Labels = Display real-time breakdown of buy/sell volume within each zone and inside the POC — revealing who’s in control
█ How It Works
⚪ Volume Zones
Upper Zone: Anchored at the highest high in the lookback period
Lower Zone: Anchored at the lowest low in the lookback period
Width is user-defined via % of range
Each zone is divided into a series of volume bins
⚪ Volume Bins (Histograms)
Each zone is split into N bins that show how much volume occurred at each level:
Taller = More volume
The POC bin (Point of Control) is highlighted
Labels show % of volume in the POC relative to the whole zone
⚪ Buy vs Sell Breakdown
Each volume bin is split by:
Buy Volume = Close ≥ Open
Sell Volume = Close < Open
The script accumulates these and displays total Buy/Sell volume per zone.
⚪ Fair Value Drift Line
A POC trend is plotted over time:
Represents where volume was most active across each range
Color changes dynamically — green for rising, red for falling
Serves as a real-time fair value anchor across changing market structure
█ How to Use
⚪ Identify Key Control Zones
Use Upper/Lower Zone structures to understand where supply and demand is building.
Zones automatically adapt to recent highs/lows and re-center volume accordingly.
⚪ Follow Institutional Activity
Watch for POC clustering near price tops or bottoms.
Large volumes near extremes may indicate accumulation or distribution.
⚪ Spot Fair Value Drift
The fair value trend line (average POC price) gives insight into market equilibrium.
One strategy can be to trade a re-test of the fair value trend, trades are taken in the direction of the current trend.
█ Understanding Buy & Sell Volume Labels (Zone Totals)
These labels show the total buy and sell volume accumulated within each zone over the selected lookback period:
Buy Vol (green label) → Total volume where candles closed bullish
Sell Vol (red label) → Total volume where candles closed bearish
Together, they tell you which side dominated:
Higher Buy Vol → Bullish accumulation zone
Higher Sell Vol → Bearish distribution zone
This gives a quick visual insight into who controlled the zone, helping you spot areas of demand or supply imbalance.
█ Understanding POC Volume Labels
The POC (Point of Control) represents the price level where the most volume occurred within the zone. These labels break down that volume into:
Buy % – How much of the volume was buying (price closed up)
Sell % – How much was selling (price closed down)
Total % – How much of the entire zone’s volume happened at the POC
Use it to spot strong demand or supply zones:
High Buy % + High Total % → Strong buying interest = likely support
High Sell % + High Total % → Strong selling pressure = likely resistance
It gives a deeper look into who was in control at the most important price level.
█ Why It’s Useful
Track where fair value is truly forming
Detect aggressive volume accumulation or dumping
Visually split buyer/seller control at the most relevant price levels
Adapt volume structures to current trend direction
█ Settings Explained
Lookback Period: Number of bars to scan for highs/lows. Higher = smoother zones, Lower = reactive.
Zone Width (% of Range): Controls how much of the range is used to define each zone. Higher = broader zones.
Bins per Zone: Number of volume slices per zone. Higher = more detail, but heavier on resources.
-----------------
Disclaimer
The content provided in my scripts, indicators, ideas, algorithms, and systems is for educational and informational purposes only. It does not constitute financial advice, investment recommendations, or a solicitation to buy or sell any financial instruments. I will not accept liability for any loss or damage, including without limitation any loss of profit, which may arise directly or indirectly from the use of or reliance on such information.
All investments involve risk, and the past performance of a security, industry, sector, market, financial product, trading strategy, backtest, or individual's trading does not guarantee future results or returns. Investors are fully responsible for any investment decisions they make. Such decisions should be based solely on an evaluation of their financial circumstances, investment objectives, risk tolerance, and liquidity needs.

Institutional MACD (Z-Score Edition) [VolumeVigilante]📈 Institutional MACD (Z-Score Edition) — Professional-Grade Momentum Signal
This is not your average MACD .
The Institutional MACD (Z-Score Edition) is a statistically enhanced momentum tool, purpose-built for serious traders and breakout hunters . By applying Z-Score normalization to the classic MACD structure, this indicator uncovers statistically significant momentum shifts , enabling cleaner reads on price extremes, trend continuation, and potential reversals.
💡 Why It Matters
The classic MACD is powerful — but raw momentum values can be noisy and relative , especially on volatile assets like BTC/USD . By transforming the MACD line, signal line, and histogram into Z-scores , we anchor these signals in statistical context . This makes the Institutional MACD:
✔️ Timeframe-agnostic and asset-normalized
✔️ Ideal for spotting true breakouts , not false flags
✔️ A reliable tool for detecting momentum divergence and exhaustion
🧪 Key Features
✅ Full Z-Score normalization (MACD, Signal, Histogram)
✅ Highlighted ±Z threshold bands for overbought/oversold zones
✅ Customizable histogram coloring for visual momentum shifts
✅ Built-in alerts for zero-crosses and Z-threshold breaks
✅ Clean overlay with optional display toggles
🔁 Strategy Tip: Mean Reversion Signals with Statistical Confidence
This indicator isn't just for spotting breakouts — it also shines as a mean reversion tool , thanks to its Z-Score normalization .
When the Z-Score histogram crosses beyond ±2, it marks a statistically significant deviation from the mean — often signaling that momentum is overstretched and the asset may be due for a pullback or reversal .
📌 How to use it:
Z > +2 → Price action is in overbought territory. Watch for exhaustion or short setups.
Z < -2 → Momentum is deeply oversold. Look for reversal confirmation or long opportunities.
These zones often precede snap-back moves , especially in range-bound or corrective markets .
🎯 Combine Z-Score extremes with:
Candlestick confirmation
Support/resistance zones
Volume or price divergence
Other mean reversion tools (e.g., RSI, Bollinger Bands)
Unlike the raw MACD, this version delivers statistical thresholds , not guesswork — helping traders make decisions rooted in probability, not emotion.
📢 Trade Smart. Trade Vigilantly.
Published by VolumeVigilante

W%R Zone Scalper[BullByte] v1.0W%R Zone Scalper Strategy - The Definitive Deep Dive
1. Introduction: The Philosophy Behind the Strategy
This script, W%R Zone Scalper , is not just another Williams %R-based trading system—it is a refined, multi-filtered scalping engine designed to maximize edge in trending markets while minimizing false signals in choppy conditions . Unlike most basic %R strategies that blindly trade crossovers, this system introduces a sophisticated confluence of trend, volatility, and momentum filters , making it a high-probability scalper for intraday traders .
What Makes This Script Different?
✅ Originality: Most %R strategies rely solely on overbought/oversold levels, leading to whipsaws in ranging markets. This script intelligently combines:
- Trend confirmation (MA, Supertrend)
- Volatility filters (BB Width, Choppiness Index)
- Volume validation (to ensure real participation)
- ADX trend strength (to avoid weak, fake trends)
✅ Smart Trade Execution:
- Not just %R crossovers —entries are only taken when multiple filters align, reducing noise.
- Optional ATR-based SL/TP for disciplined risk management.
- Dashboard integration for real-time trade monitoring.
✅ Adaptability:
- Works on crypto, forex, and stocks (optimized for high-liquidity assets like BTC).
- Scalable from 1-minute scalping to 1-hour swing trades (adjust filters accordingly).
2. Core Components: A Surgical Breakdown
A. Williams %R - The Trigger Mechanism
- Default Settings:
- Length = 14 (optimal balance between sensitivity and reliability).
- Long Entry : Cross above -80 (oversold bounce with momentum).
- Short Entry : Cross below -20 (overbought rejection).
Why This Matters:
- Unlike RSI or Stochastic, %R is more aggressive in detecting reversals, making it ideal for scalping fast moves.
- However, raw %R signals are noisy—hence the need for additional filters.
B. The Moving Average (MA) - Trend Filter
- Purpose: Ensures trades are only taken in the direction of the broader trend.
- Types Available:
- SMA (Simple MA) – Smooth but laggy.
- EMA (Exponential MA) – Faster, default choice.
- WMA (Weighted MA) – More responsive to recent prices.
- HMA (Hull MA) – Minimal lag, excellent for scalping.
Entry Logic:
- Long : Price must be above MA (confirms uptrend).
- Short : Price must be below MA (confirms downtrend).
Why This Matters:
- Prevents counter-trend trades , which are high-risk in scalping.
- Works as a dynamic support/resistance .
C. Advanced Filters - The Edge Enhancers
1. Choppiness Index (CI) - Avoiding Sideways Markets
- Default:
- Length = 12
- Threshold = 38.2 (below = trending, above = choppy).
Why This Matters:
- Eliminates false signals in ranging markets (where %R crossovers fail most).
- Inspired by market cycle theory—only trades when volatility is directional.
2. ADX (Average Directional Index) - Trend Strength
- Default:
- Length = 14
- Threshold = 25 (only trade if ADX > 25 = strong trend).
Why This Matters:
- Many traders ignore ADX and get fake breakouts—this ensures trades happen only in high-momentum conditions.
3. Volume Filter - Confirming Real Moves
- Logic: Volume must be above its 50-period MA.
- Why This Matters:
- Low-volume breakouts often fail—this ensures institutional participation.
4. Bollinger Band Width (BBW) - Volatility Check
- Logic: BBW must be above its moving average (expanding volatility = good for scalping).
Why This Matters:
- Avoids low-volatility traps where price moves are insignificant.
5. Supertrend - Dynamic Trend Confirmation
- Logic:
- Longs : Price must be above Supertrend line.
- Shorts : Price must be below Supertrend line.
Why This Matters:
- Acts as a secondary trend filter , reducing whipsaws.
---
3. Risk Management - Protecting Capital
A. Position Sizing (Flexible & Adaptive)
- Default: 30% of equity per trade(aggressive but adjustable).
- Initial Capital: $1,000(example—modify based on your account size).
B. Stop Loss & Take Profit (ATR-Based)
- SL = 1.5x ATR (protects against sudden reversals).
- TP = 2x ATR (locks in profits before pullbacks).
Why ATR?
- Dynamic adjustment —wider in volatile markets, tighter in calm ones.
C. Manual Adjustments Required
- Commission: Default 0.1% (adjust per your broker).
- Leverage: Not hardcoded —apply based on your risk tolerance.
4. Optimal Time Frame & Asset Selection
- Best for: 5M - 15M charts(scalping).
- Also works on: 1H-4H(swing trades with adjusted filters).
- Best Assets:
- High-liquidity cryptos (BTC, ETH, SOL)
- Forex majors (EUR/USD, GBP/USD)
- High-beta stocks (TSLA, NVDA)
5. The Dashboard - Real-Time Trade Intelligence
- PnL Tracking (profit/loss in $ and %).
- Position Status (Long/Short/Flat).
- Filter Status (which ones are active).
- Key Indicators (%R, MA, Volume).
Why This Matters:
- No guesswork—all critical info in one place.
6. Strong Disclaimer
⚠️ This is not financial advice. Trading carries risk of loss.
- Backtest thoroughly before live trading.
- Start with small capital to validate performance.
- Modify SL/TP, leverage, and position sizing based on your risk profile.
- The developer is not liable for any losses incurred.
7. Why This Strategy Stands Out
Most %R strategies fail in real markets because they ignore:
❌ Trend context (trading reversals blindly).
❌ Volatility cycles (getting chopped up in sideways action).
❌ Volume confirmation (falling for fake breakouts).
This script solves those problems by:
✅ Only trading when multiple high-probability factors align.
✅ Using adaptive risk management (ATR-based SL/TP).
✅ Providing a real-time dashboard for decision-making.
8.Important Note on Backtesting & Customization
The performance results displayed with this script are based on:
- Asset BTC/USD
- Timeframe : 5-minute chart
- Key Filters Enabled :
- Moving Average (Trend Confirmation)
- Choppiness Index (Sideways Market Filter)
- Volume (Participation Validation)
Your Trading Approach May Vary
This configuration represents just one possible way to deploy the strategy. You can:
- Test alternative settings (adjust lengths, thresholds, or filters)
- Apply to different assets (cryptos, forex pairs, stocks)
- Experiment with timeframes (1m for ultra-scalping, 15m/1H for swing trades)
Critical Reminder
Always conduct your own forward testing before live trading. Market conditions change, and past performance never guarantees future results.
All the best!

Uptrick: Z-Score FlowAccording to author @Uptrick:
Uptrick: Z-Score Flow is a technical indicator that integrates trend-sensitive momentum analysis with the mean-reversion logic derived from Z-Score calculations. Its primary objective is to identify market conditions where price has deviated too far from its mean (overbought or oversold) or is within a statistically "normal" range, and then compare this observation with trend direction and RSI-based momentum signals. The result is a more contextual approach to trade entry and exit, prioritizing precision, clarity, and adaptability across different market regimes.
Introduction:
Financial instruments frequently shift between trending modes, where price extends strongly in one direction, and ranging modes, where price oscillates around a central value. A simple statistical measure like Z-Score can identify price extremes by comparing the current price to its historical mean and standard deviation. However, these extremes alone can be misleading if the overall market structure exhibits a strong trend. Uptrick: Z-Score Flow seeks to close this gap by combining Z-Score with an exponential moving average (EMA) trend filter and a smoothed RSI momentum check, thereby filtering out signals that contradict the prevailing market environment.
Objective:
The purpose of this script is to help traders identify mean reversion opportunities and trend-based pullbacks in a statistically sound manner, while still taking overall price action into account. By combining Z-Score thresholds with support conditions, the script reduces the likelihood of acting on random price rises or falls and instead focuses on significant movements within historical and current contextual frameworks.
Originality and Uniqueness:
Layered Signal Check: Signals require compliance with multiple layers (Z-Score extreme, EMA trend skew, and RSI momentum stance) rather than simply exceeding a statistical threshold.
RSI Zone Lock: Once the RSI enters an overbought/oversold zone and triggers a signal, the script blocks subsequent signals until the RSI recovers above or below those zones, limiting consecutive triggers.
Controlled Cooldown: A dedicated cooldown mechanism ensures that the script waits a specific number of bars before issuing a new signal in the opposite direction.
Gradient-Based Visualization: The distinct gradient fills between the price and the Z-Mean line improve readability, showing at a glance whether the price is trading above or below its statistical mean.
Comprehensive Metrics Panel: An optional table on the chart summarizes key Z-Score metrics, streamlining the process of verifying current statistical extremes, average levels, and momentum directions.
Why were these indicators merged? Z-Score metrics are excellent for identifying when the price deviates from its mean, but they don't intrinsically reveal whether the market's trajectory supports a reversal or whether the price could continue its trend. The EMA, commonly used to detect trend direction, offers valuable insight into whether the price is predominantly upward or downward. However, relying solely on a trend filter overlooks the intensity of price movements. The RSI adds a specific measure of momentum, helping to confirm whether market energy aligns with a potential reversal (e.g., the price is statistically low, but the RSI suggests imminent bullish momentum). By combining these three perspectives (Z-score for statistical context, the EMA for trend direction, and the RSI for momentum strength), the script offers a more comprehensive and adaptable system, aiming to avoid false positives caused by focusing on a single aspect of price behavior.
Calculations
The main calculation begins with a simple moving average (SMA) of the price over zL bars, called the base. The script then calculates the standard deviation of the price in the same window. Dividing the difference between the current price and the base price by this standard deviation gives the Z-score, which indicates how many standard deviations the price is from its mean. A positive Z-score indicates that the price is above its mean. A negative reading indicates the opposite.

[blackcat] L3 Magic-9 Sequential within HighlightsOVERVIEW
The L3 Magic-9 Sequential within Highlights indicator is designed to identify potential buy and sell signals based on sequential price patterns. This script uses custom functions to detect consecutive occurrences of specific conditions and highlights these patterns on the chart with labels and background colors 📊🔍.
FEATURES
Detects sequential price patterns for both bullish and bearish movements:
High sequences: 5, 6, 7, 8, 9, 12, 13 bars.
Low sequences: 5, 6, 7, 8, 9, 12, 13 bars.
Plots characters ('5', '6', etc.) and shapes (arrows) on the chart to indicate detected sequences 🏷️↗️↘️.
Uses a customizable period for calculating averages of price differences.
Highlights overbought and oversold conditions using background colors 🎨.
Generates buy ('B') and sell ('S') labels based on filtered occurrences and index values.
HOW TO USE
Add the indicator to your TradingView chart by selecting it from the indicators list.
Observe the plotted characters and arrows indicating detected sequential patterns.
Monitor the background color changes to identify overbought and oversold conditions.
Look for generated buy ('B') and sell ('S') labels for potential trading opportunities.
Customize the period and thresholds in the settings panel as needed ⚙️.
LIMITATIONS
The indicator relies heavily on sequential price patterns, which might not capture all market nuances.
False signals can occur in ranging or sideways markets 🌪️.
Users should always confirm signals with other forms of analysis before making trading decisions.
NOTES
Ensure that you have sufficient historical data available for accurate calculations.
Test the indicator thoroughly on demo accounts before applying it to live trading 🔍.
Adjust the period and threshold inputs to fit your preferred trading strategy.

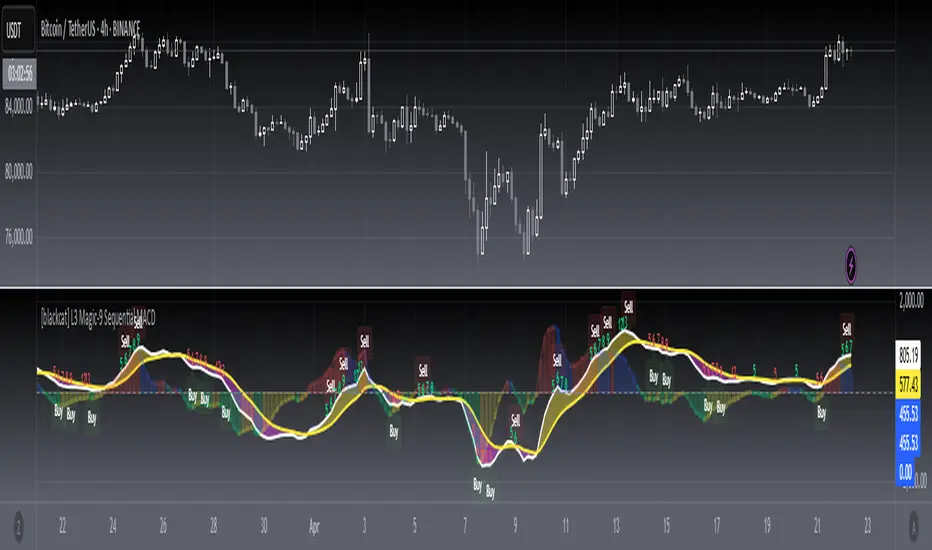
[blackcat] L3 Magic-9 Sequential MACDOVERVIEW
The L3 Magic-9 Sequential MACD indicator is an advanced tool designed to enhance the traditional Moving Average Convergence Divergence (MACD) by incorporating sequential patterns. This script calculates various MACD components and applies custom logic to identify potential buy and sell signals based on specific sequential conditions 📊💹.
FEATURES
Calculates MACD Line, Signal Line, and enhanced histogram.
Plots colored histograms to visualize differences between MACD line and signal line:
Positive histogram bars indicate bullish momentum.
Negative histogram bars indicate bearish momentum.
Identifies sequential patterns in the MACD line for generating buy ('Buy') and sell ('Sell') signals 🏷️.
Adds numerical labels (e.g., '5', '6', '7', etc.) to mark specific sequential conditions.
Supports customizable colors and styles for plotted elements ⚙️.
Generates alerts for identified sequential patterns 🔔.
HOW TO USE
Add the indicator to your TradingView chart by selecting it from the indicators list.
Adjust the input parameters for Fast Length, Slow Length, and Signal Length.
Monitor the chart for labeled buy/sell signals and numerical markers indicating sequential patterns.
Set up alerts based on the generated signals to receive notifications when conditions are met 📲.
Use the indicator alongside other technical analysis tools for better decision-making.
LIMITATIONS
The effectiveness of sequential patterns may vary depending on market conditions.
False signals can occur in highly volatile or ranging markets 🌪️.
Users should always confirm signals with other forms of analysis before entering trades.
NOTES
Ensure that you have sufficient historical data available for accurate MACD calculations.
Test the indicator thoroughly on demo accounts before applying it to live trading 🔍.
Customize the appearance of the plotted elements as needed to suit your chart layout.
Aurora Flow Oscillator [QuantAlgo]The Aurora Flow Oscillator is an advanced momentum-based technical indicator designed to identify market direction, momentum shifts, and potential reversal zones using adaptive filtering techniques. It visualizes price momentum through a dynamic oscillator that quantifies trend strength and direction, helping traders and investors recognize momentum shifts and trading opportunities across various timeframes and asset class.
🟢 Technical Foundation
The Aurora Flow Oscillator employs a sophisticated mathematical approach with adaptive momentum filtering to analyze market conditions, including:
Price-Based Momentum Calculation: Calculates logarithmic price changes to measure the rate and magnitude of market movement
Adaptive Momentum Filtering: Applies an advanced filtering algorithm to smooth momentum calculations while preserving important signals
Acceleration Analysis: Incorporates momentum acceleration to identify shifts in market direction before they become obvious
Signal Normalization: Automatically scales the oscillator output to a range between -100 and 100 for consistent interpretation across different market conditions
The indicator processes price data through multiple filtering stages, applying mathematical principles including exponential smoothing with adaptive coefficients. This creates an oscillator that dynamically adjusts to market volatility while maintaining responsiveness to genuine trend changes.
🟢 Key Features & Signals
1. Momentum Flow and Extreme Zone Identification
The oscillator presents market momentum through an intuitive visual display that clearly indicates both direction and strength:
Above Zero: Indicates positive momentum and potential bullish conditions
Below Zero: Indicates negative momentum and potential bearish conditions
Slope Direction: The angle and direction of the oscillator provide immediate insight into momentum strength
Zero Line Crossings: Signal potential trend changes and new directional momentum
The indicator also identifies potential overbought and oversold market conditions through extreme zone markings:
Upper Zone (>50): Indicates strong bullish momentum that may be approaching exhaustion
Lower Zone (<-50): Indicates strong bearish momentum that may be approaching exhaustion
Extreme Boundaries (±95): Mark potentially unsustainable momentum levels where reversals become increasingly likely
These zones are displayed with gradient intensity that increases as the oscillator moves toward extremes, helping traders and investors:
→ Identify potential reversal zones
→ Determine appropriate entry and exit points
→ Gauge overall market sentiment strength
2. Customizable Trading Style Presets
The Aurora Flow Oscillator offers pre-configured settings for different trading approaches:
Default (80,150): Balanced configuration suitable for most trading and investing situations.
Scalping (5,80): Highly responsive settings for ultra-short-term trades. Generates frequent signals and catches quick price movements. Best for 1-15min charts when making many trades per day.
Day Trading (8,120): Optimized for intraday movements with faster response than default settings while maintaining reasonable signal quality. Ideal for 5-60min or 4h-12h timeframes.
Swing Trading (10,200): Designed for multi-day positions with stronger noise filtering. Focuses on capturing larger price swings while avoiding minor fluctuations. Works best on 1-4h and daily charts.
Position Trading (14,250): For longer-term position traders/investors seeking significant market trends. Reduces false signals by heavily filtering market noise. Ideal for daily or even weekly charts.
Trend Following (16,300): Maximum smoothing that prioritizes established directional movements over short-term fluctuations. Best used on daily and weekly charts, but can also be used for lower timeframe trading.
Countertrend (7,100): Tuned to detect potential reversals and exhaustion points in trends. More sensitive to momentum shifts than other presets. Effective on 15min-4h charts, as well as daily and weekly charts.
Each preset automatically adjusts internal parameters for optimal performance in the selected trading context, providing flexibility across different market approaches without requiring complex manual configuration.
🟢 Practical Usage Tips
1/ Trend Analysis and Interpretation
→ Direction Assessment: Evaluate the oscillator's position relative to zero to determine underlying momentum bias
→ Momentum Strength: Measure the oscillator's distance from zero within the -100 to +100 range to quantify momentum magnitude
→ Trend Consistency: Monitor the oscillator's path for sustained directional movement without frequent zero-line crossings
→ Reversal Detection: Watch for oscillator divergence from price and deceleration of movement when approaching extreme zones
2/ Signal Generation Strategies
Depending on your trading approach, multiple signal strategies can be employed:
Trend Following Signals:
Enter long positions when the oscillator crosses above zero
Enter short positions when the oscillator crosses below zero
Add to positions on pullbacks while maintaining the overall trend direction
Countertrend Signals:
Look for potential reversals when the oscillator reaches extreme zones (±95)
Enter contrary positions when momentum shows signs of exhaustion
Use oscillator divergence with price as additional confirmation
Momentum Shift Signals:
Enter positions when oscillator changes direction after establishing a trend
Exit positions when oscillator direction reverses against your position
Scale position size based on oscillator strength percentage
3/ Timeframe Optimization
The indicator can be effectively applied across different timeframes with these considerations:
Lower Timeframes (1-15min):
Use Scalping or Day Trading presets
Focus on quick momentum shifts and zero-line crossings
Be cautious of noise in extreme market conditions
Medium Timeframes (30min-4h):
Use Default or Swing Trading presets
Look for established trends and potential reversal zones
Combine with support/resistance analysis for entry/exit precision
Higher Timeframes (Daily+):
Use Position Trading or Trend Following presets
Focus on major trend identification and long-term positioning
Use extreme zones for position management rather than immediate reversals
🟢 Pro Tips
Price Momentum Period:
→ Lower values (5-7) increase sensitivity to minor price fluctuations but capture more market noise
→ Higher values (10-16) emphasize sustained momentum shifts at the cost of delayed response
→ Adjust based on your timeframe (lower for shorter timeframes, higher for longer timeframes)
Oscillator Filter Period:
→ Lower values (80-120) produce more frequent directional changes and earlier response to momentum shifts
→ Higher values (200-300) filter out shorter-term fluctuations to highlight dominant market cycles
→ Match to your typical holding period (shorter holding time = lower filter values)
Multi-Timeframe Analysis:
→ Compare oscillator readings across different timeframes for confluence
→ Look for alignment between higher and lower timeframe signals
→ Use higher timeframe for trend direction, lower for earlier entries
Volatility-Adaptive Trading:
→ Use oscillator strength to adjust position sizing (stronger = larger)
→ Consider reducing exposure when oscillator reaches extreme zones
→ Implement tighter stops during periods of oscillator acceleration
Combination Strategies:
→ Pair with volume indicators for confirmation of momentum shifts
→ Use with support/resistance levels for strategic entry and exit points
→ Combine with volatility indicators for comprehensive market context

Zig Zag + Fibonacci PROPlots ZigZag structure with optional Fibonacci retracement levels.
Helps identify recent highs/lows and possible support/resistance zones.
Customizable levels and alert on price cross.

订单流轨迹自动交易脚本《订单流交易》一书系统性地介绍了订单流(Order Flow)这一市场分析方法,强调通过分析市场中每一价位的主动买卖单量,捕捉供需力量的变化,从而预判价格趋势的延续或反转。以下是核心内容提炼:
1. 订单流的核心概念
订单流定义:通过实时追踪每个价位的主动买单和卖单成交量,揭示市场供需力量的动态平衡。与传统K线图(仅显示开盘、收盘、最高、最低价)不同,订单流深入价格内部,展示买卖双方的博弈细节。
关键指标:
Delta:单根K线内主动买单总量减去主动卖单总量的差值,反映多空力量强弱。
POC(成交量最大价位):K线内部成交量最大的价格点,揭示多空争夺的核心区域。
失衡现象:当某一价位的主动买单量显著高于卖单(需求失衡)或反之(供应失衡),阈值通常设为3:1。
堆积失衡:连续多个价位出现供需失衡,形成支撑/阻力带。
2. 订单流的优势
实时性:直接反映市场当下行为,而非滞后指标(如MACD、RSI)。
识别主力动向:通过大单、微单、被套交易者等信号,捕捉机构或主力资金的痕迹。
大单:顶部/底部成交量显著高于相邻价位,表明主力介入。
微单:顶部/底部成交量骤减,显示趋势末端力量衰竭。
被套交易者:趋势末端大量反向成交,导致价格反转(如顶部放量却无法突破)。
3. 订单流的分析方法
价格与成交量结合:
健康上涨:伴随主动买单递增,Delta为正且放大。
弱势反转:顶部出现需求失衡但价格回落,或底部供应失衡却未创新低。
关键价位的应用:
支撑/阻力:通过前日高低点、VWAP(成交量加权平均价)、月线级别高低点等判断。
突破与回踩:价格突破关键位后回踩确认,结合订单流验证有效性。
4. 交易策略与实战应用
高胜率信号:
顶部/底部微单:趋势末端成交量萎缩,预示反转(如顶部主动买单骤减)。
失衡堆积:连续失衡形成支撑/阻力带,回踩时入场。
吸收与主动出击:价格在区间内震荡(吸收)后突破,伴随成交量放大。
资金管理与心理:
止损设置:基于失衡区间或关键价位,控制单笔亏损(如1-2跳)。
空仓纪律:无明确信号时保持观望,避免过度交易。
5. 与传统技术的对比
K线图的局限:无法展示价格内部成交细节,仅依赖形态(如十字星、吞噬)易被误导。
订单流的独特性:通过微观成交数据,识别市场情绪(如恐慌性抛售或贪婪追涨),避免“看图说话”的滞后性。
6. 适用场景与市场
高流动性市场:期货、股指、外汇等,需足够成交量支撑订单流分析。
日内与波段交易:短周期(如15分钟)捕捉供需突变,长周期验证趋势强度。
总结
订单流的核心在于通过实时成交数据,理解市场参与者的行为逻辑,从而在趋势启动初期或反转前捕捉机会。它并非预测工具,而是通过供需力量对比,为交易决策提供客观依据。结合严格的资金管理和心理纪律,订单流能显著提升交易的胜率与盈亏比。
**"Order Flow Trading"** systematically introduces the market analysis method of **Order Flow**, emphasizing the capture of supply-demand dynamics by analyzing active buy/sell volumes at each price level to anticipate trend continuations or reversals. Below is a distilled summary of the core concepts:
---
### **1. Core Concepts of Order Flow**
- **Definition**:
Order Flow tracks real-time active buy/sell volumes at each price level, revealing the dynamic balance between supply and demand. Unlike traditional candlestick charts (which only show open, close, high, and low prices), Order Flow dives into price internals, exposing the battle between buyers and sellers.
- **Key Metrics**:
- **Delta**: The difference between total active buy volume and sell volume within a single candlestick, reflecting bullish/bearish strength.
- **POC (Point of Control)**: The price level with the highest volume in a candlestick, indicating the focal point of buyer-seller conflict.
- **Imbalance**: Occurs when buy volume significantly exceeds sell volume (**demand imbalance**, threshold ~3:1) or vice versa (**supply imbalance**).
- **Cumulative Imbalance**: Consecutive price levels with imbalances, forming support/resistance zones.
---
### **2. Advantages of Order Flow**
- **Real-Time Insight**: Reflects immediate market behavior, unlike lagging indicators (e.g., MACD, RSI).
- **Identifying Institutional Activity**: Detects "smart money" footprints through signals like:
- **Large Orders**: Unusually high volume at tops/bottoms, signaling institutional participation.
- **Micro Orders**: Abrupt volume drops at trend extremes, indicating exhaustion.
- **Trapped Traders**: Reversals triggered by countertrend volume surges (e.g., failed breakouts with high sell volume).
---
### **3. Analytical Techniques**
- **Price-Volume Integration**:
- **Healthy Rally**: Rising buy volume with expanding positive Delta.
- **Weak Reversal**: Demand imbalance at tops with price rejection, or supply imbalance at bottoms without new lows.
- **Key Price Levels**:
- **Support/Resistance**: Identified via prior highs/lows, VWAP (Volume-Weighted Average Price), or monthly levels.
- **Breakout & Retest**: Validate breakouts using Order Flow after price retests key levels.
---
### **4. Trading Strategies & Execution**
- **High-Probability Signals**:
- **Micro Orders at Extremes**: Volume drying up at tops/bottoms signals reversals.
- **Cumulative Imbalance Zones**: Enter on pullbacks to stacked imbalance areas.
- **Absorption & Breakouts**: Post-consolidation breakouts with volume expansion.
- **Risk & Psychology**:
- **Stop Loss**: Set 1-2 ticks outside imbalance zones or key levels.
- **Flat Discipline**: Avoid overtrading; act only on clear signals.
---
### **5. Order Flow vs. Traditional Analysis**
- **Candlestick Limitations**: Reliance on patterns (e.g., doji, engulfing) often leads to false signals due to missing internal price data.
- **Order Flow Edge**: Leverages granular trade data to detect market sentiment (e.g., panic selling or FOMO buying), avoiding lagging "chart storytelling."
---
### **6. Applicable Markets & Timeframes**
- **High-Liquidity Markets**: Futures, indices, forex (sufficient volume for Order Flow analysis).
- **Timeframes**:
- **Intraday/Swing**: Short-term (e.g., 15min) for sudden supply-demand shifts.
- **Long-Term**: Validate trend strength on higher timeframes (e.g., daily).
---
### **Summary**
Order Flow focuses on interpreting real-time transactional data to decode market participant behavior, capturing opportunities at trend inception or reversal points. It is not a predictive tool but a framework for objective decision-making through supply-demand analysis. Combined with strict risk management and psychological discipline, Order Flow enhances trade accuracy and profit potential.

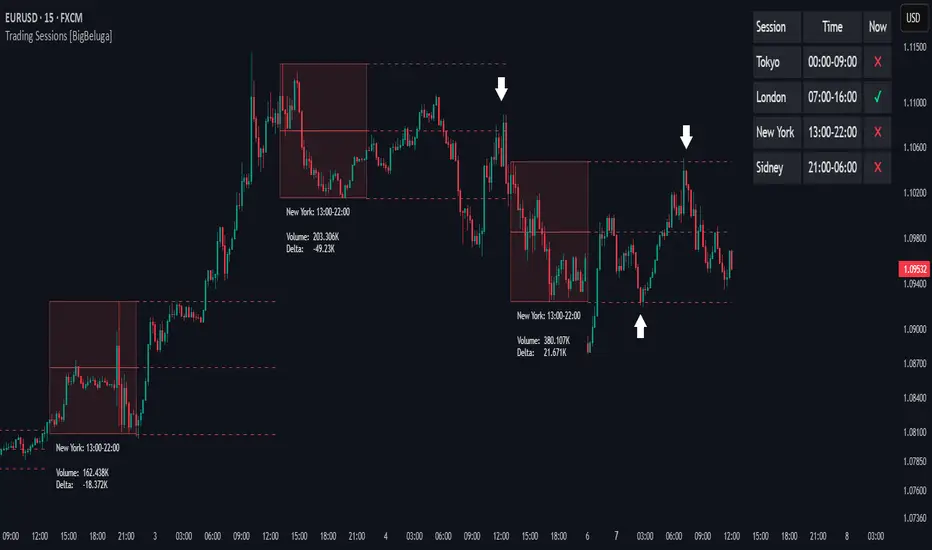
Trading Sessions [BigBeluga]
This indicator brings Smart Money Concept (ICT) session logic to life by plotting key global trading sessions with volume and delta analytics. It not only highlights session ranges but also tracks their midpoints — which often act as intraday support/resistance levels.
🔵 KEY FEATURES
Visual session boxes: Plots boxes for Tokyo, London, New York, and Sydney sessions based on user-defined UTC+0 time ranges.
Volume & delta metrics: Displays total volume and delta volume (buy–sell difference) within each session.
Mid, High & Low Range Extension: Once a session ends, the high, low, and midpoint levels automatically extend — ideal for detecting SR zones.
Session labels: Each box includes a label with session name, time, volume, and delta for quick reference.
Custom session control: Enable or disable sessions individually and configure start/end times.
Clean aesthetics: Transparent shaded boxes with subtle borders make it easy to overlay without clutter.
Sessions Dashboard: Shows the time range of each session and tells you whether the session is currently active.
🔵 USAGE
Enable the sessions you want to monitor (e.g., New York or Tokyo) from the settings.
Use session volume and delta values to gauge the strength and direction of institutional activity.
Watch for price interaction with the extended range — it often acts as dynamic support/resistance after the session ends.
Overlay it with liquidity tools or breaker blocks for intraday strategy alignment.
🔵 EXAMPLES
Extended Future Range acted as resistance/support.
Delta value helped confirm bullish pressure during New York open.
Multiple sessions helped identify kill zone overlaps and high-volume turns.
Trading Sessions is more than just a visual scheduler — it's a precision tool for traders who align with session-based volume dynamics and ICT methodology. Use it to define high-probability zones, confirm volume shifts, and read deeper into the true intent behind market structure.
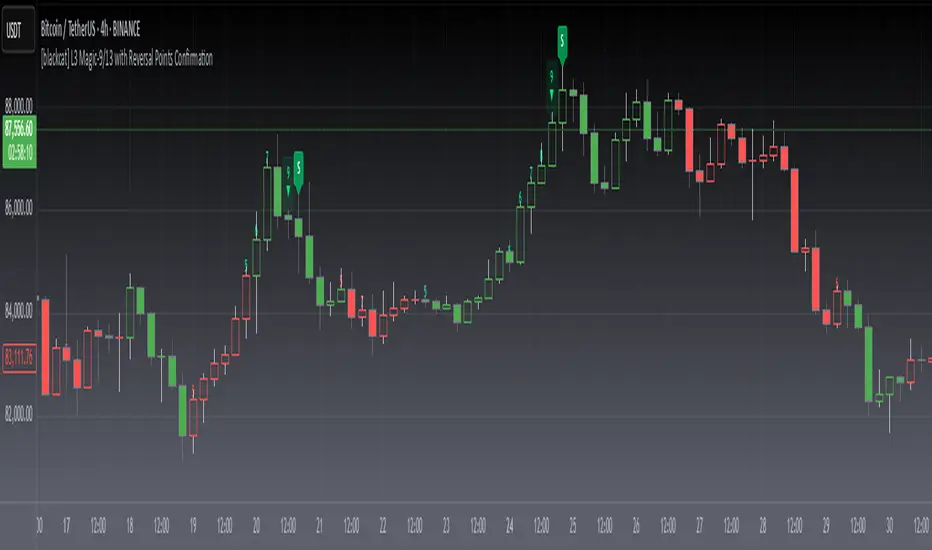
[blackcat] L3 Magic-9/13 with Reversal Points ConfirmationOVERVIEW
The L3 Magic-9/13 with Reversal Points Confirmation indicator is designed to help traders identify potential reversal points in the market using a sequential approach. This indicator adopts the "buy when fearful, sell when greedy" philosophy, focusing on capturing key reversal moments 📉↗️. It plots labels on the chart to indicate these reversal points and uses custom functions to filter occurrences based on specific conditions.
FEATURES
Identifies consecutive price movements to detect potential reversals.
Plots labels for various sequential patterns:
High Sequentials: 5, 6, 7, 8, 9, 12, 13
Low Sequentials: 5, 6, 7, 8, 9, 12, 13
Uses custom functions to count consecutive occurrences and filter conditions.
Provides visual confirmation of reversal points with colored labels 🏷️.
Allows customization of sequence lengths and lookback periods ⚙️.
HOW TO USE
Add the indicator to your TradingView chart by selecting it from the indicators list.
Observe the plotted labels indicating potential reversal zones:
Green labels for buy signals ('B').
Red labels for sell signals ('S').
Customize the sequence lengths and lookback periods as needed in the settings panel.
Combine this indicator with other tools for confirmation before making trading decisions.
LIMITATIONS
The indicator relies heavily on sequential patterns, which might not capture all market nuances.
False signals can occur in ranging or sideways markets 🌪️.
Users should always confirm signals with other forms of analysis.
NOTES
Ensure that you have sufficient historical data available for accurate calculations.
Test the indicator thoroughly on demo accounts before applying it to live trading 🔍.
Understand the concept of buying at bottoms and selling at tops before using this indicator.
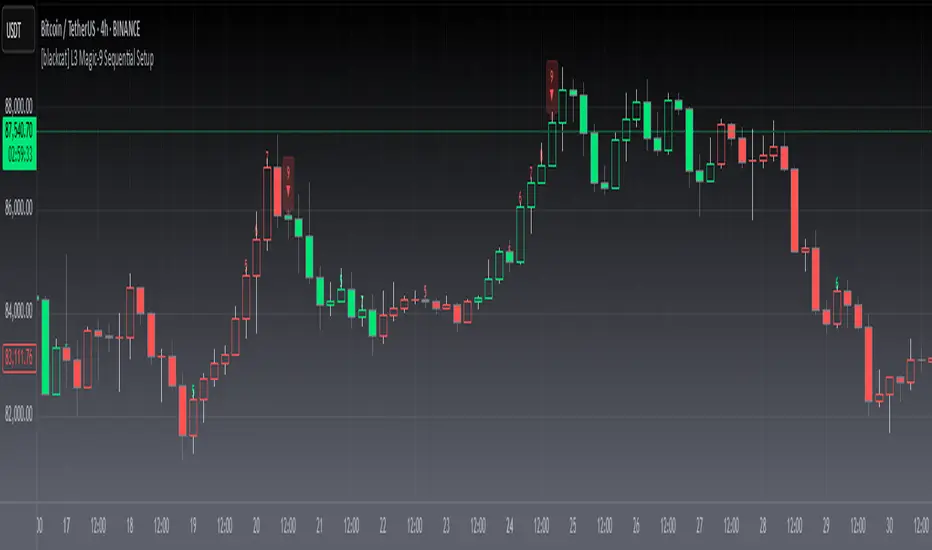
[blackcat] L3 Magic-9 Sequential SetupOVERVIEW
The L3 Magic-9 Sequential Setup indicator is designed to identify potential reversal points in the market using a sequential pattern analysis. This script plots specific labels on the chart based on predefined conditions, helping traders spot key levels where price reversals might occur 📉↗️.
FEATURES
Identifies consecutive occurrences of price movements above or below certain thresholds.
Plots labeled markers on the chart for easy visualization:
Red Labels: Indicate potential sell signals (e.g., '5', '6', '7', etc.).
Green Labels: Indicate potential buy signals (e.g., '5', '6', '7', etc.)
Uses custom functions to filter and count occurrences over specified lookback periods ⚙️.
Changes bar colors based on detected signals for enhanced visual cues 🎨.
Supports extensive customization through input parameters for fine-tuning the setup.
HOW TO USE
Add the indicator to your TradingView chart by selecting it from the indicators list.
Observe the plotted labels ('5', '6', '7', etc.) indicating potential reversal zones.
Pay attention to bar color changes that confirm the identified patterns.
Combine this indicator with other tools for confirmation before making trading decisions.
LIMITATIONS
The indicator relies heavily on sequential patterns, which may not capture all market nuances.
False signals can occur in ranging or sideways markets 🌪️.
Users should always confirm signals with other forms of analysis.
NOTES
Ensure that you have sufficient historical data available for accurate calculations.
Test the indicator thoroughly on demo accounts before applying it to live trading 🔍.
Customize input parameters as needed to fit your trading strategy.
Scalping Strategy (by Plan-F7)Scalping Strategy (by Plan-F7)
A powerful scalping indicator optimized for lower timeframes (5-min and 15-min).
It combines multiple technical indicators for high-probability entries:
RSI & Stochastic RSI for overbought/oversold signals
MACD for trend confirmation
EMA 9 & EMA 21 to define trend direction
ADX to filter trades based on trend strength
ATR for dynamic Take Profit and Stop Loss levels
How to use:
Green arrow with "BUY" label = Buy Signal
Red arrow with "SELL" label = Sell Signal
TP and SL levels are automatically plotted
Best used on 5-min or 15-min charts for fast entries
Supports visual and audio alerts
مؤشر سكالبينج (Scalping Strategy by Plan-F7)
مصمم خصيصًا للتداول السريع على الفريمات الصغيرة (5 دقائق و15 دقيقة).
يعتمد على دمج عدة مؤشرات فنية قوية:
RSI و Stochastic RSI لتحديد مناطق التشبع الشرائي/البيعي
MACD لتأكيد الاتجاه
المتوسطات المتحركة (EMA 9 و 21) لتحديد الاتجاه العام
ADX لتأكيد قوة الاتجاه قبل الدخول
ATR لحساب الأهداف (Take Profit) ووقف الخسارة (Stop Loss) بشكل ديناميكي
طريقة الاستخدام:
إشارات الشراء تظهر بسهم أخضر وكلمة "BUY"
إشارات البيع تظهر بسهم أحمر وكلمة "SELL"
تظهر خطوط على الشارت تمثل الأهداف ووقف الخسارة
يمكن استخدامه على فريم 5 أو 15 دقيقة لتحقيق صفقات سريعة بدقة عالية
يدعم تنبيهات بصرية وصوتية

GIGANEVA V6.61 PublicThis enhanced Fibonacci script for TradingView is a powerful, all-in-one tool that calculates Fibonacci Levels, Fans, Time Pivots, and Golden Pivots on both logarithmic and linear scales. Its ability to compute time pivots via fan intersections and Range interactions, combined with user-friendly features like Bool Fib Right, sets it apart. The script maximizes TradingView’s plotting capabilities, making it a unique and versatile tool for technical analysis across various markets.
1. Overview of the Script
The script appears to be a custom technical analysis tool built for TradingView, improving upon an existing script from TradingView’s Community Scripts. It calculates and plots:
Fibonacci Levels: Standard retracement levels (e.g., 0.236, 0.382, 0.5, 0.618, etc.) based on a user-defined price range.
Fibonacci Fans: Trendlines drawn from a high or low point, radiating at Fibonacci ratios to project potential support/resistance zones.
Time Pivots: Points in time where significant price action is expected, determined by the intersection of Fibonacci Fans or their interaction with key price levels.
Golden Pivots: Specific time pivots calculated when the 0.5 Fibonacci Fan (on a logarithmic or linear scale) intersects with its counterpart.
The script supports both logarithmic and linear price scales, ensuring versatility across different charting preferences. It also includes a feature to extend Fibonacci Fans to the right, regardless of whether the user selects the top or bottom of the range first.
2. Key Components Explained
a) Fibonacci Levels and Fans from Top and Bottom of the "Range"
Fibonacci Levels: These are horizontal lines plotted at standard Fibonacci retracement ratios (e.g., 0.236, 0.382, 0.5, 0.618, etc.) based on a user-defined price range (the "Range"). The Range is typically the distance between a significant high (top) and low (bottom) on the chart.
Example: If the high is $100 and the low is $50, the 0.618 retracement level would be at $80.90 ($50 + 0.618 × $50).
Fibonacci Fans: These are diagonal lines drawn from either the top or bottom of the Range, radiating at Fibonacci ratios (e.g., 0.382, 0.5, 0.618). They project potential dynamic support or resistance zones as price evolves over time.
From Top: Fans drawn downward from the high of the Range.
From Bottom: Fans drawn upward from the low of the Range.
Log and Linear Scale:
Logarithmic Scale: Adjusts price intervals to account for percentage changes, which is useful for assets with large price ranges (e.g., cryptocurrencies or stocks with exponential growth). Fibonacci calculations on a log scale ensure ratios are proportional to percentage moves.
Linear Scale: Uses absolute price differences, suitable for assets with smaller, more stable price ranges.
The script’s ability to plot on both scales makes it adaptable to different markets and user preferences.
b) Time Pivots
Time pivots are points in time where significant price action (e.g., reversals, breakouts) is anticipated. The script calculates these in two ways:
Fans Crossing Each Other:
When two Fibonacci Fans (e.g., one from the top and one from the bottom) intersect, their crossing point represents a potential time pivot. This is because the intersection indicates a convergence of dynamic support/resistance zones, increasing the likelihood of a price reaction.
Example: A 0.618 fan from the top crosses a 0.382 fan from the bottom at a specific bar on the chart, marking that bar as a time pivot.
Fans Crossing Top and Bottom of the Range:
A fan line (e.g., 0.5 fan from the bottom) may intersect the top or bottom price level of the Range at a specific time. This intersection highlights a moment where the fan’s projected support/resistance aligns with a key price level, signaling a potential pivot.
Example: The 0.618 fan from the bottom reaches the top of the Range ($100) at bar 50, marking bar 50 as a time pivot.
c) Golden Pivots
Definition: Golden pivots are a special type of time pivot calculated when the 0.5 Fibonacci Fan on one scale (logarithmic or linear) intersects with the 0.5 fan on the opposite scale (or vice versa).
Significance: The 0.5 level is the midpoint of the Fibonacci sequence and often acts as a critical balance point in price action. When fans at this level cross, it suggests a high-probability moment for a price reversal or significant move.
Example: If the 0.5 fan on a logarithmic scale (drawn from the bottom) crosses the 0.5 fan on a linear scale (drawn from the top) at bar 100, this intersection is labeled a "Golden Pivot" due to its confluence of key Fibonacci levels.
d) Bool Fib Right
This is a user-configurable setting (a boolean input in the script) that extends Fibonacci Fans to the right side of the chart.
Functionality: When enabled, the fans project forward in time, regardless of whether the user selected the top or bottom of the Range first. This ensures consistency in visualization, as the direction of the Range selection (top-to-bottom or bottom-to-top) does not affect the fan’s extension.
Use Case: Traders can use this to project future support/resistance zones without worrying about how they defined the Range, improving usability.
3. Why Is This Code Unique?
Original calculation of Log levels were taken from zekicanozkanli code. Thank you for giving me great Foundation, later modified and applied to Fib fans. The script’s uniqueness stems from its comprehensive integration of Fibonacci-based tools and its optimization for TradingView’s plotting capabilities. Here’s a detailed breakdown:
All-in-One Fibonacci Tool:
Most Fibonacci scripts on TradingView focus on either retracement levels, extensions, or fans.
This script combines:
Fibonacci Levels: Static horizontal lines for retracement and extension.
Fibonacci Fans: Dynamic trendlines for projecting support/resistance.
Time Pivots: Temporal analysis based on fan intersections and Range interactions.
Golden Pivots: Specialized pivots based on 0.5 fan confluences.
By integrating these functions, the script provides a holistic Fibonacci analysis tool, reducing the need for multiple scripts.
Log and Linear Scale Support:
Many Fibonacci tools are designed for linear scales only, which can distort projections for assets with exponential price movements. By supporting both logarithmic and linear scales, the script caters to a wider range of markets (e.g., stocks, forex, crypto) and user preferences.
Time Pivot Calculations:
Calculating time pivots based on fan intersections and Range interactions is a novel feature. Most TradingView scripts focus on price-based Fibonacci levels, not temporal analysis. This adds a predictive element, helping traders anticipate when significant price action might occur.
Golden Pivot Innovation:
The concept of "Golden Pivots" (0.5 fan intersections across scales) is a unique addition. It leverages the symmetry of the 0.5 level and the differences between log and linear scales to identify high-probability pivot points.
Maximized Plot Capabilities:
TradingView imposes limits on the number of plots (lines, labels, etc.) a script can render. This script is coded to fully utilize these limits, ensuring that all Fibonacci levels, fans, pivots, and labels are plotted without exceeding TradingView’s constraints.
This optimization likely involves efficient use of arrays, loops, and conditional plotting to manage resources while delivering a rich visual output.
User-Friendly Features:
The Bool Fib Right option simplifies fan projection, making the tool intuitive even for users who may not consistently select the Range in the same order.
The script’s flexibility in handling top/bottom Range selection enhances usability.
4. Potential Use Cases
Trend Analysis: Traders can use Fibonacci Fans to identify dynamic support/resistance zones in trending markets.
Reversal Trading: Time pivots and Golden Pivots help pinpoint moments for potential price reversals.
Range Trading: Fibonacci Levels provide key price zones for trading within a defined range.
Cross-Market Application: Log/linear scale support makes the script suitable for stocks, forex, commodities, and cryptocurrencies.
The original code was from zekicanozkanli . Thank you for giving me great Foundation.

nova_v2🌟 Key Features of the Target Trend Indicator 🌟
🎯 Market Trend Identification: The indicator utilizes advanced technology based on modified moving averages and the ATR indicator to determine the current market direction with incredible precision!
🎨 Candlestick Coloring: It changes the color of candlesticks according to the identified trend, making it super easy for traders to visually understand the prevailing direction at a glance!
🚀 Target Level Identification: The indicator automatically calculates three potential price targets and marks them with clear lines and precise labels - no more guesswork!
📊 Entry and Exit Points Clarification: It clearly identifies the appropriate entry point and stop-loss level, helping traders manage risk effectively and maximize profits!
⚙️ Flexible Settings: It allows users to adjust parameters such as trend length and target levels according to their specific trading needs and preferences!
💼 How to Benefit from the Indicator 💼
You can use the Target Trend Indicator in several trading strategies:
🌊 Trading with the Trend: Traders can use the indicator's signals to enter trades that align with the general market direction for higher probability setups!
💰 Multiple Profit-Taking Strategy: With three target levels, traders can implement a partial exit strategy at each target level to lock in profits while letting winners run!
↩️ Market Reversal Point Detection: The indicator helps identify potential turning points in the market, allowing traders to adjust their strategies accordingly and stay ahead of the crowd!
🔍 Practical Application 🔍
The indicator works effectively on the 15-minute timeframe and is perfect for active traders who prefer shorter timeframes. However, it can also be used on other timeframes by adjusting the parameters accordingly!
The indicator relies on an advanced algorithm that combines exponential moving averages (EMA) and the Average True Range (ATR) indicator to provide accurate signals. It also offers visual market analysis by highlighting potential support and resistance areas!
📈 Potential Results 📈
Using this indicator can help traders:
Improve the risk-to-reward ratio in trades for better overall portfolio performance!
Identify more precise entry and exit points to maximize profits!
Gain a better understanding of market dynamics and trends for smarter trading decisions!
Make more confident trading decisions with less emotional influence - trade like a pro!

SteveStrat 15MThis report provides a professional analysis of the BTC/USD pair on the 5-minute timeframe, focusing on an "Up and Down" trend assessment using Exponential Moving Averages (EMAs) and supplementary technical indicators. The goal is to identify the current trend and predict its future development based on real-time price data and market signals.

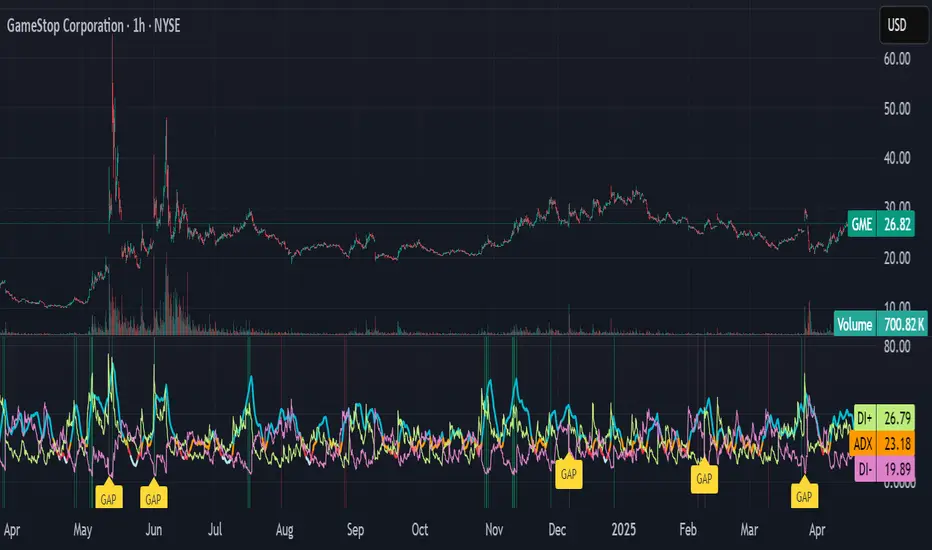
ADX Divergence and Gap Monitor [theUltimator5]ADX Divergence and Gap Monitor is a custom technical analysis tool designed to visualize momentum imbalances and sudden shifts in trend participation using the ADX system. It combines traditional ADX, DI+ and DI− calculations with dynamic filtering and visual highlighting to help identify key moments of directional acceleration or weakening.
🔍 What It Does:
This indicator builds on the Average Directional Index (ADX) system to detect conditions where market trend strength diverges significantly from directional input (DI) activity. It includes two major visual signals:
Highlight Backgrounds
These appear when the indicator detects a “gap” or sudden acceleration in DI values while ADX remains low, suggesting early-stage momentum bursts or signal noise spikes.
The trigger threshold for DI change can be adjusted using the Gap Trigger Level input.
A background highlight is shown when DI+ or DI− increases sharply, either from a low-ADX environment or from a rapid standalone spike.
GAP Markers
Optional yellow label markers display the word "GAP" just below the lowest line (ADX, DI+, or DI−) whenever a gap condition is triggered. These provide a more noticeable visual cue without crowding the chart.
You can enable or disable the markers with the Show GAP Markers toggle.
🧠 Advanced Divergence Detection:
The script also scans for dominant ADX divergence events, where ADX is significantly higher than DI+ or DI−, indicating strong trend force with weak directional participation. When these conditions are met:
Red or green background fills appear depending on whether DI+ or DI− is being overpowered.
These conditions are based on customizable moving averages and DI strength relationships.
⚙️ Key Inputs:
ADX Length: Period for ADX calculation
DI Moving Average: Smoothing length for directional index signals
Gap Trigger Level: Minimum DI change needed to trigger a GAP highlight
Show Highlight Backgrounds: Toggle to display or hide background signals
Show GAP Markers: Toggle to show or hide text-based GAP labels
🧪 Use Cases:
Spot early breakouts or reversals when DI activity spikes while ADX is still low
Identify periods of trend exhaustion or false breakouts using divergence logic
Confirm trade entry points when ADX begins to rise after a GAP event
Zacks EMAs&MAs//@version=6
indicator(title="ZzzTrader EMAs&MAs", shorttitle="Zacks_crypt0", overlay=true)
// === Inputs ===
// ema13
ema13Source = input.source(close, "EMA13 Source")
ema13Length = input.int(13, "EMA13 Length", minval=1)
// ema25
ema25Source = input.source(close, "EMA25 Source")
ema25Length = input.int(25, "EMA25 Length", minval=1)
// ema32
ema32Source = input.source(close, "EMA32 Source")
ema32Length = input.int(32, "EMA32 Length", minval=1)
// ma100
ma100Source = input.source(close, "MA100 Source")
ma100Length = input.int(100, "MA100 Length", minval=1)
// ema200 - actually SMMA99
ema200Source = input.source(close, "EMA200 Source")
ema200Length = input.int(99, "EMA200 Length", minval=1)
// ma300
ma300Source = input.source(close, "MA300 Source")
ma300Length = input.int(300, "MA300 Length", minval=1)
// === Calculations ===
// Moving Averages
ma100 = ta.sma(ma100Source, ma100Length)
ma300 = ta.sma(ma300Source, ma300Length)
ema13 = ta.ema(ema13Source, ema13Length)
ema25 = ta.ema(ema25Source, ema25Length)
ema32 = ta.ema(ema32Source, ema32Length)
EMA200() =>
var float ema200 = 0.0
ema200 := na(ema200 ) ? ta.sma(ema200Source, ema200Length) : (ema200 * (ema200Length - 1) + ema200Source) / ema200Length
ema200
h4ema200 = request.security(syminfo.tickerid, "240", EMA200())
// === Plotting ===
// Draw lines
plot(series=ema13, title="EMA13", color=color.new(#6f20ee, 0), linewidth=1)
plot(series=ema25, title="EMA25", color=color.new(#1384e1, 0), linewidth=1, style=plot.style_stepline)
plot(series=ema32, title="EMA32", color=color.new(#ea4e2f, 0), linewidth=1, style=plot.style_circles)
plot(series=ma100, title="MA100", color=color.new(#47b471, 0), linewidth=1, style=plot.style_circles)
plot(series=ma300, title="MA300", color=color.new(#7f47b4, 0), linewidth=1, style=plot.style_cross)
plot(series=EMA200(), title="EMA200", color=color.new(#8d8a8a, 0), linewidth=1, style=plot.style_stepline)
// === Labels ===
// Initialize labels
var label ema13_label = na
var label ema25_label = na
var label ema32_label = na
var label ma100_label = na
var label ma300_label = na
var label ema200_label = na
// Calculate label position (offset to the right)
label_x = time + (ta.change(time) * 5)
show_prices = true
ema13_p_str = show_prices ? " - " + str.tostring(math.round_to_mintick(ema13)) : ""
ema25_p_str = show_prices ? " - " + str.tostring(math.round_to_mintick(ema25)) : ""
ema32_p_str = show_prices ? " - " + str.tostring(math.round_to_mintick(ema32)) : ""
ma100_p_str = show_prices ? " - " + str.tostring(math.round_to_mintick(ma100)) : ""
ma300_p_str = show_prices ? " - " + str.tostring(math.round_to_mintick(ma300)) : ""
ema200_p_str = show_prices ? " - " + str.tostring(math.round_to_mintick(EMA200())) : ""
h4ema200_p_str = show_prices ? " - " + str.tostring(math.round_to_mintick(h4ema200)) : ""
labelpadding = " "
ema13_label_txt = "EMA13" + ema13_p_str + labelpadding
ema25_label_txt = "EMA25" + ema25_p_str + labelpadding
ema32_label_txt = "EMA32" + ema32_p_str + labelpadding
ma100_label_txt = "MA100" + ma100_p_str + labelpadding
ma300_label_txt = "MA300" + ma300_p_str + labelpadding
ema200_label_txt = "EMA200" + ema200_p_str + labelpadding
// Delete previous labels to prevent duplicates
if not na(ema13_label )
label.delete(ema13_label )
if not na(ema25_label )
label.delete(ema25_label )
if not na(ema32_label )
label.delete(ema32_label )
if not na(ma100_label )
label.delete(ma100_label )
if not na(ma300_label )
label.delete(ma300_label )
if not na(ema200_label )
label.delete(ema200_label )
// Create new labels (no background/border)
ema13_label := label.new(
x=label_x,
y=ema13,
text=ema13_label_txt,
xloc=xloc.bar_time,
yloc=yloc.price,
textcolor=color.new(#6f20ee, 0),
style=label.style_none,
textalign=text.align_left
)
ema25_label := label.new(
x=label_x,
y=ema25,
text=ema25_label_txt,
xloc=xloc.bar_time,
yloc=yloc.price,
color=color.white,
textcolor=color.new(#1384e1, 0),
style=label.style_none,
textalign=text.align_left
)
ema32_label := label.new(
x=label_x,
y=ema32,
text=ema32_label_txt,
xloc=xloc.bar_time,
yloc=yloc.price,
color=color.white,
textcolor=color.new(#ea4e2f, 0),
style=label.style_none,
textalign=text.align_left
)
ma100_label := label.new(
x=label_x,
y=ma100,
text=ma100_label_txt,
xloc=xloc.bar_time,
yloc=yloc.price,
color=color.white,
textcolor=color.new(#47b471, 0),
style=label.style_none,
textalign=text.align_left
)
ma300_label := label.new(
x=label_x,
y=ma300,
text=ma300_label_txt,
xloc=xloc.bar_time,
yloc=yloc.price,
color=color.white,
textcolor=color.new(#7f47b4, 0),
style=label.style_none,
textalign=text.align_left
)
ema200_label := label.new(
x=label_x,
y=EMA200(),
text=ema200_label_txt,
xloc=xloc.bar_time,
yloc=yloc.price,
color=color.white,
textcolor=color.new(#8d8a8a, 0),
style=label.style_none,
textalign=text.align_left)

QQAI Order & Breaker BlocksQQAI on yo Headtop
detects order blocks that can automatically turn into breaker blocks on the chart once mitigated. However, the key difference/uniqueness is that the pure price action version relies solely on price patterns, eliminating the need for length definitions.

[blackcat] L3 Magic-9 MACD SetupOVERVIEW
The L3 Magic-9 MACD Setup indicator is meticulously crafted to assist traders in identifying precise buy and sell signals through an enhanced Moving Average Convergence Divergence (MACD) methodology. This advanced tool integrates the Magic-9 Sequential technique to refine signal accuracy by filtering out market noise. By providing clear visual cues via labeled charts and real-time alerts, it empowers users to make informed trading decisions swiftly and confidently 📈✅.
FEATURES
Customizable MACD Parameters:
Fast Length: Adjustable parameter to control the sensitivity of the fast moving average.
Slow Length: Configurable setting for the slow moving average to balance responsiveness and stability.
Signal Length: Modifiable value to determine the smoothing factor applied to the MACD line.
Dynamic Plot Visuals:
MACD Line: Representing the difference between short-term and long-term EMAs.
Signal Line: A smoothed version of the MACD line used to generate crossover signals.
Histogram: Illustrating the distance between the MACD and Signal lines, highlighting momentum changes.
All elements feature adjustable colors and styles for personalized visualization preferences 🎨.
Advanced Filtering Mechanism:
Utilizes the Magic-9 Sequential method to analyze consecutive price movements, enhancing signal reliability.
Counts sequential occurrences above or below initial values to detect trends more accurately 🔍.
Sequential Labels:
Displays numerical labels (e.g., '5', '6', etc.) at key points where sequential conditions are met, offering insights into trend strength.
Highlights significant reversals with special labels like '9' and '13' for critical decision-making moments 🏷️.
Buy/Sell Signals:
Generates clear 'B' (buy) and 'S' (sell) labels based on predefined conditions derived from sequential analysis.
Provides actionable trade suggestions directly on the chart for easy interpretation.
Alert System:
Supports customizable alerts to notify users instantly when buy/sell conditions are triggered.
Ensures timely responses to market movements without constant monitoring 🔔.
HOW TO USE
Add Indicator to Chart:
Access the TradingView platform and navigate to the indicators section.
Select ' L3 Magic-9 MACD Setup' from the list and add it to your desired chart.
Configure Settings:
Open the settings panel to adjust MACD parameters such as Fast Length, Slow Length, and Signal Length according to your trading strategy.
Modify plot colors and styles to suit your visual preferences for better readability.
Analyze Chart Labels:
Monitor the chart for sequentially numbered labels indicating trend strength and potential reversal points.
Pay close attention to special labels like '9' and '13' for crucial trading signals.
Combine with Other Tools:
Use additional technical indicators or fundamental analysis to confirm signals generated by the L3 Magic-9 MACD Setup.
Enhance decision-making accuracy by cross-verifying multiple data sources.
LIMITATIONS
Market Conditions Sensitivity:
The indicator may produce fewer reliable signals during periods of low volatility or range-bound markets.
Traders should be cautious of false positives in highly choppy environments 🌪️.
Dependency on Historical Data:
Accurate performance requires sufficient historical price data; insufficient data may lead to inaccurate calculations.
Regular updates and backtesting are essential to maintain effectiveness over time.
Single Indicator Risk:
Relying solely on MACD-based signals can miss broader market context; combining with other analytical tools is recommended.
Always validate signals through multiple lenses to mitigate risks associated with single-indicator strategies.
NOTES
Data Sufficiency:
Ensure your chart has enough historical data loaded to support robust MACD computations.
Periodically review and update data inputs to reflect current market dynamics.
Testing and Validation:
Conduct thorough testing on demo accounts before deploying the indicator in live trading scenarios.
Backtest across various market cycles to assess its resilience under different conditions.
Parameter Optimization:
Experiment with different parameter settings tailored to specific asset classes or trading styles.
Fine-tune the lookback period and other configurable options to align with personal trading objectives.
