Main features:
- Statistics Table
- Performance Analysis
- Seasonal Pivots
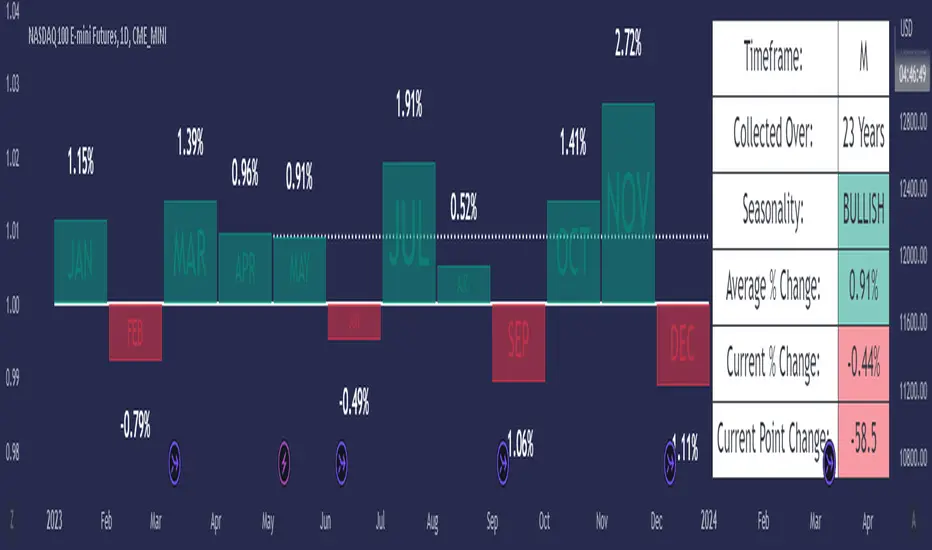
The Statistics Table provides a summarized view of the current seasonality: whether the average Day/Month/Quarter tends to be bullish or bearish, what the average percent change is, and what the current (actual) change is relative to the historical value. It is shown in the top right of this chart.
The Performance Analysis shows a histogram of the average percentage performance for the selected timeframe. Here we have options for Daily, Monthly, and Quarterly. The previous chart showed the Monthly timeframe, here we have the Daily and Quarterly.
Lastly, Seasonal Pivots show where highs and lows tend to be created throughout the year, based on an aggregation of the Daily performance data collected over the available years. If we anchor our data to the beginning of the current year, and then manually offset it by ~252 (depending on the year), we can line this data up with the previous years' data and observe how well these Seasonal Pivots lined up with major Daily highs and lows.
Styling options are available for every major component of this indicator. Please consider sharing if you find it useful!
Скрипт с открытым кодом
В истинном духе TradingView автор этого скрипта опубликовал его с открытым исходным кодом, чтобы трейдеры могли понять, как он работает, и проверить на практике. Вы можете воспользоваться им бесплатно, но повторное использование этого кода в публикации регулируется Правилами поведения.
Для быстрого доступа на графике добавьте этот скрипт в избранное — подробнее можно прочитать здесь.
Отказ от ответственности
Скрипт с открытым кодом
В истинном духе TradingView автор этого скрипта опубликовал его с открытым исходным кодом, чтобы трейдеры могли понять, как он работает, и проверить на практике. Вы можете воспользоваться им бесплатно, но повторное использование этого кода в публикации регулируется Правилами поведения.
Для быстрого доступа на графике добавьте этот скрипт в избранное — подробнее можно прочитать здесь.