OPEN-SOURCE SCRIPT
Global MPMI Overview
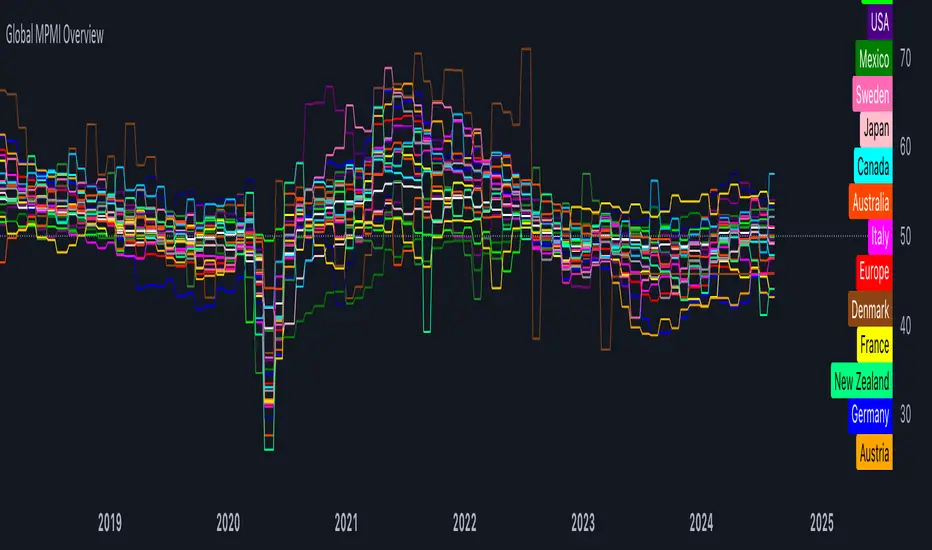
The Global MPMI Overview Indicator is designed to provide a comprehensive view of the Manufacturing Purchasing Managers' Index (PMI) for various countries and regions. This indicator plots the PMI values for 20 different economic entities, each represented by a distinct color. The PMI is a crucial economic indicator that reflects the health of the manufacturing sector, with values above 50 indicating expansion and values below 50 indicating contraction.
Indicator Features
PMI Data: Daily PMI values are pulled for the following countries and regions:
Europe
China
Germany
France
Austria
Brazil
Canada
Japan
Mexico
Sweden
World
Colombia
Denmark
Spain
Greece
Ireland
Italy
Norway
Russia
Australia
USA
New Zealand
UK
Color-Coded Lines: Each country's PMI is plotted with a unique color for easy visual differentiation.
Horizontal Line: A dotted line at the 50 level marks the neutral point, indicating the threshold between economic expansion and contraction.
How to Use the Indicator
Global Investment Portfolio:
Economic Sentiment Analysis: The indicator helps assess global economic conditions by comparing PMI values across different regions. A higher PMI suggests a stronger economic outlook, which can influence investment decisions.
Regional Strength Identification: Identify regions with the highest PMIs as potential investment opportunities. Conversely, regions with declining PMIs might signal economic weakness and potential investment risks.
Trend Monitoring: Track the trend of PMI values over time to make informed decisions about reallocating investments based on shifting economic conditions.
Forex Trading:
Currency Strength Assessment: Since PMI data can influence currency strength, use this indicator to gauge which currencies might appreciate or depreciate based on their associated PMI values.
Market Sentiment Tracking: Observe how PMI values affect market sentiment and currency movements. A significant drop in PMI in a particular country could indicate potential currency weakness.
Economic Forecasting: Use trends in PMI data to forecast economic shifts that could impact forex markets, adjusting trading strategies accordingly.
Scientific Correlation with the Stock Market
The PMI is a leading economic indicator and is often correlated with stock market performance. Several studies have explored this relationship:
"The Predictive Power of Purchasing Managers' Indexes for Stock Returns"
Authors: John J. McConnell and Chris J. Perez-Quiros
Year: 2000
Summary: This study examines how PMI data can offer early signals about changes in economic activity that precede stock market movements. The authors find that PMI data has predictive power for stock returns.
"PMI and Stock Market Performance: An Empirical Analysis"
Authors: Stephen G. Cecchetti and Kermit L. Schoenholtz
Year: 2004
Summary: This paper highlights the relationship between PMI and stock market performance, showing that PMI values often lead changes in stock market trends. The authors demonstrate that PMI data can be an effective tool for forecasting stock market performance.
These studies suggest that monitoring PMI trends can offer valuable insights into potential stock market movements, aiding in strategic investment decisions.
Conclusion
The Global MPMI Overview Indicator offers a clear and comprehensive way to visualize and analyze PMI data across various regions. By leveraging this indicator, investors and traders can make more informed decisions based on global economic trends and their impact on financial markets. Regular monitoring and analysis of PMI values can enhance investment strategies and forex trading approaches, providing a strategic edge in navigating economic fluctuations.
Скрипт с открытым кодом
В истинном духе TradingView автор этого скрипта опубликовал его с открытым исходным кодом, чтобы трейдеры могли понять, как он работает, и проверить на практике. Вы можете воспользоваться им бесплатно, но повторное использование этого кода в публикации регулируется Правилами поведения. Вы можете добавить этот скрипт в избранное и использовать его на графике.
Отказ от ответственности
Все виды контента, которые вы можете увидеть на TradingView, не являются финансовыми, инвестиционными, торговыми или любыми другими рекомендациями. Мы не предоставляем советы по покупке и продаже активов. Подробнее — в Условиях использования TradingView.