OPEN-SOURCE SCRIPT
TechniTrend: Average Volatility
Обновлено
TechniTrend: Average Volatility
Description:
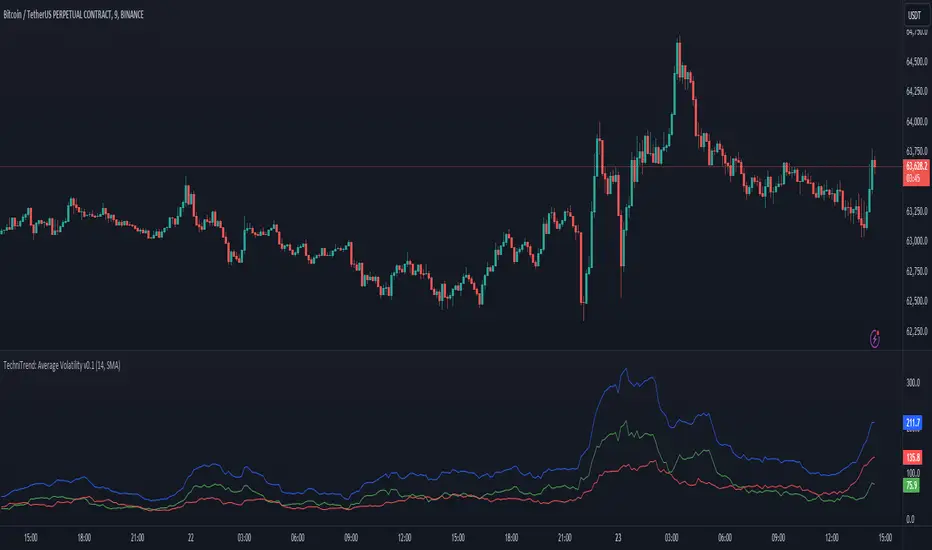
The "Average Volatility" indicator provides a comprehensive measure of market volatility by offering three different types of volatility calculations: High to Low, Body, and Shadows. The indicator allows users to apply various types of moving averages (SMA, EMA, SMMA, WMA, and VWMA) on these volatility measures, enabling a more flexible approach to trend analysis and volatility tracking.
Key Features:
Customizable Volatility Types:
High to Low: Measures the range between the highest and lowest prices in the selected period.
Body: Measures the absolute difference between the opening and closing prices of each candle (just the body of the candle).
Shadows: Measures the difference between the wicks (shadows) of the candle.
Flexible Moving Averages:
Choose from five different types of moving averages to apply on the calculated volatility:
SMA (Simple Moving Average)
EMA (Exponential Moving Average)
SMMA (RMA) (Smoothed Moving Average)
WMA (Weighted Moving Average)
VWMA (Volume-Weighted Moving Average)
Custom Length:
Users can customize the period length for the moving averages through the Length input.
Visualization:
Three separate plots are displayed, each representing the average volatility of a different type:
Blue: High to Low volatility.
Green: Candle body volatility.
Red: Candle shadows volatility.
-------------------------------------------
This indicator offers a versatile and highly customizable tool for analyzing volatility across different components of price movement, and it can be adapted to different trading styles or market conditions.
Description:
The "Average Volatility" indicator provides a comprehensive measure of market volatility by offering three different types of volatility calculations: High to Low, Body, and Shadows. The indicator allows users to apply various types of moving averages (SMA, EMA, SMMA, WMA, and VWMA) on these volatility measures, enabling a more flexible approach to trend analysis and volatility tracking.
Key Features:
Customizable Volatility Types:
High to Low: Measures the range between the highest and lowest prices in the selected period.
Body: Measures the absolute difference between the opening and closing prices of each candle (just the body of the candle).
Shadows: Measures the difference between the wicks (shadows) of the candle.
Flexible Moving Averages:
Choose from five different types of moving averages to apply on the calculated volatility:
SMA (Simple Moving Average)
EMA (Exponential Moving Average)
SMMA (RMA) (Smoothed Moving Average)
WMA (Weighted Moving Average)
VWMA (Volume-Weighted Moving Average)
Custom Length:
Users can customize the period length for the moving averages through the Length input.
Visualization:
Three separate plots are displayed, each representing the average volatility of a different type:
Blue: High to Low volatility.
Green: Candle body volatility.
Red: Candle shadows volatility.
-------------------------------------------
This indicator offers a versatile and highly customizable tool for analyzing volatility across different components of price movement, and it can be adapted to different trading styles or market conditions.
Информация о релизе
Description:The "Average Volatility" indicator is designed to provide traders with a comprehensive tool for measuring market volatility through three distinct types of volatility calculations: High to Low, Candle Body, and Candle Shadows. This flexibility allows users to gauge different aspects of price movement and volatility, offering a deeper insight into market trends. Additionally, traders can apply various moving averages (SMA, EMA, SMMA, WMA, and VWMA) to the calculated volatility values, making this tool adaptable to various trading strategies.
Key Features:
Customizable Volatility Types:
The indicator provides three different methods to calculate volatility, allowing traders to choose the one most relevant to their analysis:
High to Low:
Measures the price range between the highest and lowest points within the selected period. This method captures the full extent of volatility within each candle, offering a broad view of price fluctuations.
Candle Body:
Measures the absolute difference between the opening and closing prices of each candle. This focuses purely on the body of the candle, which reflects the net price movement during a trading session, making it useful for identifying stronger trends with minimal noise from wicks.
Candle Shadows (Wicks):
Measures the difference between the high/low prices and the opening/closing prices, capturing the extent of wicks (shadows). This is particularly useful for identifying market reactions (like spikes or price rejections) that don't result in large net price movements.
Flexible Moving Averages:
To smooth the volatility measurements and make trend-following easier, traders can select from five different types of moving averages, each with its own unique characteristics:
SMA (Simple Moving Average): Provides a straightforward average over the selected period.
EMA (Exponential Moving Average): Gives more weight to recent data, making it more responsive to current price changes.
SMMA (RMA) (Smoothed Moving Average): A less reactive average that smooths out short-term fluctuations, ideal for identifying long-term trends.
WMA (Weighted Moving Average): Places more importance on recent periods but less aggressively than the EMA.
VWMA (Volume-Weighted Moving Average): Adjusts the average based on trading volume, making it a more accurate reflection of true market interest during periods of high or low activity.
Customizable Length:
Users can adjust the period length for moving averages, allowing them to fine-tune the sensitivity of the indicator. A shorter period will make the indicator more responsive to recent volatility changes, while a longer period will smooth out short-term noise.
Visualization:
The indicator offers three separate plot lines for easy visualization of each volatility type, each with its own distinct color:
Blue Line: Represents the average volatility from the High to Low price range.
Green Line: Represents the average volatility of the Candle Body.
Red Line: Represents the average volatility of the Candle Shadows (wicks).
How to Use:
Trend Analysis: Traders can use the indicator to identify periods of increased or decreased volatility, which often precede breakouts or trend reversals. For example, rising volatility might signal the beginning of a strong trend, while decreasing volatility may indicate consolidation or exhaustion.
Trade Filtering: By adjusting the type of volatility and the moving average length, traders can filter out market noise and focus on more meaningful price movements.
Strategy Adaptation: The combination of volatility types and customizable moving averages makes this indicator suitable for various trading styles, including scalping, swing trading, and trend-following strategies.
Скрипт с открытым кодом
В истинном духе TradingView автор этого скрипта опубликовал его с открытым исходным кодом, чтобы трейдеры могли понять, как он работает, и проверить на практике. Вы можете воспользоваться им бесплатно, но повторное использование этого кода в публикации регулируется Правилами поведения. Вы можете добавить этот скрипт в избранное и использовать его на графике.
Отказ от ответственности
Все виды контента, которые вы можете увидеть на TradingView, не являются финансовыми, инвестиционными, торговыми или любыми другими рекомендациями. Мы не предоставляем советы по покупке и продаже активов. Подробнее — в Условиях использования TradingView.