OPEN-SOURCE SCRIPT
Yearly Monthly Vertical Lines [MsF]
Обновлено
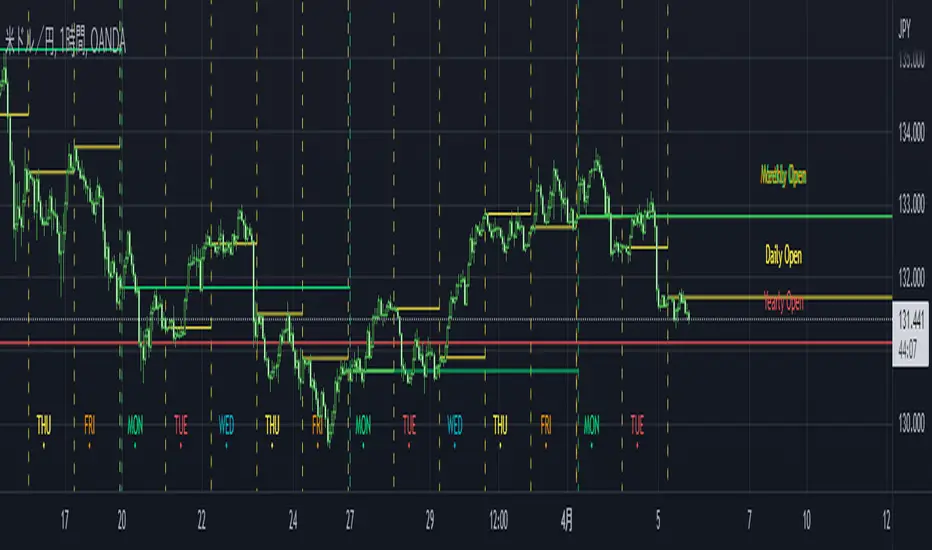
This indicator that draws vertical lines for each year and month starting from the specified date and time.
For example, starting from August 26th, 2022,
The annual vertical lines are Aug 26th, 2022, Aug 26th, 2021, Aug 26th, 2020, Aug 26th, 2019, Aug 26th, 2018, Aug 26th, 2017...
It is useful to check the action of the chart at the event of each year and month.
Caution:
Since there is a limit to the Bar-Count that can be specified in the script language, depending on the chart period setting It may not be displayed.
-------------------------
指定した日時を起点として、年、月ごとに垂直線(縦線)を描画するインジケータです。
例えば、2022/9/1を起点とした場合、
年次のラインは、2021/9/1、2020/9/1、2019/9/1、2018/9/1、2017/9/1、2016/9/1...
に描画します。
年、月ごとのイベント時のチャートの動きを確認するのに便利です。
※過去イベント時の価格変動確認の際、手作業で垂直線を引くのが面倒なため、作成しました。
<注意>
スクリプト言語で指定できるBarCntに制限がある為、チャートの期間設定によっては
表示されない場合があります。※今後改善の余地あり
Информация о релизе
Improved so that weekly and daily lines can also be drawn.Enable "for Crypto" if you want to use it for cryptocurrencies.
It will be possible to draw a vertical line even on holidays.
-----------------------------------------------------------------------------
週ごと、日ごともラインが引けるように改善しました。
なお、暗号通貨に使用する場合は「for Crypto」を有効にしてください。
土日も縦線が引けるようになります。
Информация о релизе
Changed the sample chart to make it easier to understand.--------------------------------------------------------------------------
見本のチャートをわかりやすいものに変更しました。
Информация о релизе
-Improved so that you can select the day of the week when drawing lines for each day of the week.
-Fixed a bug that less drawing lines were drawn.
--------------------------------------------------------------------------------------------------------------------------
・【改善】WEEK指定にて曜日ごとに線を引く際に"曜日"をドロップダウンで選択できるように改善
・【不具合対応】描画線が少なくなる不具合に対応
Информация о релизе
Updated this indicator, Please check below:- Increase number of visible vertical lines
- Show "day of the week" at the bottom if you select "day"
------------------------------------------------------------
インジケータを更新しました。更新内容は以下の通りです。
・【改善】表示可能な縦線の数を増やしました(場合によってはこれ以上増えないかも)
・【改善】「日」を選択すると、チャート下部に「曜日」を表示するようにしました
Информация о релизе
Hide daily vertical lines if for over 4 hours - for clean view------------------------------------------------------------------------------
【改善】可視性向上のため、4時間を超える時間足ではDailyラインを非表示としました
Информация о релизе
Removed Crypto selection. Improved to automatically switch to Crypto.------------------------------------------------------------------------------
【改善】Crypto選択を削除しました。自動で切り替わるように改善しました。
Информация о релизе
Added each open lines Yearly, Monthly, Weekly, and Daily. It's optional. --------------------------------------
年次、月次、週次、日次の各オープンラインを追加しました。オプションです。
Информация о релизе
Bug fixed. The weekly, daily open were not sync with the time.Информация о релизе
Fixed bug about weekly open price lines.Скрипт с открытым кодом
В истинном духе TradingView автор этого скрипта опубликовал его с открытым исходным кодом, чтобы трейдеры могли понять, как он работает, и проверить на практике. Вы можете воспользоваться им бесплатно, но повторное использование этого кода в публикации регулируется Правилами поведения. Вы можете добавить этот скрипт в избранное и использовать его на графике.
Отказ от ответственности
Все виды контента, которые вы можете увидеть на TradingView, не являются финансовыми, инвестиционными, торговыми или любыми другими рекомендациями. Мы не предоставляем советы по покупке и продаже активов. Подробнее — в Условиях использования TradingView.