OPEN-SOURCE SCRIPT
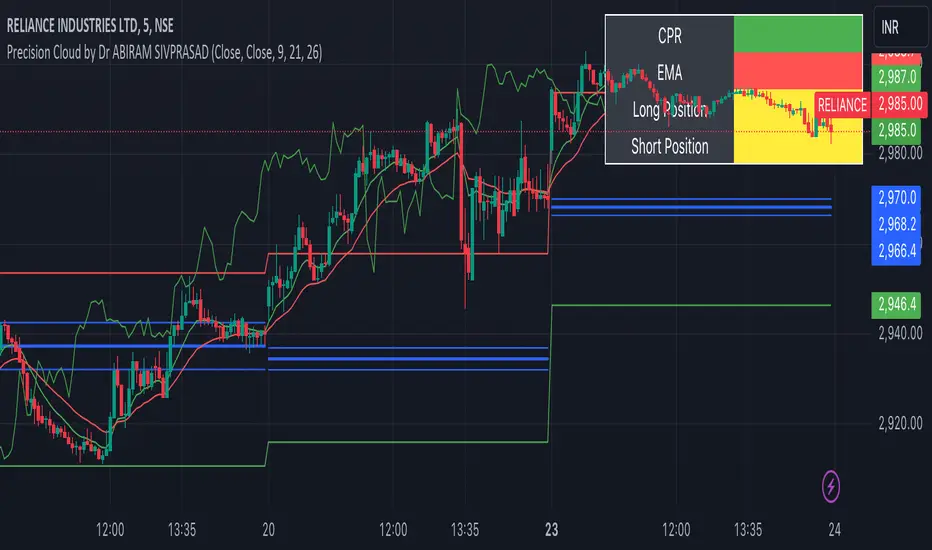
Precision Cloud by Dr ABIRAM SIVPRASAD
Precision Cloud by Dr. Abhiram Sivprasad"
The " Precision Cloud" script, created by Dr. Abhiram Sivprasad, is a multi-purpose technical analysis tool designed for Forex, Bitcoin, Commodities, Stocks, and Options trading. It focuses on identifying key levels of support and resistance, combined with moving averages (EMAs) and central pivot ranges (CPR), to help traders make informed trading decisions. The script also provides a visual "light system" to highlight potential long or short positions, aiding traders in entering trades with a clear strategy.
Key Features of the Script:
Central Pivot Range (CPR):
The CPR is calculated as the average of the high, low, and close of the price, while the top and bottom pivots are derived from it. These act as dynamic support and resistance zones.
The script can plot daily CPR, support, and resistance levels (S1/R1, S2/R2, S3/R3) as well as optional weekly and monthly pivot points.
The CPR helps identify whether the price is in a bullish, bearish, or neutral zone.
Support and Resistance Levels:
Three daily support (S1, S2, S3) and resistance (R1, R2, R3) levels are plotted based on the CPR.
These levels act as potential reversal or breakout points, allowing traders to make decisions around key price points.
EMA (Exponential Moving Averages):
The script includes two customizable EMAs (default periods of 9 and 21). You can choose the source for these EMAs (open, high, low, or close).
The crossovers between EMA1 and EMA2 help identify potential trend reversals or momentum shifts.
Lagging Span:
The Lagging Span is plotted with a customizable displacement (default 26), which helps identify overall trend direction by comparing past price with the current price.
Light System:
A color-coded table provides a visual representation of market conditions:
Green indicates bullish signals (e.g., price above CPR, EMAs aligning positively).
Red indicates bearish signals (e.g., price below CPR, EMAs aligning negatively).
Yellow indicates neutral conditions, where there is no clear trend direction.
The system includes lights for CPR, EMA, Long Position, and Short Position, helping traders quickly assess whether the market is in a buying or selling opportunity.
Trading Strategies Using the Script
1. Forex Trading:
Trend-Following with EMAs: Use the EMA crossovers to capture trending markets in Forex. A green light for the EMA combined with a price above the daily or weekly pivot levels suggests a buying opportunity. Conversely, if the EMA light turns red and price falls below the CPR levels, look for shorting opportunities.
Reversal Strategy: Watch for price action near the daily S1/R1 levels. If price holds above S1 and the EMA is green, this could signal a reversal from support. The same applies to resistance levels.
2. Bitcoin Trading:
Momentum Breakouts: Bitcoin is known for its sharp moves. The script helps to identify breakouts from the CPR range. If the price breaks above the TC (Top Central Pivot) with bullish EMA alignment (green light), it could signal a strong uptrend.
Lagging Span Confirmation: Use the Lagging Span to confirm the trend direction. For Bitcoin's volatility, when the lagging span shows consistent alignment with the price and CPR, it often indicates continuation of the trend.
3. Commodities Trading:
Support/Resistance Bounce: Commodities such as gold and oil often react well to pivot levels. Look for price bouncing off S1 or R1 for potential entry points. A green CPR light along with price above the pivot range supports a bullish bias.
EMA Pullback Strategy: If price moves in a strong trend and pulls back to one of the EMAs, a green EMA light suggests re-entry on a pullback. If the EMA light is red and price breaks below the BC (Bottom Central Pivot), short positions could be considered.
4. Stocks Trading:
Long Position Strategy: For stocks, use the combination of the long position light turning green (price above TC and EMA alignment) as a signal to buy. This could be especially useful for riding bullish trends in growth stocks or during earnings seasons when volatility is high.
Short Position Strategy: If the short position light turns green, indicating price below BC and EMAs turning bearish, this could be an ideal setup for shorting overvalued stocks or during market corrections.
5. Options Trading:
Directional Bias for Options: The light system is particularly helpful for options traders. A green long position light provides a clear signal to buy call options, while a green short position light supports buying puts.
Pivot Breakout Strategy: Buy options (calls or puts) when the price breaks above resistance or below support, with confirmation from the CPR and EMA lights. This helps capture the sharp moves required for profitable options trades.
Conclusion
The S&R Precision Cloud script is a versatile tool for traders across markets, including Forex, Bitcoin, Commodities, Stocks, and Options. It combines critical technical elements like pivot ranges, support and resistance levels, EMAs, and the Lagging Span to provide a clear picture of market conditions. The intuitive light system helps traders quickly assess whether to take a long or short position, making it an excellent tool for both new and experienced traders.
The S&R Precision Cloud by Dr. Abhiram Sivprasad script is a technical analysis tool designed to assist traders in making informed decisions. However, it should not be interpreted as financial or investment advice. The signals generated by the script are based on historical price data and technical indicators, which are inherently subject to market fluctuations and do not guarantee future performance.
Trading in Forex, Bitcoin, Commodities, Stocks, and Options carries a high level of risk and may not be suitable for all investors. You should be aware of the risks involved and be willing to accept them before engaging in such activities. Always conduct your own research and consult with a licensed financial advisor or professional before making any trading decisions.
The creators of this script are not responsible for any financial losses that may occur from its use. Past performance is not indicative of future results, and the use of this script is at your own risk.
Скрипт с открытым кодом
В истинном духе TradingView автор этого скрипта опубликовал его с открытым исходным кодом, чтобы трейдеры могли понять, как он работает, и проверить на практике. Вы можете воспользоваться им бесплатно, но повторное использование этого кода в публикации регулируется Правилами поведения. Вы можете добавить этот скрипт в избранное и использовать его на графике.
Отказ от ответственности
Все виды контента, которые вы можете увидеть на TradingView, не являются финансовыми, инвестиционными, торговыми или любыми другими рекомендациями. Мы не предоставляем советы по покупке и продаже активов. Подробнее — в Условиях использования TradingView.