OPEN-SOURCE SCRIPT
RSI + Kijun/Standard Deviation on RSI
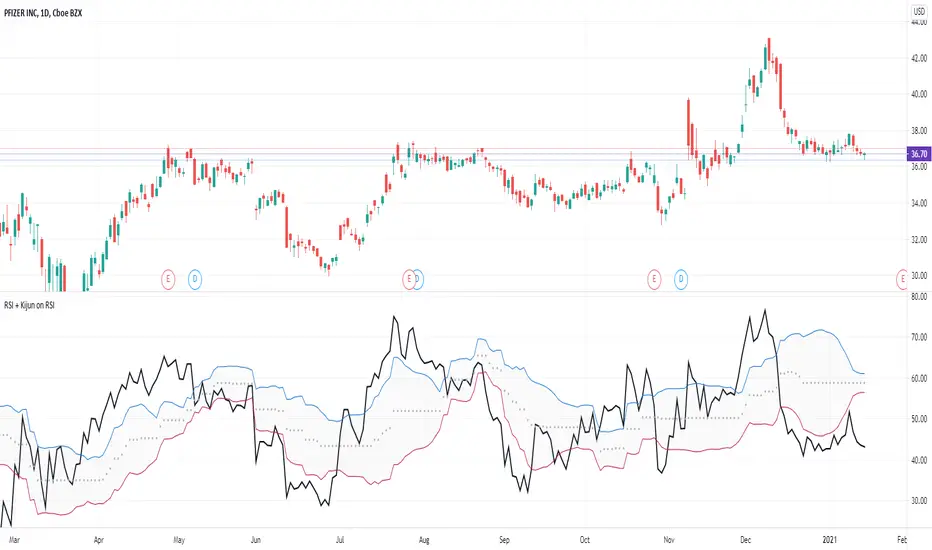
The script is inspired by Bollinger bands but instead of applying them on the price, they are applied on a RSI oscillator. The standard deviation is not plotted against the average like in normal BBs but instead is based on median values (equivalent of a Kijun in Ichimoku ). The goal is to better identify excess in prices that offer good entering points. The usage of a median provides a clearer view of ranging market (ie. the line will be flat).
I use it for long-term investments on stocks to find "fair" entry points. After picking a list of stocks of interest based on fundamentals, I switch to a weekly view. If the stock RSI is under the bands, it indicates that we are in favorable conditions for a buy. For an accurate timing, you can switch to the daily chart and watch out for either a break or a reintegration in the bands. This is your signal.
I use it for long-term investments on stocks to find "fair" entry points. After picking a list of stocks of interest based on fundamentals, I switch to a weekly view. If the stock RSI is under the bands, it indicates that we are in favorable conditions for a buy. For an accurate timing, you can switch to the daily chart and watch out for either a break or a reintegration in the bands. This is your signal.
Скрипт с открытым кодом
В истинном духе TradingView автор этого скрипта опубликовал его с открытым исходным кодом, чтобы трейдеры могли понять, как он работает, и проверить на практике. Вы можете воспользоваться им бесплатно, но повторное использование этого кода в публикации регулируется Правилами поведения. Вы можете добавить этот скрипт в избранное и использовать его на графике.
Отказ от ответственности
Все виды контента, которые вы можете увидеть на TradingView, не являются финансовыми, инвестиционными, торговыми или любыми другими рекомендациями. Мы не предоставляем советы по покупке и продаже активов. Подробнее — в Условиях использования TradingView.