PROTECTED SOURCE SCRIPT
IchiMA Channel
Обновлено
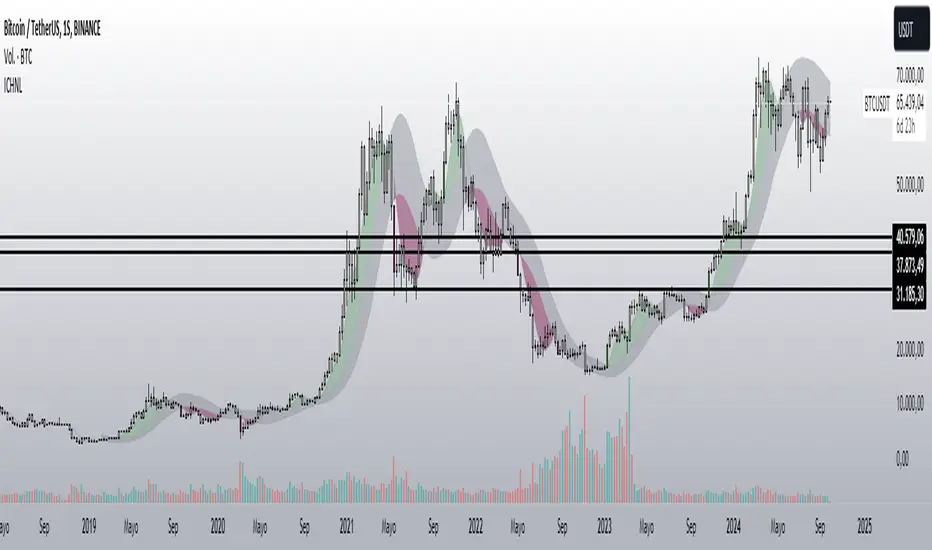
Estrategia basada en un principio de ichimoku, Green Long , Red Short.
Make it simple.
Make it simple.
Информация о релизе
fixed colorИнформация о релизе
Take Profit added. Информация о релизе
Ploted barsИнформация о релизе
fixed colors:-White trending up (long).
-Black trending down (short).
-Lime, possible long.
-Red, possible short.
Информация о релизе
FixedИнформация о релизе
Changes.-Elimination of green/red bar colors
-Added buy/sells signals based on varios indicators and the trending cloud.(Just entries positions)
-Alarms Added
Информация о релизе
FixedИнформация о релизе
Small changesИнформация о релизе
IchiMA Channel - EMA Strategy with Trend HighlightOverview
The IchiMA Channel - EMA Strategy with Trend Highlight (shortened as "ICHNL_EMA_Trend") is a sophisticated trading indicator designed to identify and emphasize prevailing market trends. By integrating Exponential Moving Averages (EMA) with a dynamic channel framework and utilizing Heikin-Ashi candles, this indicator provides traders with clear and actionable insights to enhance their trading strategies.
Key Features
Dynamic EMA Channel: Employs multiple EMAs to construct a responsive channel that adapts to market volatility.
Heikin-Ashi Candle Integration: Utilizes Heikin-Ashi candles to smooth out price action, offering a clearer visualization of the underlying trend.
Trend Highlighting: Highlights only the first candle that signals the beginning of a new bullish or bearish trend, while maintaining all other candles in a neutral white color.
Optimized for Weekly Timeframes: Designed to perform exceptionally well on weekly charts, capturing long-term trends with higher precision.
How It Works
EMA Channel Construction:
The indicator calculates several Exponential Moving Averages (EMAs) to establish a central channel.
Based on these EMAs, upper and lower channel lines are generated, creating a dynamic envelope that adjusts to price movements and market conditions.
Heikin-Ashi Candle Calculation:
Heikin-Ashi candles are manually computed within the same timeframe to reduce market noise and provide a smoothed representation of price action.
These candles help in discerning the true direction of the trend by filtering out minor fluctuations.
Trend Detection and Highlighting:
Bullish Trend Initiation: When conditions indicate the start of a new bullish trend, only the first candle meeting these criteria is highlighted in green.
Bearish Trend Initiation: Conversely, when a new bearish trend is detected, only the first candle that satisfies the bearish conditions is highlighted in maroon.
Neutral Candles: All other candles that do not signify the start of a new trend remain white, ensuring that the chart remains uncluttered and focused on significant trend changes.
Signal Interpretation:
Green Candle: Marks the beginning of a bullish trend, suggesting potential buying opportunities as the price is expected to rise.
Maroon Candle: Indicates the onset of a bearish trend, signaling possible selling opportunities or the need to consider short positions.
White Candles: Represent periods where no new trend initiation is detected, allowing traders to maintain existing positions or await new signals.
Using the Indicator
Timeframe Optimization: For best results, apply the ICHNL_EMA_Trend indicator to weekly charts. This timeframe allows the indicator to effectively capture and highlight significant long-term trends, reducing the impact of short-term market volatility.
Signal Confirmation: While the indicator provides clear signals for trend initiation, it's advisable to use it in conjunction with other technical analysis tools (e.g., volume indicators, support and resistance levels) to confirm signals and enhance trading decisions.
Risk Management: As with any trading strategy, implement robust risk management practices. Set appropriate stop-loss levels and position sizes to protect your capital against unexpected market movements.
Benefits of IchiMA Channel - EMA Strategy with Trend Highlight
Clear Trend Identification: By highlighting only the first candle that begins a new trend, the indicator offers clear and unambiguous signals, simplifying the decision-making process.
Reduced Noise: The combination of EMAs and Heikin-Ashi candles minimizes market noise, allowing traders to focus on genuine trend movements without being distracted by minor price fluctuations.
Enhanced Visibility: The use of distinct colors for trend initiation candles (green for bullish and maroon for bearish) ensures that important signals stand out prominently on the chart.
Versatility: While optimized for weekly timeframes, the indicator can also be applied to other timeframes based on individual trading preferences and strategies.
Conclusion
The IchiMA Channel - EMA Strategy with Trend Highlight is an invaluable tool for traders seeking to identify and capitalize on significant market trends. Its strategic combination of EMAs, Heikin-Ashi candles, and precise trend highlighting offers a streamlined and effective approach to trend analysis. By focusing on the initiation points of new trends, this indicator aids traders in making informed and timely trading decisions, ultimately enhancing their trading performance.
Отказ от ответственности
Все виды контента, которые вы можете увидеть на TradingView, не являются финансовыми, инвестиционными, торговыми или любыми другими рекомендациями. Мы не предоставляем советы по покупке и продаже активов. Подробнее — в Условиях использования TradingView.