OPEN-SOURCE SCRIPT
Highlight Opening Candle with Dynamic Color
Обновлено

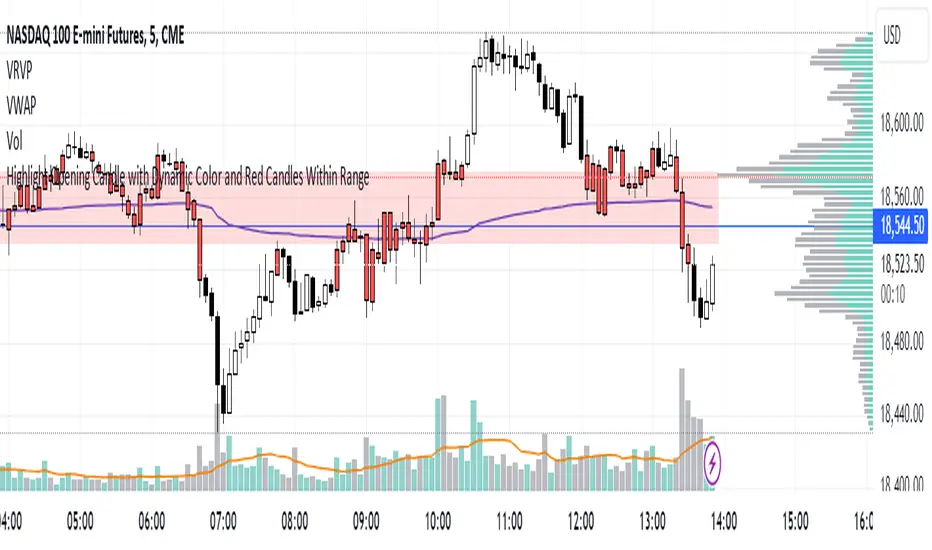
What is this indicator - This indicator is color coded for showing the opening range of the market. Ideally to be used with 5min, 10min or 15mins. Any candles that has its high / low within the opening range - the candle will be highlighted in RED.
How to use this indicator - For beginners, this indicator is useful to determine the trend based on open. If the candle is RED (meaning its still within the opening range) the trend is not clear. Once the a whole candle is open/closed above or below the opening range - the color of the range band indicates the trend. Green range - uptrend, Red range - downtrend. Grey range - price still in the opening range.
How to use this indicator - For beginners, this indicator is useful to determine the trend based on open. If the candle is RED (meaning its still within the opening range) the trend is not clear. Once the a whole candle is open/closed above or below the opening range - the color of the range band indicates the trend. Green range - uptrend, Red range - downtrend. Grey range - price still in the opening range.
Информация о релизе
Update: Added a horizontal line at the 50% level in the opening rangeСкрипт с открытым кодом
В истинном духе TradingView автор этого скрипта опубликовал его с открытым исходным кодом, чтобы трейдеры могли понять, как он работает, и проверить на практике. Вы можете воспользоваться им бесплатно, но повторное использование этого кода в публикации регулируется Правилами поведения. Вы можете добавить этот скрипт в избранное и использовать его на графике.
Хотите использовать этот скрипт на графике?
Отказ от ответственности
Все виды контента, которые вы можете увидеть на TradingView, не являются финансовыми, инвестиционными, торговыми или любыми другими рекомендациями. Мы не предоставляем советы по покупке и продаже активов. Подробнее — в Условиях использования TradingView.