OPEN-SOURCE SCRIPT
BB and Keltner Squeeze
Обновлено
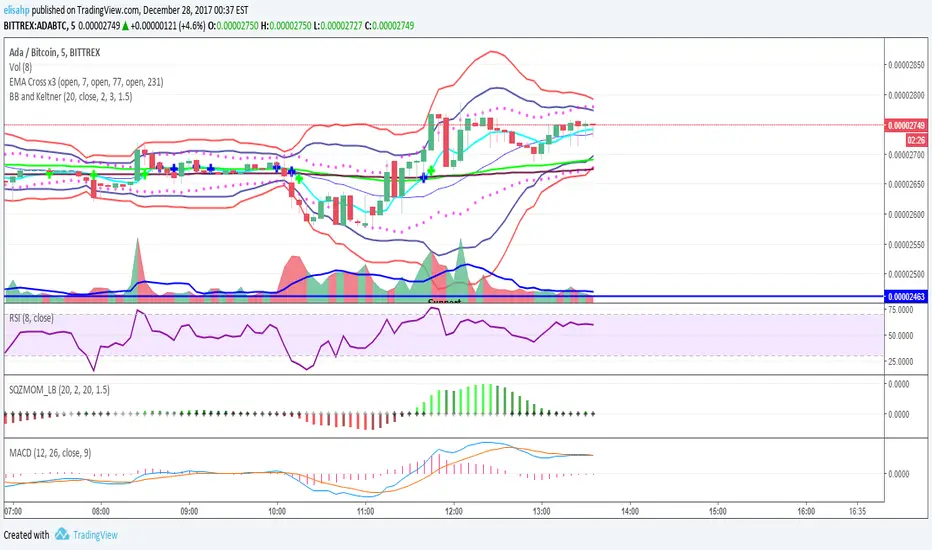
Strategy using the Bollinger band with the Keltner Channels . Watch for the Bollinger bands (blue/red lines) squeezing inside the Keltner Channels (pink dots) for a breakout - this could be up or down so use in conjunction with other indicators.
The blue band is the 2 standard deviation from price, the red is 3 standard deviations. With these, typically if the price bounces off the red then it will retrace a little, (although if there is a massive breakout/down this may not hold). When the bands narrow this is an indicator of consolidation, therefore with a likely upcoming breakup or down.
The pink dots are the Keltner Channels. The strategy says if the bollinger bands come inside the Keltner Channels then this is a strong indicator that the breakout is coming. Sometimes the length of time the squeeze occurs for is indicative of the length/strength of the breakout.
These indicators can be used on all timeframes but higher timeframes will be stronger and more reliable of a trend change.
Информация о релизе
New version - minor change to an incorrect title. No change to function of script.Strategy using the Bollinger band with the Keltner Channels . Watch for the Bollinger bands (blue/red lines) squeezing inside the Keltner Channels (pink dots) for a breakout - this could be up or down so use in conjunction with other indicators.
The blue band is the 2 standard deviation from price, the red is 3 standard deviations. With these, typically if the price bounces off the red then it will retrace a little, (although if there is a massive breakout/down this may not hold). When the bands narrow this is an indicator of consolidation, therefore with a likely upcoming breakup or down.
The pink dots are the Keltner Channels . The strategy says if the bollinger bands come inside the Keltner Channels then this is a strong indicator that the breakout is coming. Sometimes the length of time the squeeze occurs for is indicative of the length/strength of the breakout.
These indicators can be used on all timeframes but higher timeframes will be stronger and more reliable of a trend change.
Информация о релизе
Just cleaning up the chart so it can be seen better!Скрипт с открытым кодом
В истинном духе TradingView автор этого скрипта опубликовал его с открытым исходным кодом, чтобы трейдеры могли понять, как он работает, и проверить на практике. Вы можете воспользоваться им бесплатно, но повторное использование этого кода в публикации регулируется Правилами поведения. Вы можете добавить этот скрипт в избранное и использовать его на графике.
Come say hi @elisa_crypto on twitter!
Отказ от ответственности
Все виды контента, которые вы можете увидеть на TradingView, не являются финансовыми, инвестиционными, торговыми или любыми другими рекомендациями. Мы не предоставляем советы по покупке и продаже активов. Подробнее — в Условиях использования TradingView.