OPEN-SOURCE SCRIPT
Magic Linear Regression Channel [MW]
Обновлено
Introduction
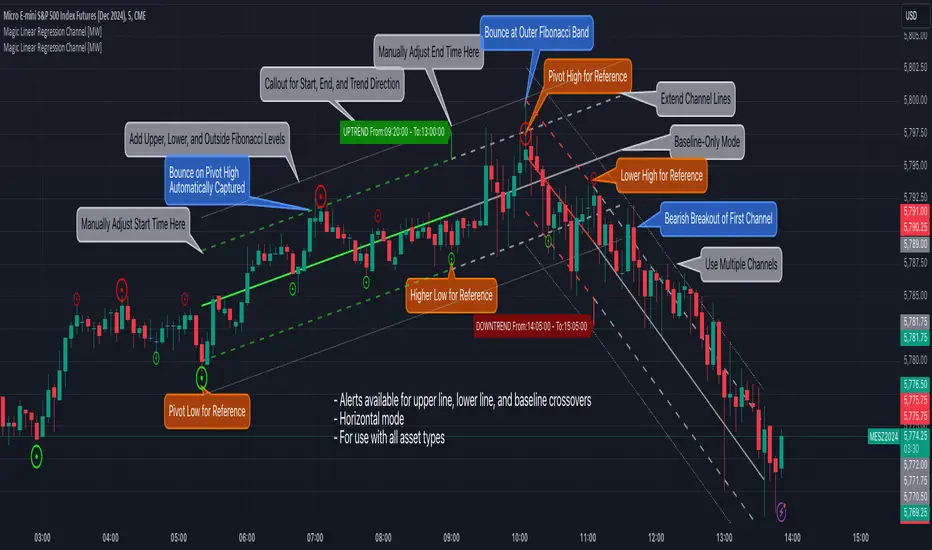
The Magic Linear Regression Channel [MW] indicator provides users with a way to quickly include a linear regression channel ANYWHERE on their chart, in order to find channel breakouts and bounces within any time period. It uses a novel method that allows users to adjust the start and end period of the regression channel in order to quickly make adjustments faster, with fewer steps, and with more precision than with any other linear regression channel tool. It includes Fibonacci bands AND a horizontal mode in order for users to quickly define significant price levels based on the high, low, open, and close prices defined by the start period.
Settings
Calculations
This indicator uses the least squares approach for generating a straight regression line, which can be reviewed at Wikipedia’s “Simple Linear Regression” page. It sums all of the x-values, and y-values, as well as the sum of the product of corresponding x and y values, and the sum of the squares of the x-values. These values are used to calculate the slope and intercept using the following equations:
And
The slope and intercept are then used to generate the baseline and the corresponding bands using the user-selected offsets.
How to Use
When the Magic Linear Regression Channel [MW] indicator is first added to the chart, there will be a blue prompt behind the “Indicators, Metrics & Strategies” window. Close the window, then select a START POINT by clicking at a desired location on the chart. Next, you will be prompted to select an END POINT. The end point MUST be placed after the START POINT. At this time a channel will be generated. Once you’ve selected the START POINT and END POINT, you can adjust them by dragging them anywhere on the chart. Each adjustment will generate a new channel making it easier for you to quickly visualize and recognize any channel exits and bounces.
The Magic Linear Regression Channel [MW] indicator works great at identifying wave patterns. Place the start line at a top or bottom pivot point. Place the end line at the next respective top or bottom pivot. This will give you a complete wave form to work with. When price reaches a band and rejects, it can be a strong indication that price may move back to one of the bands in the channel. If price exits the channel with volume that supports the exit, it may be an indication of a breakout.
You can also use the horizontal mode to identify key levels, then add Fibonacci bands based on regression calculations for the given time period to provide more meaningful areas of support and resistance.
Other Usage Notes and Limitations
Occasionally, off-by-1 errors appear which makes the extended lines protrude at a slightly incorrect angle. This is a known bug and will be addressed in the next release.
It's important for traders to be aware of the limitations of any indicator and to use them as part of a broader, well-rounded trading strategy that includes risk management, fundamental analysis, and other tools that can help with reducing false signals, determining trend direction, and providing additional confirmation for a trade decision. Diversifying strategies and not relying solely on one type of indicator or analysis can help mitigate some of these risks.
The Magic Linear Regression Channel [MW] indicator provides users with a way to quickly include a linear regression channel ANYWHERE on their chart, in order to find channel breakouts and bounces within any time period. It uses a novel method that allows users to adjust the start and end period of the regression channel in order to quickly make adjustments faster, with fewer steps, and with more precision than with any other linear regression channel tool. It includes Fibonacci bands AND a horizontal mode in order for users to quickly define significant price levels based on the high, low, open, and close prices defined by the start period.
Settings
- Start Time: This is initially MANUALLY SELECTED ON THE CHART when the indicator is first loaded.
- End time: This is also initially MANUALLY SELECTED ON THE CHART when the indicator is first loaded.
- Horizontal Line: This forces the baseline to be horizontal. The band distance is defined by the maximum price distance from the band.
- Horizontal Line Type: This snaps the horizontal line to the close, high, low, or open price. Or, it can also use a regression calculation for the selected time period to define the y-position of the line.
- Extend Line N Bars: How many bars to the left in which to extend the baseline and bands.
- Show Baseline ONLY!!: Removes all lines except the baseline and it’s extension.
- Add Half Band: Includes a band that is half the distance between the baseline and the top and bottom bands
- Add Outer Fibonacci Band: Includes a band that is 1.618 (phi) times the default band distance
- Add Inner Fibonacci Band - Upper: Includes a band that is 0.618 (1/phi) times the default band distance
- Add Inner Fibonacci Band - Lower: Includes a band that is 0.382 (1 - 1/phi) times the default band distance
Calculations
This indicator uses the least squares approach for generating a straight regression line, which can be reviewed at Wikipedia’s “Simple Linear Regression” page. It sums all of the x-values, and y-values, as well as the sum of the product of corresponding x and y values, and the sum of the squares of the x-values. These values are used to calculate the slope and intercept using the following equations:
And
The slope and intercept are then used to generate the baseline and the corresponding bands using the user-selected offsets.
How to Use
When the Magic Linear Regression Channel [MW] indicator is first added to the chart, there will be a blue prompt behind the “Indicators, Metrics & Strategies” window. Close the window, then select a START POINT by clicking at a desired location on the chart. Next, you will be prompted to select an END POINT. The end point MUST be placed after the START POINT. At this time a channel will be generated. Once you’ve selected the START POINT and END POINT, you can adjust them by dragging them anywhere on the chart. Each adjustment will generate a new channel making it easier for you to quickly visualize and recognize any channel exits and bounces.
The Magic Linear Regression Channel [MW] indicator works great at identifying wave patterns. Place the start line at a top or bottom pivot point. Place the end line at the next respective top or bottom pivot. This will give you a complete wave form to work with. When price reaches a band and rejects, it can be a strong indication that price may move back to one of the bands in the channel. If price exits the channel with volume that supports the exit, it may be an indication of a breakout.
You can also use the horizontal mode to identify key levels, then add Fibonacci bands based on regression calculations for the given time period to provide more meaningful areas of support and resistance.
Other Usage Notes and Limitations
Occasionally, off-by-1 errors appear which makes the extended lines protrude at a slightly incorrect angle. This is a known bug and will be addressed in the next release.
It's important for traders to be aware of the limitations of any indicator and to use them as part of a broader, well-rounded trading strategy that includes risk management, fundamental analysis, and other tools that can help with reducing false signals, determining trend direction, and providing additional confirmation for a trade decision. Diversifying strategies and not relying solely on one type of indicator or analysis can help mitigate some of these risks.
Информация о релизе
v1.01 - Reduced issue with "Pine cannot determine reference length of a series" error by increasing max_bars_back to 5000 from 1000
Информация о релизе
v1.1- Added pivot levels for use in placing the start and end of the regression line
- Changed the alerts so that they only show the root ticker symbol
- Changed Extended Lines to be on by default
Usage Notes:
Chart patterns like double tops, double bottoms, head and shoulders, inverse head and shoulders, etc. can all be shown to occur within a straight linear regression channel. When the channel is breached, it signifies a change of character in the chart pattern. The old pattern no longer holds, and a new pattern is formed. In many cases, a channel break can act as an opportunity for a 2:1, 3:1, or higher reward to risk ratio trade, because in most cases, once the channel is exited, price can typically continue in the new direction for at least a few bars. This is where the Magic Linear Regression Channel [MW] begins.
Place the start of the regression channel at the last major pivot (the big circle and dot) and the end of the channel at the first higher low or lower high (the small circle and dot).
Turn on the “Use Extended Line” feature and enter a value for “Extend Line N Bars” that makes sense for your time frame. This extended line will determine your entry.
Mark the crossover price for the first candle that closes outside of the channel formed by the extended lines.
To enter a trade, either
- Place a limit order at the crossover price of the first candle that closes outside of the channel, or
- Enter into a trade at the close of the candle that closed outside of the channel.
In case 1, place a stop order at the high of the previous candle when exiting an upward channel, or at the low of the previous candle when exiting a downward channel and use 1:3 risk:reward ratio.
In case 2, place a stop order just above the crossover price when exiting an upward channel, or at just below the crossover price when exiting a downward channel and use a 1:2 risk:reward ratio.
Occasionally, a breakout will occur, but price will follow the OUTSIDE of the band. In this case, the outer Fibonacci band is usually being followed. The breakout rules can then be used for this band.
Additionally, in some cases, the outer Fibonacci band will form the working channel and should be considered when defining your entry and exit positions.
For best results, use this indicator in conjunction with Magic Order Blocks [MW] to understand where your nearest support and resistance levels might be in order to determine your trade exit levels.
Информация о релизе
v1.11- Added max_boxes_count=500 to allow for more pivot signals
Скрипт с открытым кодом
В истинном духе TradingView автор этого скрипта опубликовал его с открытым исходным кодом, чтобы трейдеры могли понять, как он работает, и проверить на практике. Вы можете воспользоваться им бесплатно, но повторное использование этого кода в публикации регулируется Правилами поведения. Вы можете добавить этот скрипт в избранное и использовать его на графике.
Отказ от ответственности
Все виды контента, которые вы можете увидеть на TradingView, не являются финансовыми, инвестиционными, торговыми или любыми другими рекомендациями. Мы не предоставляем советы по покупке и продаже активов. Подробнее — в Условиях использования TradingView.