OPEN-SOURCE SCRIPT
34 EMA Bands
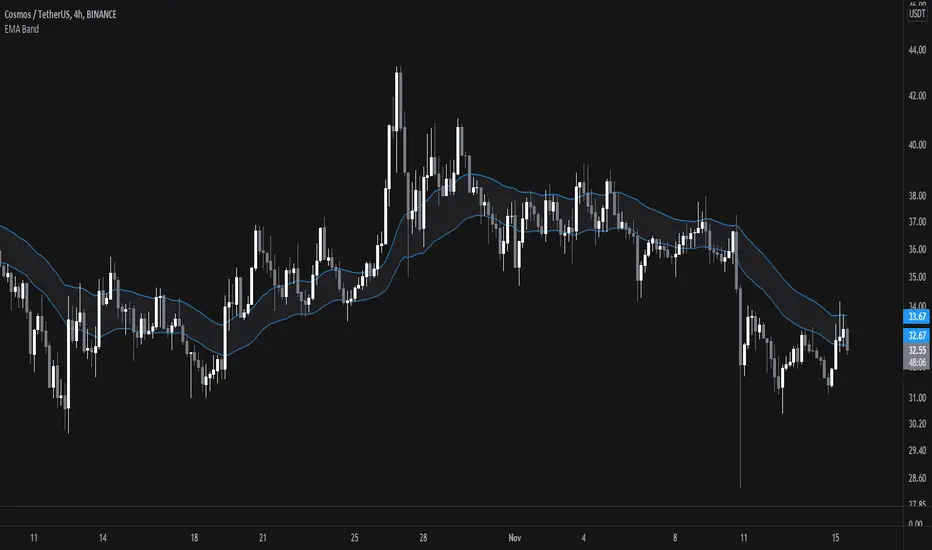
This is quite a simple script, just plotting a 34EMA on high's and low's of candles. Appears to work wonders though, so here it is.
There is some //'d code which I haven't finished working on, but it looks to be quite similar to Bollinger Bands, just using different math rather than standard deviations from the mean.
The bands itself is pretty self explanatory, price likes to use it as resistance when under it, it can trade inside it and it can use the upper EMA as support when in a strong upward trend.
Скрипт с открытым кодом
В истинном духе TradingView автор этого скрипта опубликовал его с открытым исходным кодом, чтобы трейдеры могли понять, как он работает, и проверить на практике. Вы можете воспользоваться им бесплатно, но повторное использование этого кода в публикации регулируется Правилами поведения. Вы можете добавить этот скрипт в избранное и использовать его на графике.
Отказ от ответственности
Все виды контента, которые вы можете увидеть на TradingView, не являются финансовыми, инвестиционными, торговыми или любыми другими рекомендациями. Мы не предоставляем советы по покупке и продаже активов. Подробнее — в Условиях использования TradingView.