OPEN-SOURCE SCRIPT
Visual RSI {bebaps}
Обновлено
Visual RSI
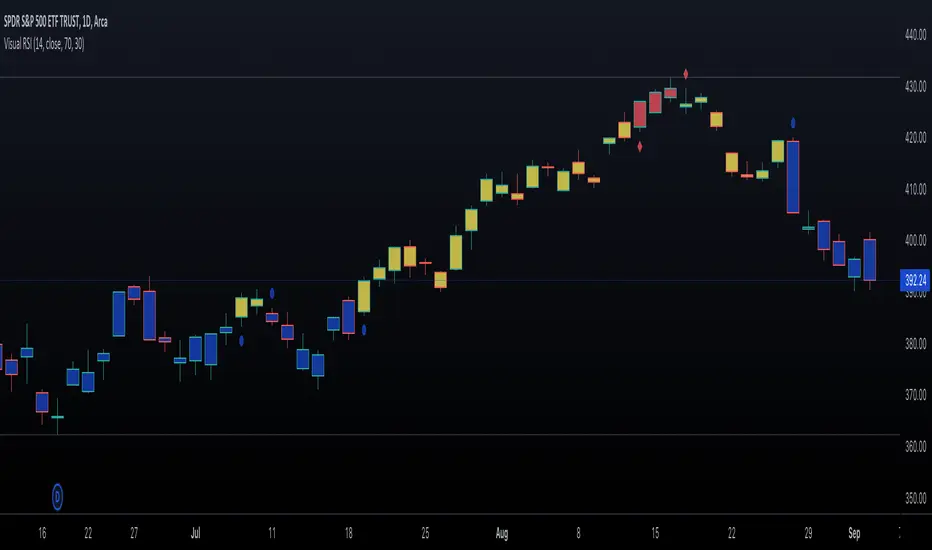
This script provides a visual way to view RSI data. Sometimes it may be useful to view RSI data on the price chart instead of in a separate pane. This script enables the following configurable options:
All options are configurable. This is not meant to serve as a replacement for having the RSI on your chart, but it will make it easier to highlight key data points in real time.
This script provides a visual way to view RSI data. Sometimes it may be useful to view RSI data on the price chart instead of in a separate pane. This script enables the following configurable options:
- Plot shapes on the chart during key RSI events such as: crossing above or below the overbought or oversold level
- Color bars based upon the current value of the RSI, such as: RSI currently oversold, or RSI currently between overbought and 50
All options are configurable. This is not meant to serve as a replacement for having the RSI on your chart, but it will make it easier to highlight key data points in real time.
Информация о релизе
Adjusted the size of the plotted shapes to be more visually appealing on the chart.Информация о релизе
- Increase color consistency
- Add notes for which chart styles work best
Скрипт с открытым кодом
В истинном духе TradingView автор этого скрипта опубликовал его с открытым исходным кодом, чтобы трейдеры могли понять, как он работает, и проверить на практике. Вы можете воспользоваться им бесплатно, но повторное использование этого кода в публикации регулируется Правилами поведения. Вы можете добавить этот скрипт в избранное и использовать его на графике.
Отказ от ответственности
Все виды контента, которые вы можете увидеть на TradingView, не являются финансовыми, инвестиционными, торговыми или любыми другими рекомендациями. Мы не предоставляем советы по покупке и продаже активов. Подробнее — в Условиях использования TradingView.