PROTECTED SOURCE SCRIPT
RSI-Trend Formation
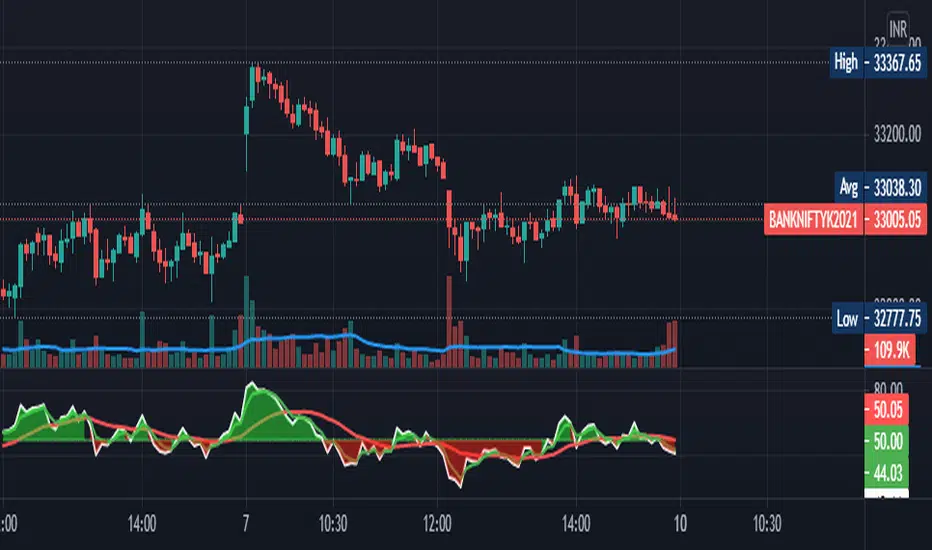
RSI Trend Formation uses RSI (9) along with 3 EMA and 21 WMA . 3 EMA and 21 WMA graphs have been plotted on RSI (9). RSI value above 50 will be considered as 'BUY' zone and RSI value below 50 will be considered as 'SELL' zone.
When 21 WMA ( Volume Strength) and 3 EMA (Price Strength) crosses RSI from above (that means both of these will go below RSI ), it is a Buy signal.
When 21 WMA ( Volume Strength) and 3 EMA (Price Strength) crosses RSI from below (that means both of these will go above RSI ), it is a Sell signal.
This is the best time of 3/5/15 min Time Frame for Intraday Traders..
Отказ от ответственности
Все виды контента, которые вы можете увидеть на TradingView, не являются финансовыми, инвестиционными, торговыми или любыми другими рекомендациями. Мы не предоставляем советы по покупке и продаже активов. Подробнее — в Условиях использования TradingView.