PROTECTED SOURCE SCRIPT
SB Average Gain/Loss Oscillator
Обновлено
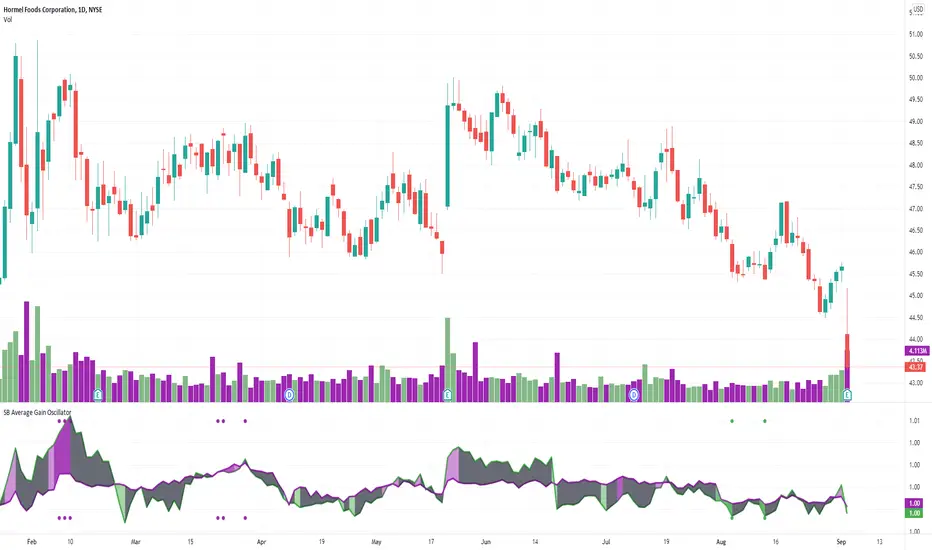
I created an algorithm to analyze overbought/oversold levels through the use of average gain/loss.
This method of measurement is utilizing the 20 period and 50 period moving averages.
Light Green: 20 Period Oversold
Dark Green: 50 Period Oversold
Green Dot: 20 and 50 Period Oversold
Light Red: 20 Period Overbought
Dark Red: 50 Period Overbought
Red Dot: 20 and 50 Period Overbought
Places of overlap green/red would be considered indecision and/or volatility in both directions.
I would consider this more of an sentiment indicator, bullish/bearish. The reason for this classification is that its only using price action. No real technical indicators other than period gain/loss).
Информация о релизе
I updated the chart so that I am now in compliance with the rules and guidelines of the community.Информация о релизе
Changed the line colors from black to green/red.Green line is the 20 moving average of the average gain/loss oscillator
Red line is the 50 moving average of the average gain/loss oscillator
I also added MTF settings so the user could change the time frame of the indicator.
Информация о релизе
Updated color scheme to match a few of my other indicators.Информация о релизе
Removed indicators from the chart to abide by TV rules.Информация о релизе
Changed background colorsОтказ от ответственности
Все виды контента, которые вы можете увидеть на TradingView, не являются финансовыми, инвестиционными, торговыми или любыми другими рекомендациями. Мы не предоставляем советы по покупке и продаже активов. Подробнее — в Условиях использования TradingView.