OPEN-SOURCE SCRIPT
SweetSweetLucia: OnceADay
Обновлено
A Typical Price Drummond Line, with a Floor Pivot Open Signal Line.
Thanks.
- The Three Day Average, is not offset.
The crossing is significant in many strategies.
The circle is an intraday crossing.
The crosses are the signal openings.
Caution: divergence can cause a false positive.
This strategy is for Daily Bars Only!
Thanks.
Информация о релизе
The Drummond is now offset one day, and the circles are now squares.Информация о релизе
Now in a window, instead of a overlay.Информация о релизе
Full Window with 'Fractal Wave' concepts...check this one out!Информация о релизе
Update Graphics! Информация о релизе
Fixed spelling errors.Информация о релизе
Update 'Offset" Bug!Информация о релизе
Format Update....Информация о релизе
Updated:- 3 Bar Typical Price (Offset 1 Bar)
- 1 Bar Open Price
- Crosses are Opening Crossings of Typical Price
- Squares are Intraday Close over Typical Price
- Line Graph is Close, with colors
- Short, Medium, and Large Fractal Wave Moving Averages
- Format is Price Action
Thanks
Информация о релизе
Updated:- 3 Bar Typical Price (Offset 2 Bar)
- 1 Bar Open Price
- Crosses are Opening Crossings of Typical Price
- Squares are Intraday Close over Typical Price
- Line Graph is Close, with colors
- Short, Medium, and Large Fractal Wave Moving Averages
- Format is Price Action
Thanks
Информация о релизе
Updated:- 3 Bar Typical Price (Offset 1 Bar)
- 1 Bar Open Price
- Crosses are Opening Crossings of Typical Price
- Squares are Intraday Close over Typical Price
- Line Graph is Close, with colors
- Short, Medium, and Large Fractal Wave Moving Averages
- Format is Price Action
Thanks
Информация о релизе
**The Update**Has weight, smoothing, and transform.
The signals are more accurate.
The setting shouldn't be changed.
Trade it like a "Drummond Line," with opening psychology and closing violations.
If the indicator shows bullish psychology but the price returns to the range, close the trade;
it would demonstrate bar over bar divergence.
I wouldn't release this version but my previous version was faulty.
This 3.0 edition is years of research in the making.
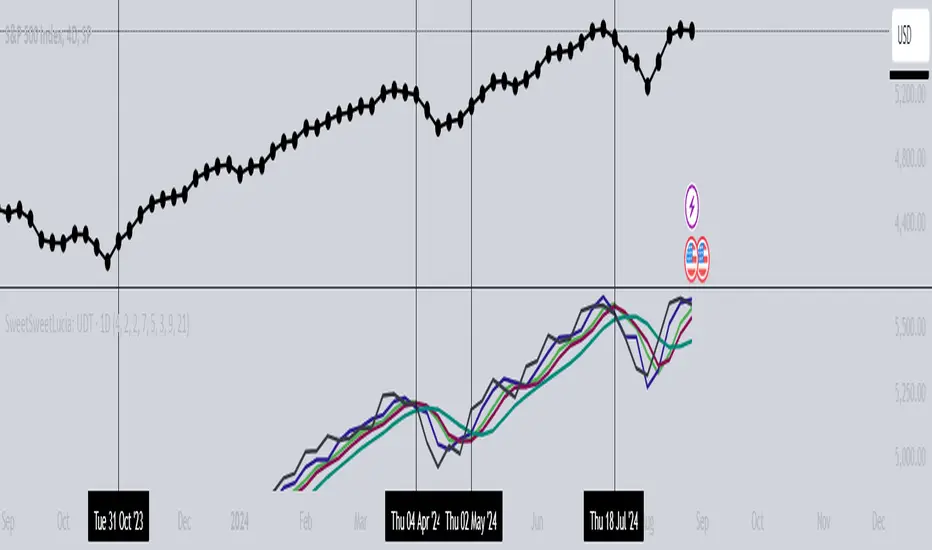
Cross Symbols: Opening Sentiment Signals (Bullish or Bearish).
Square Symbols: Pivot Crossings (Support or Resistance).
Trendline: Instantaneous Trendline (21 Bars Transform).
Typical Priceline: Drummond or Pivot (Transform).
Opening-line: Psychological Sentiment (Transform).
Thanks,
privatepizza111
Информация о релизе
*******Информация о релизе
ThanksИнформация о релизе
For Crypto: Change the Precision in the gui menuИнформация о релизе
**Offset Update**Информация о релизе
**TRANSFORM UPDATE**Информация о релизе
**Graphics Update**Информация о релизе
**Graphics Update**Информация о релизе
**Settings Update**Информация о релизе
**Added Line Chart**Информация о релизе
**Offset Update**Информация о релизе
**Syntax Update****New Trendline Crossings**
Информация о релизе
**Update**Imaginary crossover and crossunder...(reversed)
Информация о релизе
**Crossing UpdatesИнформация о релизе
**Exponential Streams****User Friendly Color Changes**
**Notice the closing price line averages above or below the opening averages**
Информация о релизе
** Final Version with last GUI update**Информация о релизе
"Drummond" UpdateИнформация о релизе
Remove DuplicatesИнформация о релизе
// a psychological sentiment indicator// Digital Signal Processing
// For Crypto: Change the Precision in the gui menu
//a new update with methods, extracted calls, and requested securities...I would confirm barstates but the menu would become too clustered.
//this method of s-poles and z-poles lags through the s-poles but it is valid...I altered the technique to this application,
//for a psychological indicator...the original MA filters in found in Rocket Science by Ehlers.
Информация о релизе
fix typo releaseИнформация о релизе
a new update with methods, extracted calls, confirm barstates (else all unconfirmed is blue color), and requested securities.//this method of s-poles and z-poles lags through the s-poles but it is valid...I altered the technique to this application,
//for a psychological indicator...the original MA filters theory (not code) is found in Rocket Science by Ehlers.
Информация о релизе
color glitch update...and type updatesИнформация о релизе
request security updateИнформация о релизе
whitespace updateИнформация о релизе
*more extracted calls*Информация о релизе
Crossing bug update and typo update.Информация о релизе
Whitespace update and colors update...plus forced indexes update.Информация о релизе
Updated "color blue" and added nz types.Информация о релизе
update data paneИнформация о релизе
Newer: with tuples, labels, more inputs, new alias for concepts, priceline average, and so on.Информация о релизе
//15 April 2024//updated indicator with udt, udt maps, and the ram pointers of udt objects.
//inputs remained unchange because of series int and the simple int required from user inputs for the lengths.
//the methods were moved into the udt maps, functions and all.
//the request sources are in a map...'maps are the future'
//the symbols are displayed with labels for 'plot' not plot to plot them, labels save ram...labels are considered better,
//the changes are new:
// a psychological sentiment indicator
// Digital Signal Processing
// For Crypto: Change the Precision in the gui menu
Информация о релизе
//pulled the sources out of the map...the map had index errors.Информация о релизе
label position updateИнформация о релизе
crypto labels work with decimals now.Информация о релизе
Removed the shapes/labels...they were confusing.Added the line graph...also removed an unused variable.
Added multiple timeframes.
The quantizer remains unrounded for decimal values, $0.55 is rounded to $1.00 but $0.45 rounds to $0.00 and that is no good.
Информация о релизе
Removed the shapes/labels...they were confusing.Added the line graph...also removed an unused variable.
Added multiple timeframes.
The quantizer remains unrounded for decimal values, $0.55 is rounded to $1.00 but $0.45 rounds to $0.00 and that is no good.
Информация о релизе
Removed the shapes/labels...they were confusing.Added the line graph...also removed an unused variable.
Added multiple timeframes.
The quantizer remains unrounded for decimal values, $0.55 is rounded to $1.00 but $0.45 rounds to $0.00 and that is no good.
Скрипт с открытым кодом
В истинном духе TradingView автор этого скрипта опубликовал его с открытым исходным кодом, чтобы трейдеры могли понять, как он работает, и проверить на практике. Вы можете воспользоваться им бесплатно, но повторное использование этого кода в публикации регулируется Правилами поведения. Вы можете добавить этот скрипт в избранное и использовать его на графике.
Отказ от ответственности
Все виды контента, которые вы можете увидеть на TradingView, не являются финансовыми, инвестиционными, торговыми или любыми другими рекомендациями. Мы не предоставляем советы по покупке и продаже активов. Подробнее — в Условиях использования TradingView.