OPEN-SOURCE SCRIPT
ATR Drift %
Обновлено
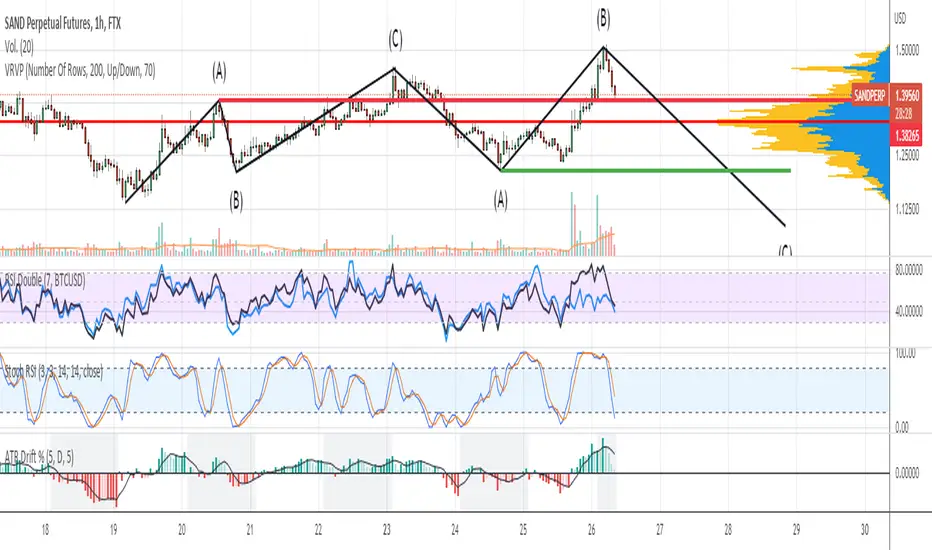
This script plots an histogram calculated this way:
Get the previous ATR sample, calculated in the specified timeframe
Get the actual open price of the bar in the specified timeframe minus the actual price in the current timeframe
and plots the percent change between the the 2 values
For example, if you select DAY as timeframe for the ATR:
Plots the percent change between:
- ATR(daily) from yesterday
and
- open from today - actual price
Due to Tradingview limitations, only shows the plot if the actual timeframe of the graphic is equal or lower that the ATR selected timeframe
The background changes shows a new ATR sample taking place
I'm testing this for scalping in 5M timeframe with the ATR in 4H
All my published scripts at: es.tradingview.com/u/Nakitxu/
Информация о релизе
Changed the background change logicИнформация о релизе
Added SMA smoothСкрипт с открытым кодом
В истинном духе TradingView автор этого скрипта опубликовал его с открытым исходным кодом, чтобы трейдеры могли понять, как он работает, и проверить на практике. Вы можете воспользоваться им бесплатно, но повторное использование этого кода в публикации регулируется Правилами поведения. Вы можете добавить этот скрипт в избранное и использовать его на графике.
Hodl!
Отказ от ответственности
Все виды контента, которые вы можете увидеть на TradingView, не являются финансовыми, инвестиционными, торговыми или любыми другими рекомендациями. Мы не предоставляем советы по покупке и продаже активов. Подробнее — в Условиях использования TradingView.