OPEN-SOURCE SCRIPT
Correlation Coefficient Table
Обновлено

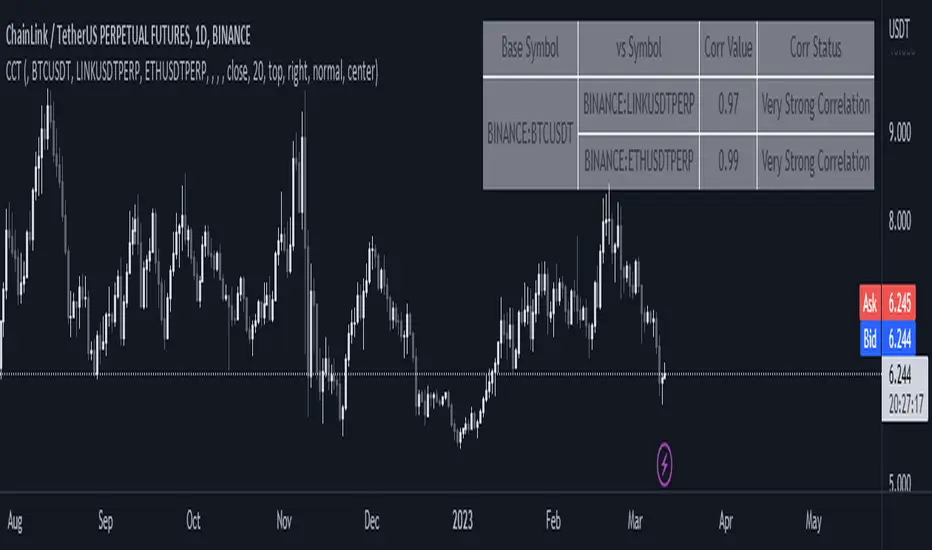
This is a sample PineSript code implementation using Correlation Coefficient. It uses the ta.correlation library of Pinescript and calculates the correlation based on user input length. The results are then plotted on a table. The corr value displays the actual correlation coefficient value while the Corr Status displays the interpretation of the correlation coefficient values.
The script takes the following input

The Correlation Status column was based on this Interpretation:

For more information, read this article https://www.tradingview.com/scripts/correlationcoefficient/?solution=43000502022
The script takes the following input
- Source Symbol - This is the base symbol which will be used in calculating correlation coefficient. In my case, since i am looking more often on crypto. I defaulted it to BTCUSDT
- Symbol 1 - Symbol 5 - These are the coins that will be compared to our base symbol for correlation.
- Source - You can select on which price source you want to be calculated. By default this is set to candle close price.
- Length - The number of price bar to look back and retrieve correlation coefficient. Set to 20 bars by default.
- Table Settings - Since the correlation coefficient are displayed on a table. An option to customize the table settings are presented.
The Correlation Status column was based on this Interpretation:
For more information, read this article https://www.tradingview.com/scripts/correlationcoefficient/?solution=43000502022
Информация о релизе
- Removed the plot function of the actual correlation coefficient value as it only adds noise to chart.
Скрипт с открытым кодом
В истинном духе TradingView автор этого скрипта опубликовал его с открытым исходным кодом, чтобы трейдеры могли понять, как он работает, и проверить на практике. Вы можете воспользоваться им бесплатно, но повторное использование этого кода в публикации регулируется Правилами поведения. Вы можете добавить этот скрипт в избранное и использовать его на графике.
Отказ от ответственности
Все виды контента, которые вы можете увидеть на TradingView, не являются финансовыми, инвестиционными, торговыми или любыми другими рекомендациями. Мы не предоставляем советы по покупке и продаже активов. Подробнее — в Условиях использования TradingView.