PROTECTED SOURCE SCRIPT
COT INDEXING | COMMERCIALS [DIGGERDOG]
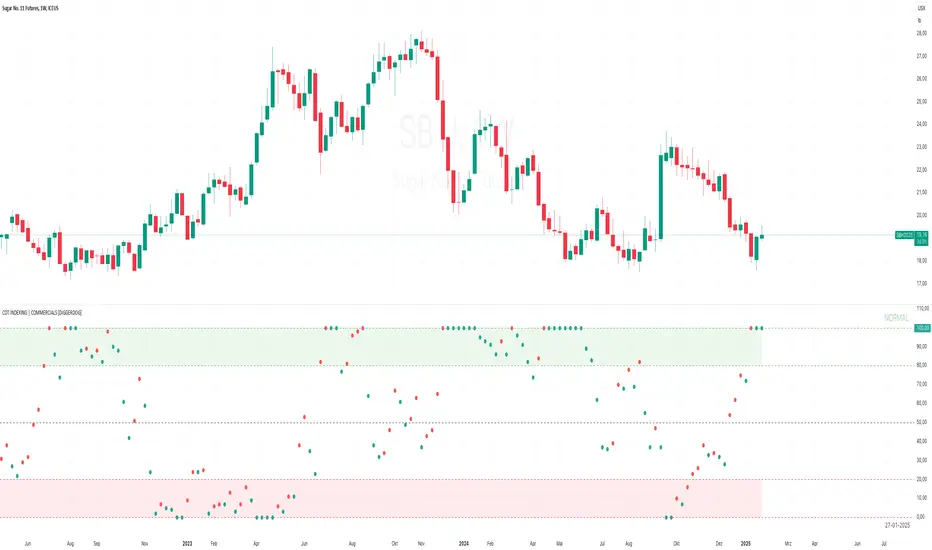
This Pine Script for TradingView, titled **"COT INDEXING | COMMERCIALS"**, is designed to index the net positions of **commercial**, **non-commercial**, and **non-reportable** participants based on the **Commitment of Traders (COT) report**. The script displays the net positions, calculates an index of commercial net positions over a user-defined timeframe, and marks extreme values with background colors.
Key Features:
1. **COT Data Retrieval:**
- The script fetches **commercial**, **non-commercial**, and **non-reportable** positions from the **Legacy COT Report**.
- It retrieves both **long** and **short** positions for each type of participant, and calculates the **net positions** for these groups.
- Users can manually input the **CFTC Code** or use an automated COT code selection mode based on their selected asset.
2. **Index Calculation:**
- The script calculates the **COT Index** for commercial net positions over a user-defined timeframe (default is 26 periods).
- The index is calculated as a percentage of the net position’s range over the given timeframe.
3. **Plotting COT Index:**
- The COT Index is plotted as a line, with customizable colors depending on whether the index is growing or falling.
- **Red** and **green** colors are used to visually indicate overbought or oversold conditions.
4. **Threshold Marking:**
- The script allows users to mark **extreme values** of the COT Index with background colors:
- **Green background** indicates the index is above a user-defined **high threshold** (default is 80).
- **Red background** indicates the index is below a user-defined **low threshold** (default is 20).
- Values outside the normal range (below 0 or above 100) are marked with a **white background**.
5. **Dashboard for Last COT Update:**
- The script displays the date of the last available COT data in a small table in the bottom-right corner of the chart.
- This helps users stay informed about the most recent COT data used in the analysis.
6. **Customizable Inputs:**
- **Timeframe**: Users can adjust the timeframe for the COT Index calculation.
- **Thresholds**: Users can set the **high** and **low** thresholds for marking extreme values.
- **Color settings**: Colors for the plotted COT Index and background marking can be customized.
How It Works:
1. **COT Data Processing**:
- Long and short positions for commercial, non-commercial, and non-reportable market participants are fetched from the COT report.
- The script then calculates the **net positions** by subtracting short positions from long positions.
2. **COT Index Calculation**:
- For the commercial net position, the script calculates the highest and lowest net positions over the selected timeframe and then calculates the index based on this range.
- The index value is a percentage representing where the current net position stands in comparison to the highest and lowest points over the timeframe.
3. **Extreme Marking**:
- The background of the chart changes color when the index reaches extreme levels, making it easier for traders to identify potential overbought or oversold conditions based on commercial net positioning.
Usage:
- **Market Sentiment Analysis**: This script allows traders to track the sentiment of **commercial market participants**, who are often considered "smart money". The COT Index helps identify extremes in positioning, which may signal potential reversals.
- **Trend Analysis**: Changes in the COT Index can provide insight into market trends, with growing or falling net positions potentially indicating market direction.
- **Extreme Value Alerts**: By marking extreme values, the script helps traders identify when the market may be reaching a significant turning point.
Example Use Case:
- Use the **COT Index** to monitor when commercial traders are heavily long or short, which could indicate a significant market move.
- Track the index over time to see if there’s a pattern in how commercial traders position themselves during specific market cycles.
Customizable Features:
- **Timeframe**: Define how far back the script looks to calculate the highest and lowest net positions.
- **Extreme Thresholds**: Set your own thresholds for what constitutes an extreme value in the COT Index (e.g., over 80 for overbought, under 20 for oversold).
- **Plot and Background Colors**: Customize the colors for the COT Index and extreme value backgrounds to suit your preferences.
This script is highly useful for traders who rely on COT data to understand market sentiment and positioning of commercial market participants. It provides a clear visual representation of extremes and trends, helping traders make more informed decisions.
Отказ от ответственности
Все виды контента, которые вы можете увидеть на TradingView, не являются финансовыми, инвестиционными, торговыми или любыми другими рекомендациями. Мы не предоставляем советы по покупке и продаже активов. Подробнее — в Условиях использования TradingView.